1Q25 International Fund Commentary
Southeastern Asset Management is a Memphis-based deep-value firm founded in 1975 by O. Mason Hawkins to exploit the bargains left by the 1973-74 bear market. Its flagship Longleaf Partners Funds (launched 1987) invest employees' own money alongside clients'. Following Graham's discipline and its "Business, People, Price" framework, it runs concentrated books of 15-25 undervalued stocks held for the long term — famously closing funds to new investors when opportunities were scarce. CEO and Head of Research Ross Glotzbach now leads the firm, which publishes quarterly Longleaf fund commentaries and Research Perspectives notes.
In plain words
This commentary breaks down Southeastern’s International Fund performance in Q1 2025. The fund gained 0.73%, lagging the index, but the index’s 6.42% rise was misleading—most stocks actually fell. For everyday investors, the takeaway is clear: don’t chase the few big winners. Instead, focus on domestic-focused, smaller companies with low tariff exposure that are undervalued and resilient. The report digs into specific holdings like Glanbia (a whey protein maker hit by surging costs but trading at a discount) and Becle (a tequila producer with a temporary tariff reprieve). It’s worth reading because it shows how to spot hidden value amid market noise and fragility.
The report argues that the fund's underperformance was primarily driven by an overweight position in the consumer sector and an underweight stance in European industrials, financials, and energy. European markets rallied on expectations of debt-financed fiscal stimulus, leading to significant gains in defense, energy, and industrial stocks.
Theme and Background
This chapter analyzes the performance of the Longleaf Partners International Fund in the first quarter of 2025 and the prevailing market environment. The report notes that the fund returned +0.73%, lagging the FTSE Developed ex North America Index's +6.42%, primarily due to an overweight in the consumer sector and underweights in European industrials, financials, and energy. Markets were driven by expectations of fiscal stimulus financed through European debt issuance, leading to significant gains in defense, energy, and industrial stocks. However, these gains were concentrated in a few large-cap stocks, masking the reality that most stocks declined.
Core Thesis
The author's core investment argument is: Index performance is misleading and masks market fragility. The European STOXX 600 index rose 5.9%, but most stocks actually fell, with gains driven by a handful of large-cap stocks (e.g., aerospace, defense, German industrials). The report argues that this narrow leadership increases the index's vulnerability, a trend that quickly reversed after the April tariff announcements. Counter-intuitive judgment: Despite geopolitical and tariff threats that should have led to negative returns, the fund still achieved positive results, indicating resilience in its holdings and a significant margin of safety at the time of purchase.
Key Arguments and Data
- European Market Divergence: The UK FTSE 100 index rose +6.1%, but the FTSE 250 and FTSE Small-Cap indices fell -5.0% and -4.2%, respectively. The FTSE All-Share index (comprising 600 stocks) still rose +4.5%, highlighting large-cap dominance.
- China/Hong Kong Market: Outperformed the US market significantly for the first time since 2007, driven by the DeepSeek model launch, stimulus measures, and low valuations.
- Tariff Impact: The US announced "reciprocal tariffs" on April 2, imposing 34% on China (stacked on top of the previous 20%), 20% on the EU, 46% on Vietnam, 24% on India, 24% on Japan, and 10% on the UK. Most companies in the fund's portfolio are focused on domestic consumption, limiting direct tariff exposure.
- Portfolio Adjustment: The fund reduced its position in Man Wah (due to high exposure to Vietnamese exports to the US) during the first quarter, shifting towards more domestically-oriented businesses.
Companies/Assets Involved
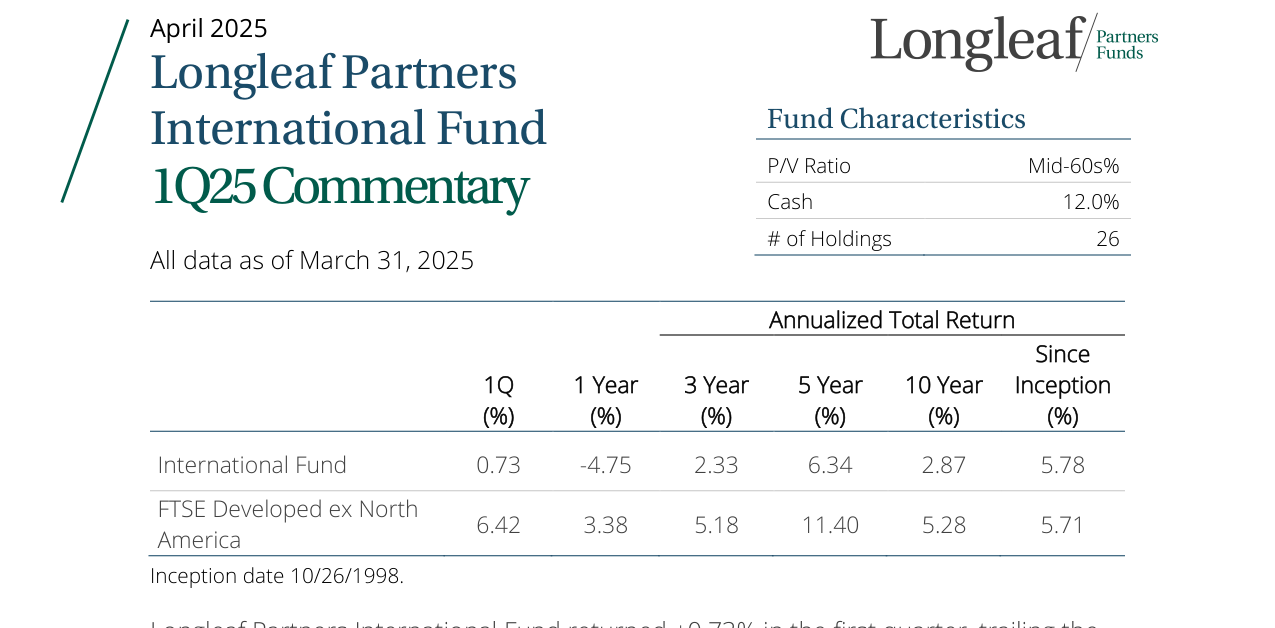
The international fund returned 0.73% in Q1, underperforming its benchmark; annualized return since inception is 5.78%; current holdings: 26 stocks, cash: 12%, P/V ratio: ~65%
- Glanbia: Over 80% of revenue comes from the US, and its products (whey) are produced domestically in the US, with no direct tariff risk. Bullish.
- Samsonite: 36% of revenue comes from the US, with 15% of those products imported from China and 85% from ASEAN countries. It is the company in the portfolio with the highest tariff risk. Neutral to cautious.
- Becle: A tequila manufacturer, its exports to the US are protected by the USMCA, mitigating the worst tariff impacts. Bullish.
- Gruma: A corn tortilla manufacturer, 80% of its value is in the US, employing a local production strategy with no significant tariff risk. Bullish.
Investment Implications
Investors should be wary of the false signals from rising indices and avoid chasing large-cap stocks driven by short-term policy stimulus. The report recommends: Focus on small and mid-cap stocks oriented towards domestic consumption with low tariff risk. These companies, while underperforming in the short term, have solid fundamentals and significant valuation discounts. Simultaneously, reduce exposure to companies with high export reliance on the US or dependence on overseas supply chains (e.g., Man Wah) to mitigate geopolitical uncertainty. The fund's current P/V ratio is in the mid-60% range, with a 12.0% cash position, providing a safety cushion for buying on dips.
Continuation Analysis: Deep Insights into Lanxess, Millicom, Prosus, and Richemont
1. Lanxess: The Interplay of Geopolitics and Internal Reform
Lanxess's stock price performance reflects the complex interaction between macroeconomic expectations and company fundamentals. Although approximately 30% of the company's revenue comes from US local production, its exposure to the German market (about 25% production, 15% demand) makes it a direct beneficiary of expectations for an end to the Russia-Ukraine war. However, we are cautious about this logic:

- Natural Gas Supply Uncertainty: While lower German natural gas prices help reduce input costs, there is significant uncertainty regarding the actual scale of resumed Russian gas supply via Ukrainian pipelines. The new German Chancellor Merz's proposed €500 billion infrastructure plan is positive for the domestic construction market, but its actual implementation requires time to verify.
- Internal Reform Progress: The company's more controllable levers include:
- Sale of Urethanes Division: Completed, generating €500 million in net proceeds, used to reduce leverage to approximately 3x.
- Cost Savings: Q4 results met expectations. The 2025 guidance implies 10% EBITDA growth (conservative), but with very high incremental margins; demand recovery will directly drive capacity utilization.
- Exit from Envalior Joint Venture: A put option exercisable in April 2026 guarantees an exit multiple of 12x EBITDA. The value of this asset and shareholder loans exceeds 35% of Lanxess's current market capitalization, but the market underestimates it due to disclosure limitations. A public report by S&P Global (December 13, 2024) clearly identifies its value. We expect this to generate significant cash inflow for further debt reduction and potential buybacks.
Comparative Data: Lanxess's Valuation vs. Asset Value Gap
| Metric | Current Market Valuation | Implied Asset Value (Based on Envalior Exit) |
|---|---|---|
| Enterprise Value/EBITDA | 8.5x | 12x (Guaranteed Multiple) |
| Net Debt/EBITDA | 3.0x | 1.5x (Post-Exit Assumption) |
| Market Cap (€ billions) | 4.5 | 6.0+ (Including Envalior Value) |
2. Millicom: The Inflection Point for Free Cash Flow

Millicom's performance validates our core thesis since 2023: operational improvements driving free cash flow growth, ultimately recognized by the market. Key data:
- 2024 Free Cash Flow: Ultimately achieved $728 million, exceeding the twice-upgraded guidance of $650 million.
- 2025 Guidance: Targeting $750 million, based on OPEX and CAPEX efficiency improvements.
- Capital Allocation: Resumed dividends in December 2024 after reaching the 2.5x steady-state leverage target. The current dividend of $3 per share (hard currency) yields over 10%, combined with a $150 million buyback program, significantly reducing downside risk.
Rich Catalysts:
- Delisting from Swedish Stock Exchange: Completed in March 2025, leaving only the US listing. This is expected to improve liquidity and institutional investor interest, narrowing the price-to-value gap.
- Acquisition of Telefonica's Colombia Business: A $1 billion transaction, expected to receive regulatory approval by year-end, creating value through operational turnaround and cost synergies.
Improved Risk/Reward: The current 10%+ dividend yield provides downside protection, while free cash flow growth and M&A catalysts offer upside potential.
3. Prosus: Value Unlocking Driven by Tencent

Prosus's strong performance was primarily driven by Tencent (representing ~80% of NAV). Tencent's Q4 results exceeded expectations: revenue grew 11% YoY, and adjusted net profit grew 30%, benefiting from improved operating leverage. AI investments (including its proprietary Hunyuan model and a multi-model strategy) are enhancing ad targeting, content creation, and operational efficiency. With WeChat's 1.3 billion monthly active users, high returns from AI applications are anticipated.
Capital Allocation:
- Open-ended Buyback: Ongoing, narrowing the NAV discount.
- Acquisitions: Acquired Just Eat Takeaway (food delivery) and Despegar (online travel) for approximately $6 billion (3% of NAV) at reasonable prices, expanding core businesses.
Comparative Data: Prosus's NAV Discount and Buyback Effectiveness
| Time | NAV Discount Rate | Buyback Scale ($ billions) | Per Share NAV Change |
|---|---|---|---|
| Early 2024 | 45% | 3.0 | +8% |
| Q1 2025 | 35% | 1.5 (Quarterly) | +5% |

4. Richemont: Realization of Brand Power and Structural Advantages
Richemont's Q3 results (Oct-Dec 2024) demonstrated brand pricing power: comparable store sales grew 10%, significantly exceeding expectations. The US market performed strongly, with only China showing weakness. We gradually reduced our position as the stock price approached fair value (Price/Value near 100%), eventually exiting completely, thereby avoiding the subsequent pullback driven by tariff concerns and consumer weakness.
Long-term Structural Advantages:
- Hard Luxury Outperforms Soft Luxury: Jewelry and watches possess long-term value storage characteristics, and purchases are tied to specific occasions (engagements, birthdays, anniversaries), making demand more stable.
- Low Brand Penetration: Global brand penetration for hard luxury is much lower than for soft luxury. Emerging markets still rely on precious metals rather than brand design, providing long-term market share growth opportunities for Cartier and Van Cleef & Arpels.
Exit Timing Validation: After our exit, the market experienced a stock price correction due to tariff and consumption concerns, validating the effectiveness of our disciplined value realization strategy.
Summary: Balancing Value Realization and Risk Management

The portfolio adjustments this quarter reflect our core investment philosophy:
- Millicom: Free cash flow inflection point realized; dividends + buybacks provide downside protection; M&A catalysts offer upside.
- Prosus: Tencent's AI investments and narrowing NAV discount provide dual drivers.
- Lanxess: Geopolitical expectations and internal reforms run in parallel; the Envalior exit is a key catalyst.
- Richemont: Brand power drove value realization, but we exited near fair value to avoid macro risks.
Key Risks: Lanxess's German exposure faces geopolitical uncertainty; Millicom's M&A faces regulatory approval delays; Prosus's NAV discount narrowing depends on Tencent's stock performance.
New Analysis: Deep Insights into Glanbia, Becle, and Jollibee
Glanbia: The Battle Between Supply Chain Woes and Value Underestimation
Glanbia's case reveals the impact of raw material price volatility on vertically integrated companies. Although the company is both the largest consumer and producer of Whey Protein Isolate (WPI), WPI prices broke historical peaks in H2 2024 and continued rising into early 2025, forcing the company to make forward purchases at costs significantly above budget. This "self-produced, self-consumed" model failed to hedge against market anomalies, highlighting the unpredictability of commodity markets.

- Quantifying the Cost Shock: Glanbia offset 75% of the $200 million in additional costs through mitigation measures, but the remaining $50 million still led to a 9% downward revision of 2025 guidance. The market overreacted, with the stock price falling approximately 27%, over three times the magnitude of the guidance cut, indicating fragile investor confidence in profitability.
- Competitive Pressure: Costco introduced a Kirkland Signature competitor in Q3 2024, directly impacting sales of Glanbia's core brand, Optimum Nutrition (ON) protein powder. Although ON sales have not shown sustained deterioration, the market views this as a structural threat. Comparative data:
| Metric | Glanbia (ON) | Kirkland (Costco) |
|---|---|---|
| Channel Share | Mid-teens % of sales | New entrant, growth driver |
| Price Positioning | Premium (Brand Premium) | Value (Private Label) |
| Sales Impact | Stable but under pressure | Initial diversion, not worsening |
- Asset Value Mismatch: Glanbia currently trades at a P/E of only 9x, far below its comparable companies in each business segment. For example, the median P/E for comparable sports nutrition brands is ~15-20x, and for ingredients and dairy, ~12-15x. The company has announced a restructuring into three divisions (including a newly created Dairy Protein division), paving the way for potential divestitures. We estimate the standalone value of the Dairy Protein business represents approximately 50% of the company's enterprise value (EV), while the consumer brands (GPN) and ingredients business (Health & Nutrition) are also potential divestiture targets.
Becle: Tariff Risk and the Window for Value Repair
Becle's difficulties stem from industry weakness and geopolitical uncertainty. The initial threat of tariffs on Mexico by the Trump administration cast a shadow over the tequila industry's outlook. However, the tariff pause at the end of Q1 2025 provided Becle with some breathing room.

- Valuation Comparison: Becle currently trades significantly below its private market value and below all its historical valuation metrics as a public company (including during the first Trump administration). For instance, its EV/EBITDA multiple is approximately 8-10x, compared to 12-15x for comparable beverage companies like Constellation Brands.
- Internal Controllable Factors: The company can unlock value by optimizing capital allocation (e.g., accelerating share buybacks, divesting non-core assets). We have communicated with management, emphasizing the importance of 2025 as a "year to validate the growth path."
Jollibee: Growing Pains in International Expansion vs. Domestic Resilience
Jollibee's Q4 results showed solid domestic (Philippines) performance (SSSG rising from 6.4% to 7.4%), but international operations dragged down overall results. China EBITDA plummeted 57% YoY, and Smashburger's US EBITDA turned negative again.
- China Challenges: Intense competition (e.g., promotional wars with local brands like Wallace and KFC) combined with weak consumer spending. Jollibee is shifting towards an asset-light strategy (e.g., reducing company-owned stores, increasing franchising) to control losses.
- Smashburger Struggles: Menu adjustments and marketing investments did not meet expectations. New President Jim Sullivan is implementing cost-cutting measures, but their effectiveness remains to be seen. Comparative data for the US burger market:
| Brand | Comparable Store Sales Growth (2024) | Average Daily Sales (USD) | Number of US Stores |
|---|---|---|---|
| Jollibee | +8% | 13,300 | ~100 |
| KFC | ~2% | 4,500 | ~4,000 |
| Popeyes | ~3% | 6,500 | ~3,000 |

- Franchising Potential: Jollibee's North American franchising program launched in March 2025, potentially accelerating expansion. Coffee Bean & Tea Leaf's franchising will also expand beyond Malaysia and Singapore, but short-term contributions are limited.
Comparative Summary: Value Repair Paths for Three Companies
| Company | Core Issue | Valuation Level (P/E) | Catalysts | Risk Factors |
|---|---|---|---|---|
| Glanbia | WPI cost surge + increased competition | 9x | Business split/divestiture, cost mitigation | Sustained price increases, worsening Costco competition |
| Becle | Industry weakness + tariff uncertainty | 8-10x EV/EBITDA | Tariff pause, capital allocation optimization | Trump policy reversals, weak consumer demand |
| Jollibee | International business losses | 15-18x | China asset-light strategy, Smashburger turnaround | Local competition, franchise execution risk |
Conclusion: Glanbia's asset value mismatch is the most significant, but requires decisive management action. Becle's valuation repair depends on an improving external environment. Jollibee's domestic resilience provides a safety cushion, but its international business needs time to prove itself. We continue to engage with the management of all three companies to drive value realization.