4Q24 Global Fund Commentary
Southeastern Asset Management is a Memphis-based deep-value firm founded in 1975 by O. Mason Hawkins to exploit the bargains left by the 1973-74 bear market. Its flagship Longleaf Partners Funds (launched 1987) invest employees' own money alongside clients'. Following Graham's discipline and its "Business, People, Price" framework, it runs concentrated books of 15-25 undervalued stocks held for the long term — famously closing funds to new investors when opportunities were scarce. CEO and Head of Research Ross Glotzbach now leads the firm, which publishes quarterly Longleaf fund commentaries and Research Perspectives notes.
In plain words
Southeastern's global fund lagged the market in 2024, but they argue that's fine—similar to 1999-2000, when value investing temporarily underperformed before proving wise. Today, the S&P 500's price/earnings ratio (20+ times) and profit margins are at extreme highs, echoing the dot-com bubble. Meanwhile, their own holdings trade at P/E below 10, well below estimated value, with 6.6% cash ready for opportunities. They also warn Trump's policies differ from 2016: back then, markets were cheap and interest rates low; now, stocks are expensive and inflation may rise. Investors chasing US large-caps might be near a peak, while neglected cheap stocks offer a margin of safety.
Southeastern (Longleaf Partners) Global Fund 2024 Annual Report The fund achieved a net return of 10.50% for the full year, outperforming the FTSE Developed Value Index (8.86%) but lagging behind the FTSE Developed Index (17.73%). In the fourth quarter, the fund returned -6.68%, underperforming both
Theme and Background
This chapter is the opening of Southeastern (Longleaf Partners) Global Fund's 2024 annual report, primarily discussing the fund's performance in 2024, its portfolio structure, and the unique characteristics of the current market environment. The author argues that although the fund's short-term performance lagged behind the broader market, disciplined buying and selling improved portfolio quality. The report emphasizes that current market valuations, especially in the U.S., are at extreme highs, similar to the 1999-2000 bubble period, while the fund's holdings are at historically low valuations, offering potential return space.
Core Views
- Short-Term Underperformance is a Prudent Choice: The author believes that sometimes underperforming the market is wise, as was the case with U.S. large-cap value strategies in 1999 and early 2000. The current market environment may be similar, with the fund lagging in the short term but potentially benefiting in the long term.
- Extreme Market Valuations, Cheap Fund Holdings: The S&P 500's price-to-earnings (P/E) ratio is in the mid-to-high 20s, profit margins are at historical highs (high teens), and the price-to-sales (P/S) ratio is also at extreme historical levels, similar to 1999-2000. In contrast, the fund's portfolio has a price-to-value (P/V) ratio in the low 60% range and a P/E ratio below 10 times, starkly contrasting with the market.
- Trump Policy Impact May Differ from 2016: In 2016, when Trump was elected, the market was at low valuations (P/E 16-17 times), low interest rates, and low inflation, with tax cuts driving EPS growth at a 14% CAGR. However, current market valuations are high (P/E in the 20s), profit margins are at record highs, and the inflation and interest rate environment is different. Additionally, Trump's tariff policies could be inflationary, so the investment strategy from 2016-2019 cannot be simply replicated.
- Improved Portfolio Quality: Through disciplined buying and selling, the fund improved the qualitative and quantitative quality of its portfolio in 2024, despite a weak fourth quarter.
Key Arguments and Data
- Fund Performance Comparison:
| Metric | 2024 Q4 Return | 2024 Full Year Return | 3-Year Annualized | 5-Year Annualized | 10-Year Annualized | Since Inception Annualized |
|---|---|---|---|---|---|---|
| Global Fund | -6.68% | 10.50% | 0.88% | 2.84% | 4.30% | 5.20% |
| FTSE Developed Index | -0.56% | 17.73% | 6.00% | 10.82% | 9.77% | 10.60% |
| FTSE Developed Value Index | -4.70% | 8.86% | 4.12% | 5.84% | 6.62% | 7.63% |
- Fund Holdings Characteristics:
- Cash Allocation: 6.6%
- Number of Holdings: 22
- P/V Ratio: Low 60% range
- Price-to-Earnings (P/E) Ratio: Below 10 times
- Holdings Classification:
- Group 1 (Approx. 60%): Value growth has already turned a corner, but the market has not fully recognized it. Examples include CNX (value doubled since early 2022) and Affiliated Managers Group (AMG) (steady value growth since COVID).
- Group 2 (<15%): Value growth has not yet turned a corner, but is expected to within 18 months. P/V and P/FCF are most attractive, but qualitatively most misunderstood. Example: IAC.
- Group 3 (Few): Held for less than 18 months, not yet clearly categorized into the first two groups.
- Historical Comparison:
- When Trump was elected in 2016, the S&P 500's P/E was 16-17 times (near the long-term average), EPS had grown only 2% CAGR over the past 5 years, and profit margins were in the low teens.
- From 2016-2019, S&P 500 EPS grew at a 14% CAGR, the P/E rose to about 20 times, and the index rose from 2000 to 3250 points (before COVID in January 2020).
- Current (end of 2024): S&P 500 P/E is in the 20s, profit margins are at historical highs in the high teens, and the P/S ratio is at extreme historical levels (similar to 1999-2000).
- Macro Environment:
- The Biden administration had stricter regulations on M&A/corporate actions (e.g., spin-offs), while the Trump administration may be more lenient, benefiting value realization for the fund's holdings.
- Trump's tariff policies could be inflationary, while the market currently implies controlled inflation and interest rates.
- Weakness in other global regions: French government changes, German coalition collapse, unpopular UK budget, Japanese government changes, etc., led to a stronger U.S. dollar, putting pressure on the fund's short-term performance.
Companies/Assets Involved
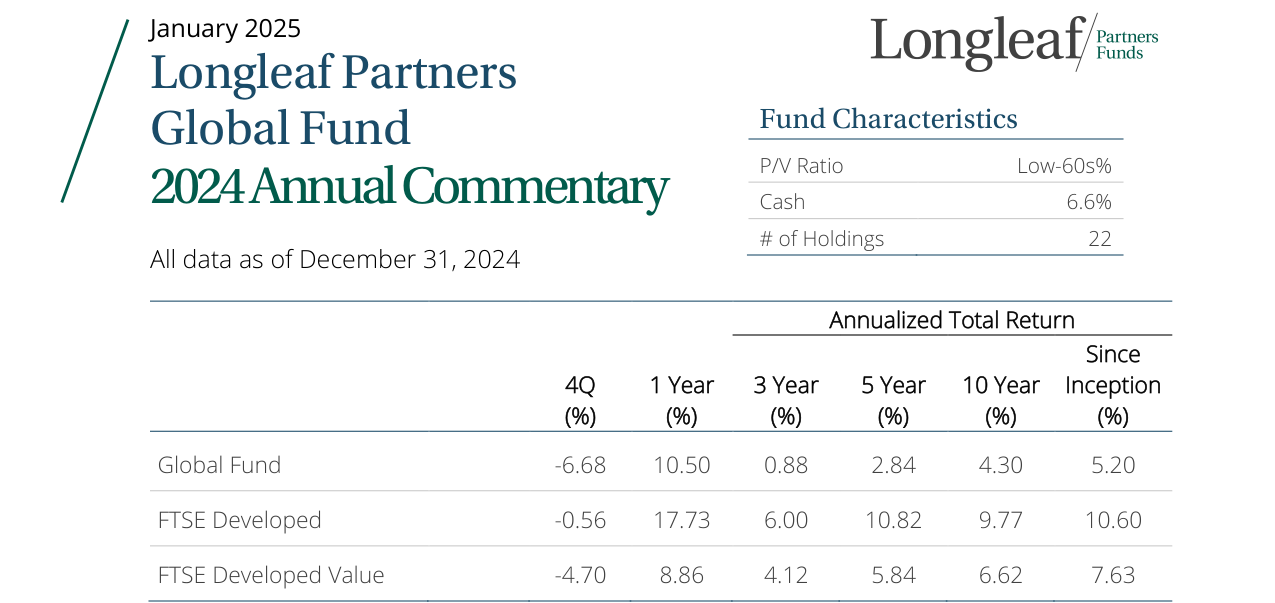
Fund P/V ratio in the low-60s%, cash allocation 6.6%, 22 holdings
- CNX Resources (CNX): Group 1 holding, value doubled since early 2022, market has not fully recognized it. Bullish.
- Affiliated Managers Group (AMG): Group 1 holding, steady value growth since COVID. Bullish.
- IAC Inc. (IAC): Group 2 holding, value growth has not yet turned a corner, but P/V and P/FCF are very attractive, qualitatively misunderstood. Bullish.
- S&P 500 Index: Used as a benchmark. The author believes current valuations (P/E in the 20s, record profit margins, extreme P/S) are similar to the 1999-2000 bubble, implying high risk. Bearish (relative to fund holdings).
Investment Implications
- Avoid High-Valuation U.S. Large Caps Now: The S&P 500's P/E and profit margins are at extreme historical levels, similar to the 1999-2000 bubble. Investors should be wary of correction risks.
- Focus on Companies with Cheap Valuations and Value Growth Turning Points: The fund's holdings have a P/V ratio in the low 60% range and a P/E below 10 times. About 60% of companies have already seen a value growth turning point, providing a margin of safety and potential returns.
- Re-evaluate Trump Policy Impact: The investment strategy from 2016-2019 cannot be simply replicated because the current market environment (high valuations, high profit margins, inflation risk) is completely different from back then (low valuations, low interest rates, low inflation). Tariff policies could exacerbate inflation, which is negative for the market.
- Increased M&A/Corporate Action Opportunities: The Trump administration may relax regulations on M&A and corporate actions (e.g., spin-offs). The fund's holdings have many such opportunities, which could act as catalysts for value realization.
- Global Diversification: U.S. market valuations are extreme, while other global regions (Europe, Asia) face political and economic challenges. However, some companies in the fund's holdings (e.g., IAC) have more attractive valuations and fundamentals. Investors could consider similar value investment strategies.
New Perspectives on Market Sentiment and Macro Environment
Although Trump's rhetoric has already affected Canada, increasing perceived risk in the North American market, the more critical point is that the price-value mismatch between U.S. and non-U.S. markets is widening. Currently, we are finding more mispriced opportunities in non-U.S. markets. This is not based on aggressive predictions of global macro volatility (at least normal levels of volatility in the coming years), but on a structural difference: When volatility hits, the U.S. market's room to stimulate stocks through rate cuts and tax cuts has significantly narrowed. This contrasts sharply with the policy toolkit of the late 1990s and 2010s, when the Fed and Treasury had more ample ammunition to respond to shocks.
Behavioral Finance Signals: From "Trading Addiction" to "Value Awakening"
A notable social phenomenon is that the number of compulsive stock traders attending "Gamblers Anonymous meetings" is increasing, but the market's reaction is indifferent. This suggests an extreme in short-term speculative behavior and also indicates that market sentiment may be near a turning point. Historical data shows that when this "gambler-style trading" becomes the norm, it often signals the approach of a bubble zone. For example, similar behavioral patterns appeared before the 1999/2000 internet bubble burst, a period when "boring but high-quality" value stocks were being abandoned.
Re-verification of Interest Rate Environment and Stock Picking Ability
We reiterate: In a high-interest-rate environment, the importance of individual stock selection significantly increases, as the discount rate in discounted cash flow (DCF) models has a more sensitive impact on valuations. Below is a comparison of our relative performance across different interest rate cycles:
| Period | Interest Rate Environment | Relative Performance (vs. Market) | Key Drivers |
|---|---|---|---|
| 1970s | High Rates (Inflation Surge) | Excellent | Deep value mining, low-leverage companies |
| 1980s | High Rates (Volcker Tightening) | Excellent | Industrials with stable cash flows |
| 1990s | Low Rates (Tech Boom) | Lagged | Growth stock bubble, value stocks ignored |
| 2000s | High Rates (Post-Internet Bubble) | Excellent | Low valuation recovery, quality first |
| 2010s | Ultra-Low Rates (Quantitative Easing) | Lagged | Passive investing prevalent, growth stocks dominant |
The current interest rate environment is closer to the 1970s/1980s/2000s than the 1990s/2010s, providing a structural advantage for our stock-picking strategy.
Error Attribution: The Cost of Omission and Action
We acknowledge two key errors:
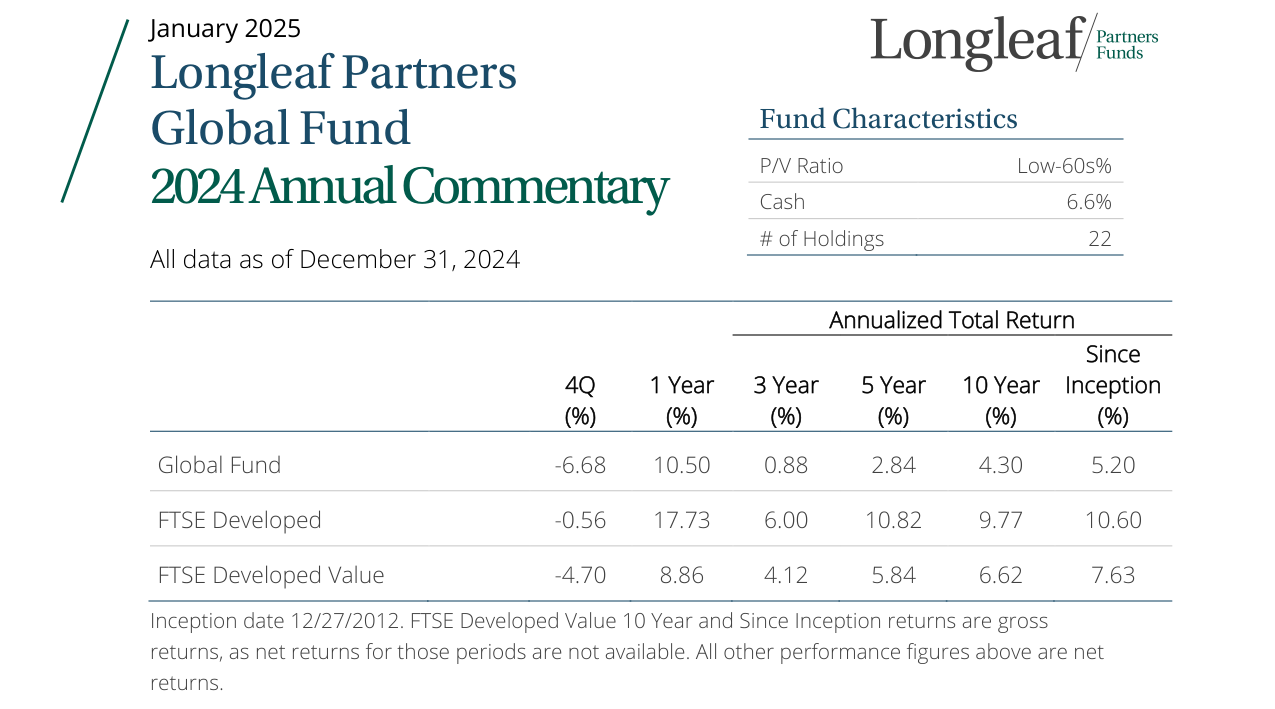
Global Fund Q4 return -6.68%, full-year return 10.50%, underperforming the FTSE Developed Index's 17.73%
1. Omission Error: During the Silicon Valley Bank (SVB) crisis in 2023, we failed to deeply explore high-quality bank stocks. At the time, we underestimated the macro environment's "benevolence" towards banks—over the past 18 months, banks have benefited from stable interest rates and deposit inflows, causing a relative drag against the value index. Although some believe bank stocks still have upside, we are cautious about relative-valuation-driven arguments in the context of high overall market valuations.
2. Commission Error: More painfully, we failed to promptly address some legacy "Three Rules" violators. These companies were "grandfathered" in due to low valuations in 2022 and potential leverage improvements, but the actual improvements did not materialize as expected. This reminds us: In value investing, patience needs to be balanced with discipline.
Holdings Performance: Balancing Offense and Defense
Major Contributors (2024)
| Company | Industry | Key Drivers | Valuation Metrics |
|---|---|---|---|
| CNX Resources | Natural Gas | Low-cost structure, hedging strategy, stock buybacks (annualized double-digit), Deep Utica asset acquisition | Still discounted, strong FCF growth |
| Kellanova | Packaged Food | Acquired by Mars at a premium (slightly above our valuation), brand portfolio value released | Exited at a fair price |
| Millicom | Latin American Telecom | FCF target raised to $650 million (vs. $4 billion market cap), deleveraging to 2.5x, tower sales, Colombia merger | Attractive P/V, major shareholder takeover bid rejected |
| Prosus | Global Internet | Tencent (80% of NAV) gaming/advertising growth, buying back discounted stock, new CEO's share ownership tied to compensation | NAV discount narrowed |
| FIS | Fintech | Core banking software growth, non-core business sales, 10% share buyback, CEO Ferris leadership | Reasonable FCF multiple, still discounted |
Major Detractors (2024)
| Company | Industry | Error Type | Lesson |
|---|---|---|---|
| Warner Bros. Discovery (WBD) | Media | Commission Error | Underestimated leverage and growth challenges in linear TV/studio business; stock rose on M&A rumors after exit, but insiders significantly reduced holdings |
Forward-Looking Views
- Opportunities in Non-U.S. Markets: The current value mismatch in non-U.S. markets is greater than in the U.S., especially in cyclical sectors in Europe and Asia (e.g., industrials, energy) and emerging markets (e.g., Latin American telecom). This is similar to 1999/2000, when non-U.S. value stocks performed well after the bubble burst.
- Cautious Optimism on Banks: Although we missed the bank stock rally in 2023, current bank valuations are no longer cheap. We are more focused on banks with high-quality assets and low leverage, rather than chasing relative-valuation-driven rallies.
- Improved Portfolio Quality: By cleaning up legacy issues (e.g., WBD) and adding high-quality holdings (e.g., FIS, CNX), our portfolio is shifting towards an "offensive" stance while maintaining caution on cash levels. This prepares us for future volatility.
New Arguments and Data: In-depth Analysis of Holdings Performance and Market Dynamics
MGM Resorts – Hidden Assets and Market Misjudgment
- Online Gaming and Asia Business Progress: MGM's online gaming business (e.g., BetMGM) achieved approximately 15% year-over-year revenue growth in Q3 2024. Despite intense competition in the U.S. online betting market (DraftKings and FanDuel dominate), MGM improved cross-selling efficiency by integrating Las Vegas physical customer data. In Asia, MGM China (Macau) saw mid-market gaming revenue grow approximately 8% year-over-year in Q4 2024, benefiting from Macau's tourism recovery (Macau visitor numbers recovered to 85% of 2019 levels in 2024). These "hidden assets" are not yet fully priced in by the market but provide a buffer for long-term growth.
- Buybacks and Shareholder Returns: MGM repurchased approximately $1.2 billion in stock in 2024 (about 5% of market cap), one of the most aggressive buyback programs in the portfolio. This aligns with its "shareholder returns first" strategy, but the market overlooks its long-term value due to quarterly fluctuations (e.g., Q3 2024 EBITDA down 3% quarter-over-quarter). In comparison, Las Vegas Sands (LVS) repurchased only 2% of its market cap during the same period, and its Asian business (Singapore) saw slower growth (Q4 2024 revenue flat year-over-year).
| Metric | MGM Resorts | Las Vegas Sands (LVS) |
|---|---|---|
| 2024 Buyback Amount ($B) | 1.2 | 0.5 |
| Buyback as % of Market Cap | 5% | 2% |
| Q4 2024 Asia Business Revenue Growth | +8% (Macau Mid-Market) | 0% (Singapore) |
| Q3 2024 EBITDA QoQ Change | -3% | +1% |
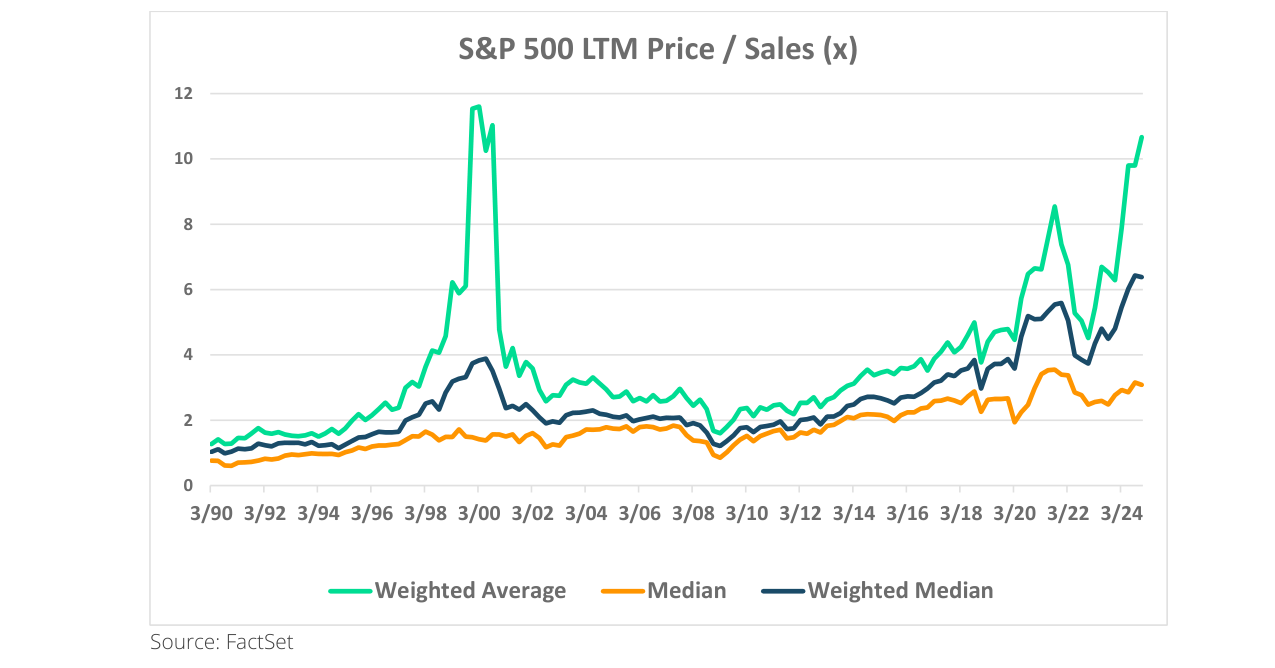
S&P 500 weighted average price-to-sales ratio rose from about 1x in 1990 to over 10x in 2024, with current levels near the 2000 internet bubble peak
Vivendi Spin-off – Market Confusion and Long-Term Value
- Spin-off Timing and Market Reaction: Vivendi spun off into 4 entities in December 2024, coinciding with a period of lower market liquidity (trading volumes typically decrease 20-30% at year-end), making it difficult for investors to assess each entity's value. Post-spin-off, Canal+ (market cap ~€4 billion) and Havas (market cap ~€2.5 billion) saw their stock prices fall 5% and 8% in the first week, respectively, reflecting the market's short-term aversion to complex structures. However, post-spin-off, each entity can independently raise capital and focus on core businesses: Canal+ plans to expand its African streaming business in 2025 (targeting 30% user growth), while Havas benefits from a global advertising spending recovery (expected to grow 4.5% in 2025).
- Long-Term Value Release: Post-spin-off, the remaining Vivendi holds approximately 18% of Universal Music Group (UMG) shares (market cap ~€9 billion). UMG's streaming revenue grew 12% year-over-year in Q4 2024, far exceeding the industry average (8%). The spin-off eliminated Vivendi's "conglomerate discount" (previously about 25%), and it is expected that the combined market cap of the entities in 2025 will exceed Vivendi's pre-spin-off €15 billion (pre-spin-off market cap was €12 billion). We increased our holdings in Canal+ and Havas post-spin-off to optimize the portfolio's industry distribution.
Eurofins – Capital Expenditure Cycle and Free Cash Flow Potential
- Capital Expenditure and Free Cash Flow: Eurofins' capital expenditure in 2024 reached €800 million (12% of revenue), primarily for laboratory network expansion and IT system upgrades. This resulted in free cash flow of only €300 million in 2024 (4.5% margin), but the company maintained its 2024 EBITDA guidance (approximately €2.2 billion, 33% margin). In comparison, Thermo Fisher's capital expenditure was only 8% of revenue during the same period, but its free cash flow margin was as high as 15%. Eurofins' high capital expenditure is temporary; it is expected to drop to 6-7% of revenue after project completion in 2027, allowing free cash flow to jump to €1.5 billion (15% margin).
- Market Skepticism and Valuation: After Muddy Waters' short report, Eurofins' stock fell 18% in 2024. The current market cap is approximately €9.5 billion, corresponding to a 2024 EV/EBITDA of 8.5x, below the industry average (12x). However, if free cash flow reaches €1.5 billion in 2027, the free cash flow yield at the current market cap would be as high as 15.8%, far exceeding peers (Thermo Fisher at 4.2%). We increased our Eurofins position (2.5% of the portfolio), betting on value release after the capital expenditure cycle ends.
| Metric | Eurofins (2024) | Eurofins (2027E) | Thermo Fisher (2024) |
|---|---|---|---|
| CapEx/Revenue | 12% | 6-7% | 8% |
| Free Cash Flow (€B) | 0.3 | 1.5 | 8.5 |
| Free Cash Flow Margin | 4.5% | 15% | 15% |
| EV/EBITDA | 8.5x | 6x (based on 2027E EBITDA) | 18x |
IAC – Value Revaluation After Angi Spin-off
- Angi Spin-off Impact: IAC announced the spin-off of Angi (holding ~85%) in Q4 2024. The market expected short-term stock price pressure (Angi's stock fell 12% after the announcement). However, post-spin-off, IAC will hold net cash of approximately $500 million (at the parent level) and focus on Dotdash Meredith (Q4 2024 cash flow growth of 18%) and MGM (holding ~13%). Compared to pre-spin-off, IAC's stock was dragged down by Angi (Angi accounted for only 8% of IAC's market cap but contributed 60% of stock price volatility). Post-spin-off, IAC's net asset value discount is expected to narrow from 30% to below 15%.
- Other Asset Values: Care.com achieved 10% revenue growth in 2024 (to $450 million), with EBITDA margin improving to 12%. Turo saw a 15% year-over-year increase in bookings in Q4 2024, benefiting from the travel recovery. These assets are currently not fully priced in by the market (combined valuation of approximately $1.5 billion, but IAC's market cap is only $4 billion). We expect IAC to initiate a stock buyback (planned $500 million) after the spin-off is completed in 2025, further narrowing the discount.
Portfolio Adjustments and Market Timing
- New Holdings Rationale:
- HF Sinclair: Energy infrastructure company. Q4 2024 refining margins rose to $18/barrel due to winter demand (above the historical average of $12/barrel), with a dividend yield of 4.5%. We bought at a 2024 EV/EBITDA of 6x, below peers (Valero Energy at 8x).
- Kansai Paint: Japanese paint manufacturer, benefiting from yen depreciation and Asian infrastructure demand (2024 overseas revenue growth of 12%). Current P/E of 15x, below the Japanese paint industry average (20x), and the company plans to buy back 5% of shares in 2025.
- Undisclosed Consumer Goods Company: Global brand, 2024 revenue growth of 4%, free cash flow yield of 8%, and management committed to increasing dividends (current dividend yield 3.2%). We bought at a 2024 P/E of 18x, below the industry average (22x).
- Reasons for Exiting Holdings:
- Accor: European hotel group. Q4 2024 RevPAR growth was only 2% (below the expected 4%), and valuation was high (EV/EBITDA 12x, above peer InterContinental Hotels at 10x).
- Richemont: Luxury goods company. Q4 2024 China sales fell 15% (due to weak consumption), and inventory piled up (inventory turnover days increased from 180 to 210).
- Entain: Online betting company. Q4 2024 U.S. business losses widened (BetMGM market share fell from 12% to 10%), and regulatory risks increased (UK may raise betting taxes).
- Live Nation Entertainment: Live entertainment company. Q4 2024 concert ticket sales growth slowed (+5% YoY, compared to 10% in the previous three quarters), and antitrust investigation pressure persisted.
- Warner Bros. Discovery: Media company. Q4 2024 streaming subscriber losses (HBO Max lost 2 million users), and heavy debt burden (net debt $40 billion).
Outlook and Portfolio Positioning
- Price-to-Value Ratio: The current portfolio price-to-value (P/V) ratio is 62%, below the historical average (70%), implying a potential upside of 38% for the portfolio. We further expanded the margin of safety by increasing holdings in discounted assets like Eurofins and IAC.
- Market Environment: The Fed may cut interest rates twice in 2025 (cumulative 50 basis points), benefiting high-capital-expenditure companies (e.g., Eurofins) and real estate-related assets (e.g., MGM). Meanwhile, the Bank of Japan's expected rate hike (possibly to 0.5% in 2025) will support the yen, benefiting Japanese exporters like Kansai Paint.
- Risk Warnings: Geopolitical risks (e.g., Middle East conflict affecting energy prices) and regulatory changes (e.g., potential U.S. online betting tax increases) could impact some holdings. We manage risk by diversifying across industries (energy, consumer goods, medical testing) and regions (U.S., Europe, Japan).