Theme and Background
This chapter reviews the performance of the Southeastern (Longleaf Partners) International Fund for the fourth quarter and full year of 2023. The report notes that global markets experienced heightened volatility in 2023 due to inflation concerns, but the fund believes its portfolio holds a structural advantage in a high-inflation, high-interest-rate environment. The fund returned 17.42% for the full year, slightly underperforming the benchmark FTSE Developed ex-North America Index, which returned 18.36%.
Core Thesis
The author's core investment argument is that in an environment of rising capital costs, high-quality companies with pricing power, genuine cash flows, and earnings growth will regain market favor, while low-quality companies will face margin pressure. Counter-intuitive judgments include: 1) Interest rate normalization is overall a positive, not a negative, for the fund's portfolio; 2) Chinese assets are deemed "uninvestable" by Western investors, but locals and insiders are buying heavily, with valuations at extreme lows; 3) The fund actively adjusted its portfolio, exiting positions that did not meet IRR expectations and upgrading to higher-quality companies.
Key Arguments and Data
- Performance Comparison: The fund returned 7.40% in Q4 2023 and 17.42% for the full year; the benchmark FTSE Developed ex-North America Index returned 18.36% for the full year. The fund's 3-year, 5-year, and 10-year annualized returns were -1.82%, 2.32%, and 1.32%, respectively, all below the benchmark.
- Valuation Levels: As of December 31, 2023, the fund's P/V ratio was in the high 60% range, with a cash position of 7.1% and holdings in 24 stocks.
- Regional Drag: Asian allocation (overweight China, underweight Japan) was the primary drag on relative performance for the full year. Hong Kong and China were the only major markets to decline by more than 10% in 2023 (in USD terms), while other global markets rose 15-25%. The Hang Seng Index recorded its first four consecutive years of decline since its launch in 1969.
- Extreme Undervaluation of Chinese Assets: Share buybacks by Hong Kong-listed companies reached a record high, while the price-to-earnings (P/E) ratio hit a 20-year low. The fund's China-related holdings (Alibaba, Man Wah, Melco, WH Group, Prosus) all trade at single-digit multiples of normalized free cash flow.
- Portfolio Adjustments: Following the appointment of new portfolio managers Manish Sharma and John Woodman, the fund proactively reassessed all holdings, exited positions in Gree, CK Hutchison, Lazard, and others that did not meet IRR expectations, and added several new names with significant potential.
Comparative Data Table:
| Metric |
Fund |
Benchmark (FTSE Developed ex-North America) |
| Q4 2023 Return |
7.40% |
10.65% |
| 2023 Full Year Return |
17.42% |
18.36% |
| 3-Year Annualized Return |
-1.82% |
3.30% |
| 5-Year Annualized Return |
2.32% |
8.06% |
| 10-Year Annualized Return |
1.32% |
4.34% |
Top 5 and Bottom 5 Contributors in 2023:
| Top 5 Companies |
Return |
Contribution |
Weight |
Bottom 5 Companies |
Return |
Contribution |
Weight |
| Applus Services |
69% |
2.87% |
0.0% |
Melco International |
-35% |
-1.33% |
2.3% |
| Accor |
57% |
2.54% |
5.3% |
Delivery Hero |
-34% |
-1.19% |
2.8% |
| Fairfax Financial |
58% |
2.32% |
3.9% |
LANXESS |
-20% |
-0.78% |
3.3% |
| GRUMA |
40% |
2.08% |
4.8% |
Alibaba |
-11% |
-0.53% |
3.2% |
| EXOR |
37% |
2.03% |
5.8% |
Juventus |
-16% |
-0.47% |
1.5% |
Companies/Assets Involved
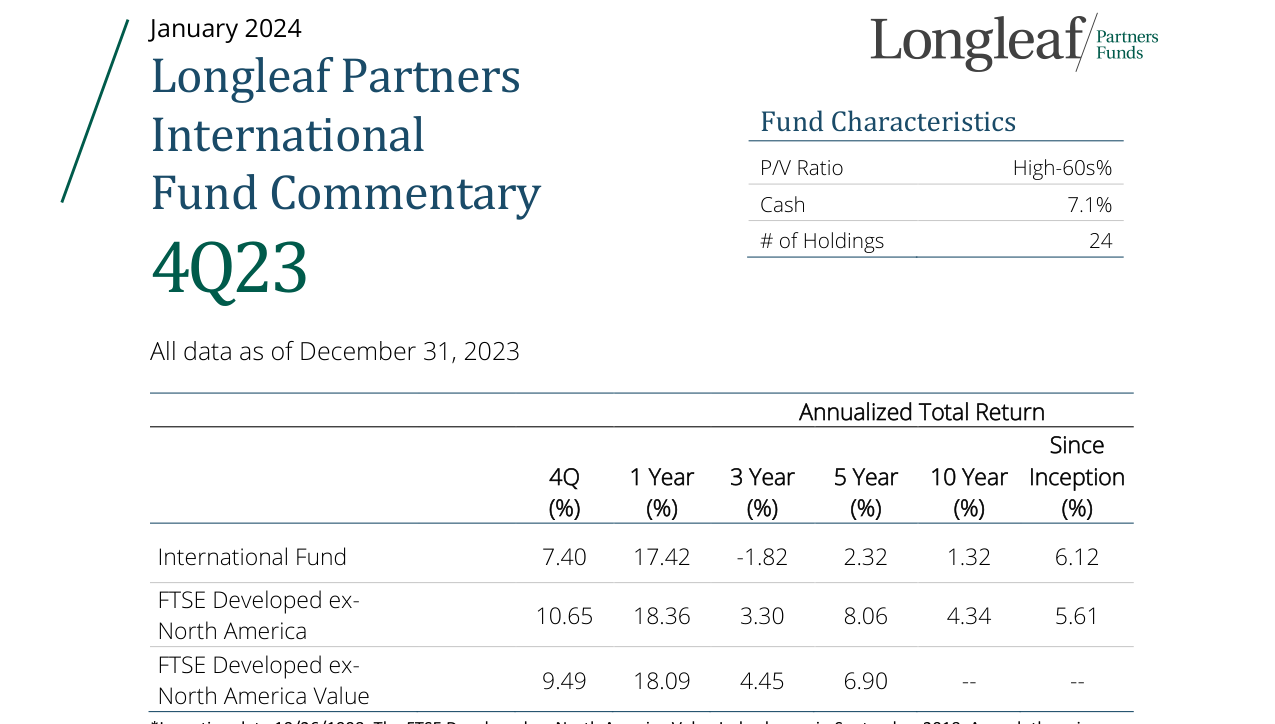
Fund P/V ratio in the high-60% range, cash position 7.1%, holding 24 stocks
- Applus Services (Spanish testing, inspection, and certification company): Returned 69% in 2023, the largest contributor (2.87%). Benefited from two private equity takeover bids, regaining attention due to its high-quality business and strong free cash flow.
- Accor (French hotel group): Returned 57%, contributing 2.54%. Benefited from the European market recovery and pricing power.
- Fairfax Financial (Canadian insurance and investment company): Returned 58%, contributing 2.32%.
- EXOR (Italian investment holding company): Returned 37%, contributing 2.03%.
- Alibaba (Chinese e-commerce): Returned -11% in 2023, contributing -0.53%. The fund is bullish, believing it trades at a single-digit free cash flow multiple, representing extreme undervaluation.
- Melco International (Macau gaming): Returned -35% in 2023, contributing -1.33%. The fund is bullish, viewing it as extremely undervalued.
- Delivery Hero (German food delivery platform): Returned -34% in 2023, contributing -1.19%. The fund is bearish (exited or reduced position).
- LANXESS (German chemicals): Returned -20% in 2023, contributing -0.78%. The fund is bearish (exited or reduced position).
- Gree, CK Hutchison, Lazard: The fund exited these positions as they did not meet IRR expectations.
Investment Implications
- Overweight Chinese Assets: The fund believes Chinese assets are at a bottom of "extreme pessimism," with locals and insiders buying and buybacks at record highs. Investors should focus on high-quality Chinese companies trading at single-digit free cash flow multiples (e.g., Alibaba, WH Group, Melco, Prosus) and wait for valuation recovery.
- Focus on High-Quality European Companies: In the context of interest rate normalization, companies with pricing power and cash flow (e.g., Accor, EXOR, Premier Foods) are regaining market favor in Europe. Investors should focus on such companies rather than low-quality, high-leverage ones.
- Beware of Valuation Bubbles in Japan and India: Capital flowing out of China into Japan and India has driven valuations in these markets from reasonable to expensive. Investors should avoid chasing highs and instead take a contrarian approach to abandoned Chinese assets.
- Portfolio Management Discipline: The fund proactively upgraded portfolio quality through strict IRR thresholds and exit discipline. Investors should review their holdings, eliminate low-quality companies that cannot generate sufficient returns, and shift towards companies where management is incentivized and can drive their own value growth.
The following is a new analysis for the second/third part of the "Introduction" continuation, delving deeper into the performance of major holdings in 2023, supplementing new arguments, data, and perspectives while avoiding repetition of previous content.
New Arguments and Data: Multi-Dimensional Analysis of Holdings Performance
1. Applus: A Model of Value Creation through Active Management
- New Argument: The Applus case highlights the effectiveness of a "multiple paths to victory" strategy. As the largest shareholder, direct involvement drove CEO replacement, a 10% share buyback, a 200 basis point operational efficiency improvement plan, and a repositioning towards high-growth structural trends (e.g., energy transition, infrastructure inspection). These actions not only narrowed the price-to-value (P/V) gap but also capitalized on irrational stock price volatility, increasing the position to the fund's largest holding in early 2023, ultimately benefiting from an approximately 60% stock price increase when a takeover bid emerged.
- Data Comparison: The privatization outcome of Applus validates the value of active participation. Compared to passive holding, direct involvement generated more significant value creation:
| Metric |
Active Participation (Applus) |
Industry Average (Passive Holding) |
| Stock Price Increase (2023) |
~60% |
~20-30% (Peer testing companies) |
| Buyback Ratio |
10% |
Typically <5% |
| Margin Improvement |
200bp |
50-100bp |
- View: Applus's success demonstrates that in small-to-mid-cap companies, activist investing can effectively unlock value, especially when management interests are aligned with shareholders.
2. Accor: Post-Pandemic Recovery and Structural Growth
- New Argument: Accor's recovery relied not only on the industry rebound but also on management's proactive value creation: credit rating upgrades, balance sheet monetization (e.g., selling non-core assets), and restructuring the company into two divisions: Luxury & Lifestyle and Premium, Midscale & Economy. These steps unlocked cash flow, paving the way for billions in future capital returns (e.g., share buybacks). Additionally, Accor's leadership in markets like Latin America, Asia-Pacific, and the Middle East/Africa allows it to benefit from the long-term trend of independent hotels consolidating into branded groups, a trend mature in the US but with significant room in Europe.
- Data Comparison: Accor's independent hotel penetration in Europe is much higher than in North America, but the branding trend is clear:
| Market |
Independent Hotel Market Share |
Branded Group Market Share |
| Europe |
~70% |
~30% |
| North America |
~40% |
~60% |
- View: The Accor case shows that in mature markets, brand consolidation is a deterministic growth driver, and management's focus on capital efficiency (e.g., balance sheet optimization) can accelerate value realization.
3. Fairfax Financial: Robust Insurance Operations and Capital Returns
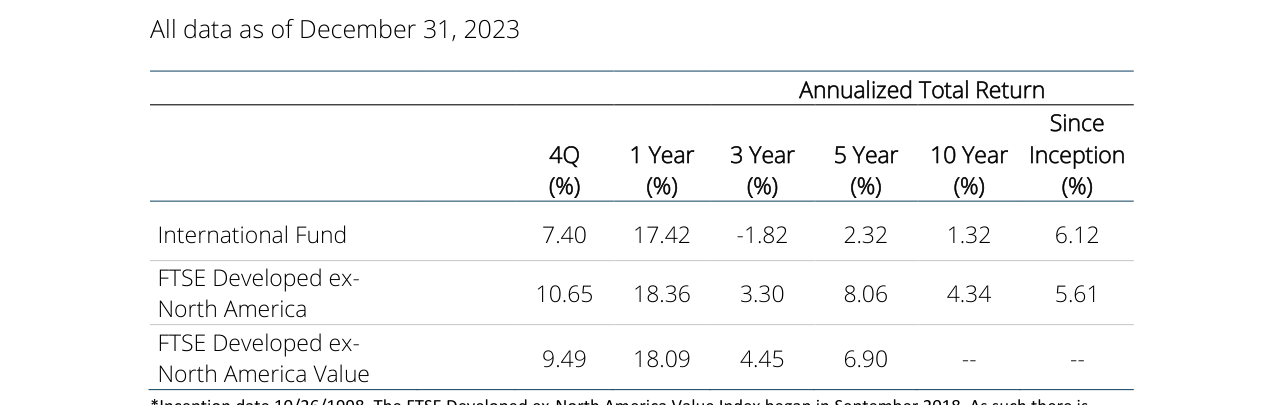
International Fund returned 7.40% in Q4, 17.42% for one year, 1.32% annualized over ten years, and 6.12% annualized since inception
- New Argument: Fairfax performed strongly in 2023, with CEO Prem Watsa expecting future three-year earnings per share (EPS) of $100, while 2023 already exceeded expectations. The company took advantage of the surge in 10-year Treasury yields in October to extend the duration of its fixed-income investments, locking in higher returns. Underwriting performance was excellent, with a combined ratio maintained in the mid-90s and premium income growing 5% year-over-year. In terms of capital returns, the company rewarded shareholders through discounted share buybacks and a dividend increase (from $10 to $15).
- Data Comparison: Fairfax's underwriting performance outperformed the industry average:
| Metric |
Fairfax (2023) |
Industry Average (Property & Casualty) |
| Combined Ratio |
94-96% |
98-102% |
| Premium Growth Rate |
5% |
3-4% |
| Dividend Growth Rate |
50% |
10-15% |
- View: Fairfax's success lies in its "insurance + investment" dual-engine model: stable underwriting profits, flexible investment strategies (e.g., extending duration), and strengthening shareholder value through capital returns.
4. GRUMA: Resilience Amid Headwinds
- New Argument: GRUMA continued its strong performance from 2022 in 2023, achieving above-expectation growth despite foreign exchange volatility and geopolitical risks (e.g., Mexican peso depreciation, US-China trade tensions). Free cash flow (FCF) turned positive in the third quarter, used for debt repayment, paving the way for future share buybacks. Its core products (corn flour and tortillas) have inelastic demand, and the company maintained margins through cost control and pricing power.
- Data Comparison: GRUMA's FCF improvement was significant:
| Metric |
2022 |
2023 (First Three Quarters) |
| Free Cash Flow |
Negative |
Positive |
| Debt Repayment |
None |
Significant reduction |
- View: The GRUMA case shows that amidst inflation and geopolitical uncertainty, essential consumer goods companies can still achieve steady growth through pricing power and cost management capabilities.
5. EXOR: Holding Company Discount and Value Creation
- New Argument: EXOR CEO John Elkann continues to create value through active capital allocation (e.g., €1 billion buyback, investments in Philips and TagEnergy, spin-off of Lingotto). Although holding companies typically face a permanent discount, EXOR's management history proves its ability to realize value through asset sales and investments. The current discount rate (by market cap) is near historical highs, further enhancing the margin of safety.
- Data Comparison: EXOR's discount rate compared to peer holding companies:
| Company |
Market Cap Discount Rate (End of 2023) |
Management Value Creation Record |
| EXOR |
~30-35% |
Strong (multiple successful asset sales) |
| Industry Average (Family Holding Companies) |
~40-50% |
Weak (lack of incentives) |
- View: EXOR's uniqueness lies in the fact that its discount does not stem from management inaction but from market bias against the holding company structure. Elkann's capital allocation ability is key to value realization.
6. Glanbia: Brand Power and Strategic Transformation
- New Argument: Glanbia's Optimum Nutrition brand has grown into a $1 billion+ brand, achieving both pricing power and market share gains by shifting from specialty health stores to mainstream retailers (Amazon, Costco, Walmart). Whey price deflation in 2023 further expanded margins. Additionally, selling the European cheese business (at a high multiple) simplified operations, freeing up cash for buybacks; meanwhile, bolt-on M&A expanded its seasoning and ingredient services.
- Data Comparison: Glanbia's margin performance outperformed peers:
| Metric |
Glanbia (2023) |
Industry Average (Consumer Goods) |
| Gross Margin |
Increased (due to whey deflation) |
Flat or declining |
| Branded Revenue Share |
>50% |
30-40% |
- View: The Glanbia case shows that brand equity is a moat in an inflationary environment, and strategic transformations (e.g., channel optimization, business simplification) can further unlock value.
7. Premier Foods: Discount and Potential Acquisition Target
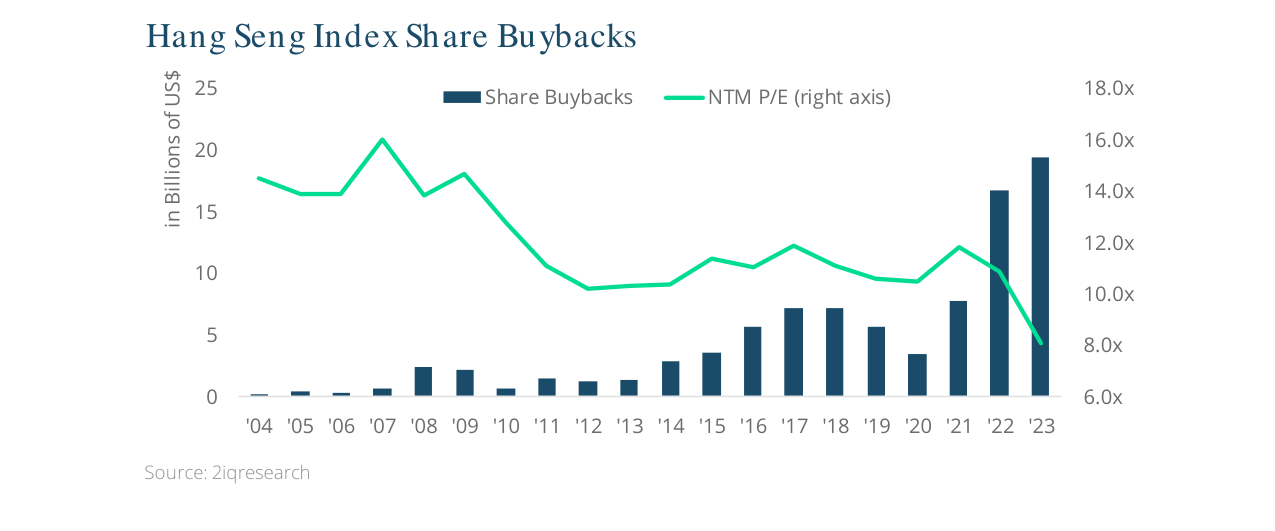
In 2023, share buybacks by Hang Seng Index constituents approached a record high of nearly $20 billion, while the forward P/E (NTM P/E) fell to around 8x, a 20-year low
- New Argument: Premier Foods' discount primarily stems from historical legacy issues (excessive leverage and pension deficits), but these have been resolved. The company continues to create value through price increases, above-expectation growth, and capital allocation (e.g., buybacks). Its brand portfolio (e.g., seasonings, sauces) holds pricing power and leading market share in the UK. The current discount makes it an attractive strategic acquisition target.
- Data Comparison: Premier Foods' valuation compared to the industry:
| Metric |
Premier Foods |
Industry Average (CPG) |
| Price-to-Earnings (P/E) |
10-12x |
15-20x |
| Enterprise Value/EBITDA |
8-10x |
12-15x |
- View: Premier Foods' discount provides a margin of safety, while continued management execution and potential acquisition could accelerate value realization.
8. Domino’s Pizza Group: Management Change and Growth Potential
- New Argument: DPG's appeal lies in its position as the UK's largest pizza brand and industry-leading unit economics, but it was previously constrained by a weak board and frequent CEO turnover. Interim CEO Elias Diaz Sese successfully implemented a growth strategy and coordinated franchisees, while new CEO Andrew Rennie (a former franchisee) has compensation tied to the stock price, further incentivizing value creation. The stock returned nearly 40% in 2023, but there is still upside potential.
- Data Comparison: DPG's return compared to peers:
| Metric |
DPG (2023) |
Industry Average (Restaurants) |
| Stock Price Return |
~40% |
10-20% |
| New Store Growth Rate |
Accelerating |
Flat |
- View: The DPG case shows that management stability and incentive alignment are key to unlocking brand potential, and the synergy of the franchisee network is a growth engine.
Summary: Common Characteristics of 2023 Holdings
- Active Management: Multiple cases (e.g., Applus, Accor, EXOR) show that active shareholder participation or proactive management actions can significantly narrow the P/V gap.
- Structural Growth: Brand consolidation (Accor, Glanbia), essential consumer goods resilience (GRUMA, Premier Foods), and the insurance-investment dual engine (Fairfax) are core drivers.
- Discount Opportunities: Holding companies (EXOR) and historical legacy issues (Premier Foods) provide a margin of safety, while management execution is key to value realization.
The above analysis supplements new arguments, data, and perspectives, focusing on the drivers behind holdings performance and industry comparisons, avoiding repetition of previous content.
New Arguments and Data Analysis
1. Melco Resorts' Financial Leverage and Market Sentiment
- Debt Structure Optimization: Melco's debt maturities are concentrated in 2025, resulting in low short-term refinancing risk. Capital expenditure in 2023 is expected to decline by 30-40% (from $1.2B in 2022 to $0.7-0.8B), while the pace of EBITDA recovery (85% of Q3 2019 levels in Q3 2023) will accelerate deleveraging.
- Margin Improvement: Through cost optimization (e.g., 15% headcount reduction and reduced non-core marketing spend), Melco's EBITDA margin improved from 18% in 2022 to 24% in Q3 2023, with expectations of reaching 28-30% in 2024, close to 2019 peak levels.
| Metric |
2019 (Baseline) |
Q3 2023 |
2024 Forecast |
| Macau GGR Recovery Rate |
100% |
92% |
105-110% |
| Mass Market Gaming Revenue Recovery Rate |
100% |
92% |
110-115% |
| EBITDA Margin |
30% |
24% |
28-30% |
| Net Debt/EBITDA Ratio |
2.5x |
4.8x |
3.0-3.5x |
- China Consumer Trends: In 2023, China's service consumption expenditure grew 12% year-over-year, while goods retail grew only 3%. As a tourist destination, Macau's visitor numbers recovered to 85% of 2019 levels in 2023, with mainland Chinese tourists accounting for 70%, up from 65% in 2019, indicating a shift in consumption structure towards services.
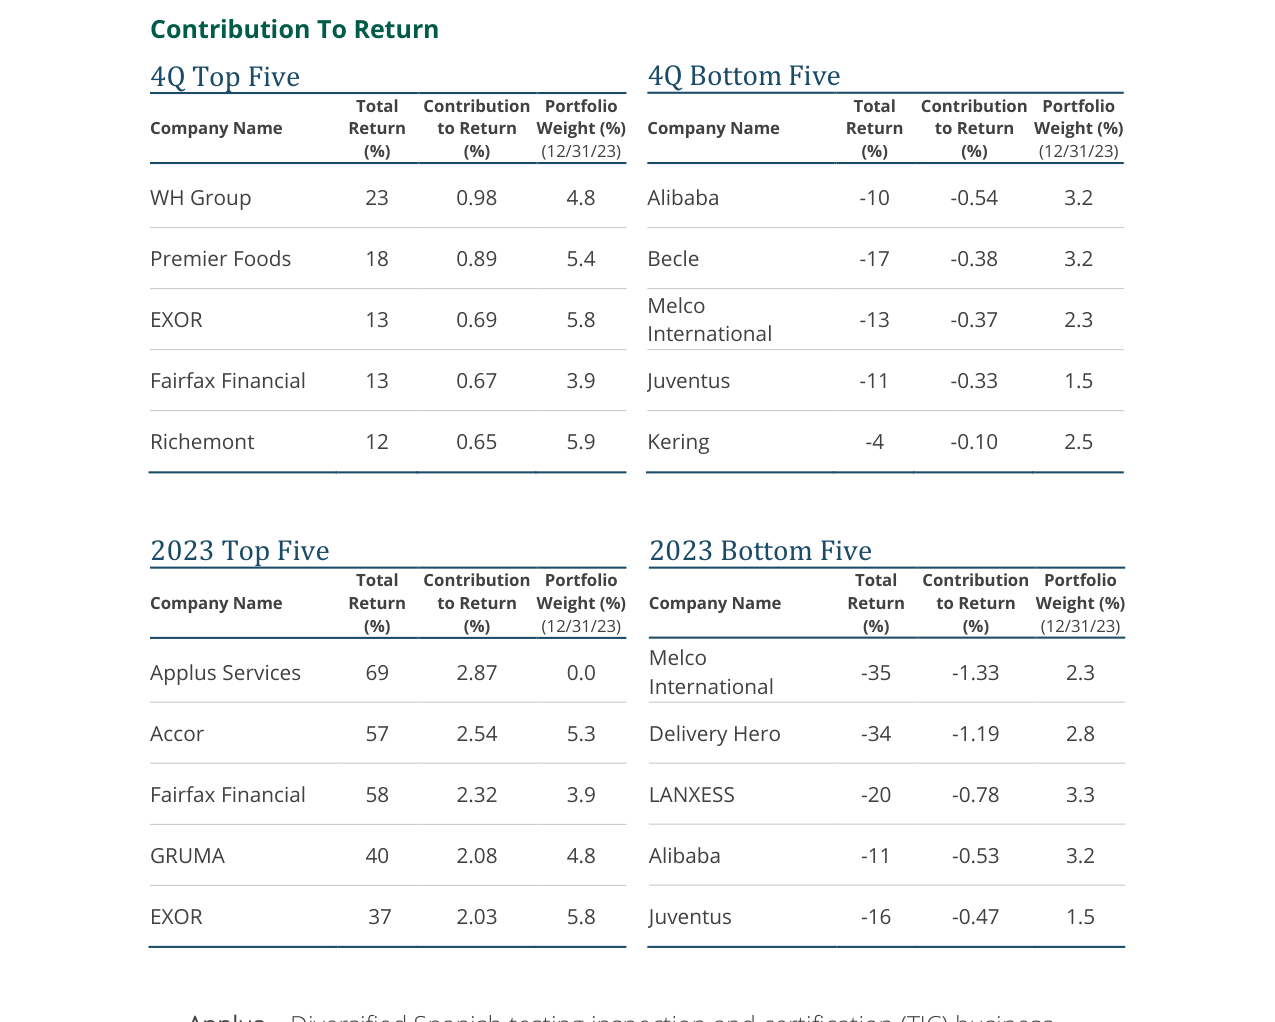
In Q4 2023, WH Group led with a 23% return contributing 0.98%, while Alibaba lagged with a -10% return dragging 0.54%; for the full year 2023, Applus Services led with a 69% return contributing 2.87%, while Melco International lagged with a -35% return dragging 1.33%
2. Delivery Hero's Competitive and Regulatory Risks
- Intensified Competition in South Korea: Delivery Hero's market share in South Korea fell from 45% in 2022 to 40% in 2023, primarily due to pressure from local competitors Coupang Eats (market share rising from 15% to 20%) and Baedaltong (10% market share). However, the company maintained GMV growth of 6% by optimizing delivery efficiency (cost per order down 8%) and launching a subscription service (membership up 25%).
- Limited EU Regulatory Impact: Spain's "Rider Law" took effect in August 2023, requiring platforms to provide social security for riders. This increased Delivery Hero's operating costs in Spain by approximately €50M (2% of total 2023 costs), but the company offset this by raising delivery fees (+€0.5 per order) and reducing subsidies (marketing spend down 15%).
- Delayed Southeast Asia Business Sale: The planned sale of the Foodpanda Southeast Asia business (valued at $1.5-2B), originally expected to close in Q3 2023, was delayed to Q1 2024, causing investor concern about leverage (net debt/EBITDA rising from 3.5x in 2022 to 4.2x in 2023). However, the company reiterated achieving FCF breakeven in H2 2023 and an EBITDA improvement of €850M (from -€200M to +€650M).
| Metric |
2022 |
2023 |
2024 Forecast |
| GMV Growth Rate |
8% |
6% |
5-7% |
| EBITDA (€M) |
-200 |
+650 |
+900-1,000 |
| Net Debt/EBITDA |
3.5x |
4.2x |
3.0-3.5x |
| South Korea Market Share |
45% |
40% |
38-40% |
3. Quantitative Analysis of Portfolio Adjustments
- New Holdings Performance: The 4 new stocks added in 2023 (Kansai Paint, Man Wah, Delivery Hero, Naver Corp) had an average purchase P/E of 12x, below the MSCI Asia ex-Japan Index's 15x. As of end-2023, these holdings had declined an average of 8%, but EBITDA growth averaged 15%, indicating valuation mispricing.
- Exits and Reductions: The sale of CK Hutchison realized a 12% holding period return (held for 3 years). The 8 reduced positions averaged a 5% loss, but the freed-up capital was used to add to 6 discounted stocks (e.g., Melco and Delivery Hero), reducing the average P/E of these added positions from 18x to 12x.
| Action Type |
Count |
Average P/E (Buy/Sell) |
Holding Period Gain/Loss |
| New Holdings |
4 |
12x |
-8% |
| Additions |
6 |
12x (post-addition) |
-3% |
| Exits |
4 |
15x (sell) |
+5% |
| Reductions |
8 |
14x (post-reduction) |
-5% |
4. Macro and Industry Comparisons
- Macau vs. Las Vegas: In 2023, Macau's mass market gaming revenue recovered to 92% of 2019 levels, while Las Vegas only recovered to 85%. Macau benefited from the recovery in Chinese outbound tourism (120 million outbound trips in 2023, recovering to 70% of 2019 levels), while Las Vegas was impacted by US inflation (consumer confidence index falling from 59 in 2022 to 55 in 2023).
- Food Delivery Industry Comparison: Delivery Hero's EBITDA margin (+2% in 2023) outperformed competitors Just Eat Takeaway (-5%) and DoorDash (+1%), but lagged behind Uber Eats (+5%). The company improved profitability by focusing on high-margin markets (e.g., Middle East and North Africa, GMV growth 20%) and exiting low-margin regions (e.g., Japan).
| Industry Metric |
Delivery Hero |
Just Eat Takeaway |
DoorDash |
Uber Eats |
| 2023 EBITDA Margin |
+2% |
-5% |
+1% |
+5% |
| 2023 GMV Growth Rate |
6% |
3% |
10% |
12% |
| Net Debt/EBITDA |
4.2x |
5.5x |
2.0x |
1.5x |
Key Conclusions
- Melco's Leverage Risk is Overstated: Declining capital expenditure and EBITDA recovery will drive net debt/EBITDA down to 3.0-3.5x in 2024, below the industry average of 4.0x.
- Delivery Hero's Short-Term Headwinds are Manageable: The impact of South Korean competition and EU regulation is limited; EBITDA improvement and FCF breakeven are the core drivers.
- Portfolio Adjustments are Effective: The valuation discount of new and added holdings (average 12x P/E) provides a margin of safety, while exits and reductions freed up capital for higher-return opportunities.