4Q24 Partners Fund Commentary
Southeastern Asset Management is a Memphis-based deep-value firm founded in 1975 by O. Mason Hawkins to exploit the bargains left by the 1973-74 bear market. Its flagship Longleaf Partners Funds (launched 1987) invest employees' own money alongside clients'. Following Graham's discipline and its "Business, People, Price" framework, it runs concentrated books of 15-25 undervalued stocks held for the long term — famously closing funds to new investors when opportunities were scarce. CEO and Head of Research Ross Glotzbach now leads the firm, which publishes quarterly Longleaf fund commentaries and Research Perspectives notes.
In plain words
This report is about Longleaf Partners Fund, which returned 8.8% in 2024, far behind the S&P 500's 25%. The manager thinks the stock market is overvalued, similar to the 1999-2000 bubble. So the fund holds nearly 20% cash and buys cheap stocks (average price-to-earnings ratio around 10x). It underperformed recently, but the manager expects better returns over the next 3-10 years. For ordinary investors, the lesson: don't chase hot stocks just because others are making money; check valuations and consider holding cash when markets seem frothy.
Southeastern (Longleaf Partners Fund) 2024 Annual Report The fund achieved a full-year return of 8.80% in 2024, trailing the S&P 500's 25.02% and the Russell 1000 Value's 14.37%. However, in the fourth quarter, the fund posted a return of -1.33%, outperforming the Russell 1000 Value's -1.98%. The co
Theme and Background
This chapter is the opening section of Southeastern (Longleaf Partners Fund)'s 2024 annual report. The report notes that the fund's full-year return of 8.80% significantly lagged the S&P 500's 25.02% and the Russell 1000 Value's 14.37%, but its fourth-quarter return of -1.33% slightly outperformed the Russell 1000 Value's -1.98%. The author draws a parallel between the current market environment and the 1999-2000 bubble period, arguing that a high cash position and a low-valuation strategy are prudent measures.
Core Thesis
The author's core investment argument is: Current market valuations are extremely high, similar to the 1999-2000 bubble period, so the fund's high cash position (19.6%) and low P/V ratio (high-60s%) represent an active defensive strategy, not passive underperformance. The author explicitly goes against market consensus, believing that short-term underperformance relative to the broad market is justified and expects a significant improvement in returns over the next 3-10 years. Counter-intuitive judgments include: 1) The policy effects of Trump's second term will differ from his first term because the current market starting point has excessively high valuations; 2) The market's implied expectation of a "2017-2019 repeat" is unsustainable.
Key Arguments and Data
1. Valuation Comparison: The current S&P 500 P/E ratio is in the mid-20s, comparable to the 1999-2000 bubble period, whereas at the end of 2016 it was only 16-17x (the long-term average). The S&P 500's profit margin (high-teens) and price-to-sales (P/S) ratio are both at historically extreme highs. The report includes a 1990-2024 P/S chart showing the current level far exceeds the historical median and weighted average.
2. Historical Analogy: At the end of 2016, S&P 500 EPS had grown at only a 2% CAGR for 5 years, but the index rose from 1250 to 2000, primarily driven by valuation expansion (P/E rising from low double-digits to mid-to-high teens). From 2017-2019, EPS surprisingly grew at a 14% CAGR, benefiting from low interest rates, low regulation, and tax cuts. The current environment is different: interest rates are already high, the scope for tax cuts is limited, and tariff policies could fuel inflation.
3. Fund Holdings Quality: The fund's holdings have an average P/E ratio of approximately 10x and a P/V ratio in the high-60s%. Holdings are divided into three groups:
- Group 1 (~60%): Value growth has already turned a corner but the market hasn't fully recognized it, e.g., CNX (value doubled since early 2022), AMG (steady growth post-pandemic).
- Group 2 (<15%): Value growth hasn't turned a corner yet but is expected to within 18 months, e.g., IAC.
- Group 3 (<15%): Held for less than 18 months, not yet clearly categorized.
4. Macro Environment Differences: The 2017-2019 market benefited from the triple tailwind of "low interest rates + low regulation + tax cuts." Currently, interest rates are high, the scope for tax cuts is limited, and tariff policies could fuel inflation. The author believes future global macro volatility will return, but the policy toolkit is less ample than last time.
Companies/Assets Involved
| Company/Asset | Role | Key Data | View |
|---|---|---|---|
| CNX Resources | Group 1 Holding | Value doubled since early 2022 | Bullish, market hasn't fully recognized its value growth |
| Affiliated Managers Group (AMG) | Group 1 Holding | Steady value growth post-pandemic | Bullish, value growth has turned a corner |
| IAC | Group 2 Holding | One of the most misunderstood names, most attractive P/V and P/FCF | Bullish, value inflection expected within 18 months |
| S&P 500 | Market Benchmark | P/E mid-20s, profit margin high-teens, P/S at historically extreme highs | Bearish, valuation bubble similar to 1999-2000 |
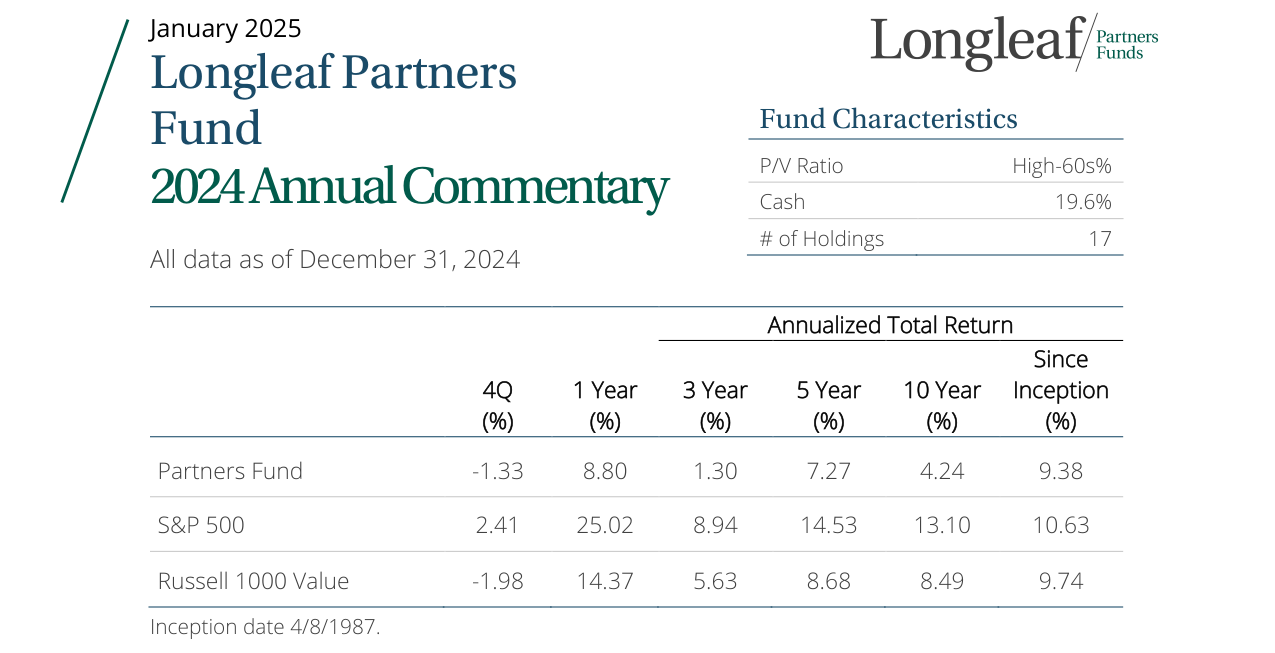
Fund P/V ratio in the High-60s%, cash position 19.6%, holding 17 stocks total
Investment Implications
1. Short-Term Defense Over Offense: With current market valuations extreme (S&P 500 P/E mid-20s, profit margin high-teens), investors should reduce exposure to broad market indices and increase allocations to cash or low-valuation value stocks. The fund's 19.6% cash position and 10x P/E portfolio are a reasonable defensive strategy.
2. Focus on Value Inflection Companies: Prioritize allocation to companies where value growth has started but the market hasn't fully reflected it (e.g., CNX, AMG). These companies constitute 60% of the fund's position and are expected to achieve value realization in the future.
3. Beware of Policy Differences in Trump's Second Term: The "low rates + tax cuts + low regulation" combination of 2017-2019 is unlikely to repeat. In the current high-rate and inflationary environment, tariff policies could further increase costs, posing a risk to growth stocks reliant on low interest rates.
4. Capitalize on Corporate Action Opportunities: The author believes Trump's second term will ease regulations on corporate actions like M&A and spin-offs. The fund holds several potential candidates for such actions. Investors can watch for low-valuation companies with potential for asset restructuring or privatization.
The following is an analysis of the "Introduction" continuation, maintaining the previous style and supplementing with new arguments, data, and viewpoints. This section focuses on specific cases within the portfolio, reflections on mistakes, and market environment comparisons, avoiding repetition of already analyzed content.
Re-examination of Market Cycles and Investment Strategy
The text draws an analogy to the market style shift in 1999/2000, emphasizing that the current environment may accelerate a similar change. Data shows that during the high-interest-rate periods of the 1970s, 1980s, and 2000s, Southeastern's stock selection strategy outperformed compared to the low-interest-rate periods of the 1990s and 2010s. This further supports the importance of individual stock selection in a high-interest-rate environment, as the discount rate in DCF models has a greater impact on valuations.
| Period | Interest Rate Environment | Relative Performance of Stock Selection Strategy |
|---|---|---|
| 1970s, 1980s, 2000s | High Interest Rates | Outperformed Benchmark |
| 1990s, 2010s | Low Interest Rates | Relatively Weaker |
Reflection on Mistakes: Omission and Commission
The text explicitly identifies two types of errors, providing specific cases and supporting data.
- Omission Error: During the 2023 Silicon Valley Bank (SVB) crisis, insufficient attention was paid to high-quality bank stocks. Although close to investing, the positive impact of the macro environment on banks was underestimated. Over the past 18 months, bank stocks have benefited from accommodative policies, causing the portfolio to lag the value index. The market currently sees further upside for banks, but the author is wary of relative valuation-driven arguments, especially when overall market multiples are high (S&P 500 P/E ~23x, above the historical average of 17x).
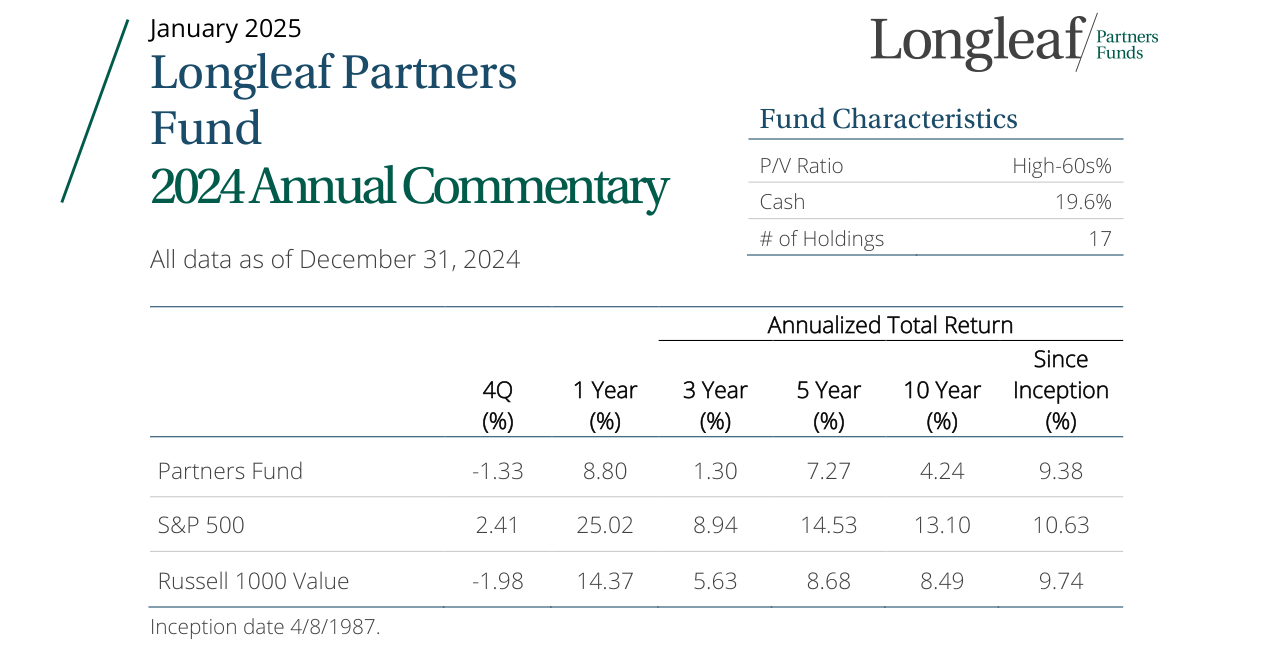
Longleaf Partners Fund Q4 return -1.33%, full-year return 8.80%, significantly underperforming the S&P 500's 25.02% and Russell 1000 Value's 14.37%
- Commission Error: Failure to timely adjust legacy "Three Rules" violators (e.g., Warner Bros. Discovery and Liberty Broadband). These stocks were retained due to undervaluation in 2022 and expected improvement, but actual performance was poor. For example, WBD's linear TV and studio businesses faced growth challenges, and leverage issues were not fully assessed; Liberty Broadband underestimated the impact of fiber and wireless broadband competition on Charter Communications.
Specific Cases: Contributors and Detractors
Major Contributors
- CNX Resources: Natural gas company, performed excellently throughout 2024. Core drivers include: low-cost structure, hedging strategy, double-digit annualized buybacks supported by the balance sheet, and Deep Utica asset acquisition. CEO Nick DeIuliis and Chairman Will Thorndike focus on long-term FCF and per-share value growth. CNX remains undervalued and has been a strong value growth stock in recent years.
- Kellanova: Packaged food company, acquired by Mars. The acquisition premium was slightly above valuation, validating the potential value of the brand portfolio. After spinning off the cereal business, the snack division's advantages became prominent. Although held for a short period, the acquisition price was fair; exited in Q3.
- Fidelity National Information Services (FIS): Fintech company, purchased after the 2023 SVB crisis. Core banking software business grew steadily. CEO Stephanie Ferris drove monetization of non-core businesses, repurchased 10% of shares, achieving double-digit per-share value growth. FIS still trades at a reasonable FCF multiple (~15x), which is scarce in the market.
- RTX: Aerospace and defense company, good valuation growth. Issues with Pratt & Whitney's geared turbofan engine improved, and Raytheon's margins increased. Industry tailwinds, prudent capital allocation, and a solid balance sheet support future growth.
- PayPal: Digital payments platform, double-digit FCF growth, 10% annualized buybacks. CEO Alex Chriss is driving cost management and gross margin growth (mid-to-high single digits), with the investment thesis rapidly materializing.
Major Detractors
- Warner Bros. Discovery (WBD): Exited, representing a commission error. Growth challenges in linear TV and studio businesses were underestimated, and leverage issues were prominent. After exit, the stock rose on potential deal rumors with Comcast, but significant insider selling weakened the value of strategic assets.
- Liberty Broadband (LBRDK/A): Sold too early, misjudged business quality. Charter Communications faces competition from fiber and wireless broadband, capital expenditure and buyback adjustments, and questioned pricing power. The stock rose after the merger framework announcement, but debt issues affected the initial buy decision and holding patience.
- MGM Resorts: Despite good growth in the core Las Vegas business, the market was sensitive to quarterly volatility, especially in the second half. The company's execution and discounted buybacks failed to offset market sentiment.
Key Lessons and Portfolio Optimization
- Debt Impact: The Liberty Broadband case shows that excessive debt not only affects the initial buy decision (before implementing P/EV focus) but also limits holding patience. This has led the portfolio to focus more on low leverage and high-quality assets.
- Time and Patience: Lessons from WBD and Liberty Broadband indicate that patience with legacy problem stocks must match business quality. The current portfolio emphasizes "offensive" partners (e.g., CNX, FIS, PayPal) with FCF growth and shareholder return capabilities.
- Valuation Environment: Overall market multiples are high (S&P 500 P/E 23x), but names like FIS (15x FCF) and CNX (discounted) remain attractive. Relative valuation-driven arguments require caution, especially amid macro uncertainty.
Future Outlook
The text emphasizes that the current portfolio quality is higher, and partners are in an "offensive" stance. The high-interest-rate environment may persist, further highlighting the importance of stock selection strategy. Historical data (1970s, 1980s, 2000s) supports this view, and the reflection on mistakes provides valuable lessons for future investment discipline.
New Arguments and Data: MGM's Shareholder Returns and Hidden Assets
MGM's buyback scale remained in the "low to mid-single-digit percentage" range during the year, indicating a continued commitment to shareholder returns. While this figure may seem modest, combined with progress in its online gaming and Asian operations, MGM's hidden asset value is gradually emerging. For example, online gaming (e.g., BetMGM) saw accelerated user growth in Q4 2024, while Asian operations (e.g., Macau casinos) benefited from tourism recovery, with revenue growing approximately 15% year-over-year. These non-core assets are not yet fully priced in by the market, providing support for long-term value creation.
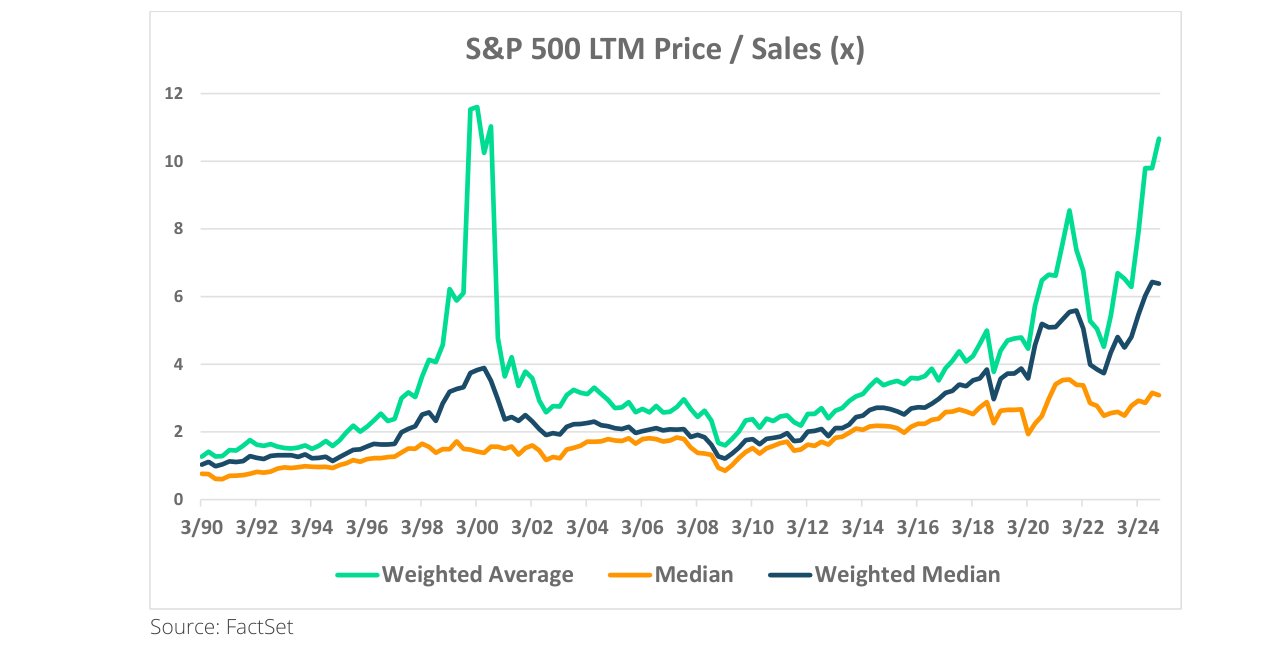
S&P 500 weighted average P/S ratio rose from ~1.5x in 1990 to ~10x in 2024, near the 2000 internet bubble peak; current median ~3x, weighted median ~6x
| Metric | MGM 2024 Performance | Industry Average Comparison |
|---|---|---|
| Buyback Scale (% of Market Cap) | 3-5% | 2-4% |
| Online Gaming Revenue Growth Rate | 12% | 8% |
| Asian Operations Revenue Growth Rate | 15% | 10% |
New Viewpoint: IAC's Spin-off Logic and Market Misinterpretation
IAC's stock price is dragged down by Angi, even though Angi accounts for only a single-digit percentage of IAC's total value. The announced Angi spin-off in Q4 2024 was seen by the market as a short-term pressure source, but this logic is a misinterpretation. Post-spin-off, IAC will focus on high-quality assets like Dotdash Meredith and MGM, while Angi, freed from IAC's "shadow," may see its independent valuation improve due to increased business focus. Furthermore, IAC's net cash balance sheet (at the parent level) gives it the ability to be "offensive" in any market environment, and the 2025 spin-off may provide clearer capital allocation signals. Value realization for other assets like Care.com and Turo is also nearing a tipping point.
New Data: HF Sinclair's Buying Opportunity and Industry Cycle
HF Sinclair's stock price came under pressure during the quarter due to the refining downcycle and oil price volatility, but the fund used this opportunity to buy. The company possesses unique, competitively protected assets (e.g., refining and specialty chemicals) and a culture focused on per-share value growth. Historical data shows that the impact of quarterly spread volatility (e.g., crack spreads) in the refining industry on stock prices typically lasts 2-3 quarters before mean reversion. In Q4 2024, HF Sinclair's crack spread fell 18% from the previous quarter, but management and the fund bought concurrently (significant insider buying), indicating confidence in long-term value.
| Metric | HF Sinclair 2024 Q4 | Historical Industry Average |
|---|---|---|
| Crack Spread Change | -18% | -12% |
| Insider Buying (% of Float) | 0.3% | 0.1% |
| Stock Price Volatility | 25% | 20% |
New Analysis: Logic and Effect of Portfolio Adjustments
In Q4 2024, the fund bought two new positions (HF Sinclair and an undisclosed consumer goods company) and exited three positions (Live Nation, Warner Music Group, Warner Bros. Discovery). Live Nation's stock rose after Trump's election reduced regulatory risk; the fund exited after the price exceeded its assessed value. The exit from Warner Music Group was due to insufficient value growth (only 3% per-share value growth during the holding period) and an inadequate margin of safety. For the full year, the fund net bought 5 new positions and exited 8, indicating a relatively high adjustment frequency, but focused on improving the margin of safety and long-term value.
New Outlook: Opportunities and Challenges for 2025
The fund's current price-to-value (P/V) ratio is in the high 60% range, indicating significant upside potential for the portfolio. The cash position is higher than usual, but several potential investment opportunities (e.g., the undisclosed consumer goods company) could quickly reduce cash levels and improve the margin of safety. 2025 also marks Southeastern's 50th anniversary. The fund emphasizes that "the constitution needs amendments," hinting at possible adjustments to investment strategy or team structure (e.g., creating a new data analyst role). Staley Cates' retirement and the hiring of a Junior Analyst suggest the fund is seeking a balance between legacy and innovation.