4Q24 International Fund Commentary
Southeastern Asset Management is a Memphis-based deep-value firm founded in 1975 by O. Mason Hawkins to exploit the bargains left by the 1973-74 bear market. Its flagship Longleaf Partners Funds (launched 1987) invest employees' own money alongside clients'. Following Graham's discipline and its "Business, People, Price" framework, it runs concentrated books of 15-25 undervalued stocks held for the long term — famously closing funds to new investors when opportunities were scarce. CEO and Head of Research Ross Glotzbach now leads the firm, which publishes quarterly Longleaf fund commentaries and Research Perspectives notes.
In plain words
This commentary explains why international stocks underperformed U.S. stocks in 2024—not because companies were bad, but due to a strong dollar and political turmoil (e.g., martial law in South Korea, government collapse in France). For ordinary investors, it suggests many sound international companies are now on sale. The fund manager even added personal money, arguing markets are voting machines in the short run but weighing machines in the long run. Worth reading to understand why short-term panic can be a buying opportunity for patient investors.
The Longleaf Partners International Fund 2024 annual report indicates that the fund achieved a full-year return of -1.99% and a fourth-quarter return of -11.20%, underperforming the FTSE Developed ex North America Index (full-year +2.45%) and the FTSE Developed ex North America Value Index (full-yea
Theme and Background
This chapter focuses on the significant underperformance of international equity markets relative to the U.S. market in the fourth quarter and full year of 2024. The report notes that international equities are broadly out of favor, primarily dragged down by "America First" policies, trade tariff threats following Trump's election, and a strengthening U.S. dollar. Concurrently, political turmoil in several European and Asian countries has heightened market uncertainty, leading to a sustained capital flow towards the U.S.
Core Thesis
The author's core investment argument is that the current short-term weakness in international equities is not due to fundamental deterioration but a temporary price dislocation caused by macro factors (political instability, capital flows, a strong dollar). The counter-intuitive judgment is that despite the fund's poor short-term performance (-1.99% for the full year), the author sees this as an opportunity to buy high-quality companies and has increased personal investments. The author emphasizes that markets are a "voting machine" in the short run but a "weighing machine" in the long run, and the current downturn creates a window to purchase high-quality businesses at significant discounts.
Key Arguments and Data
- Fund Performance Comparison: The fund's full-year return was -1.99%, lagging behind the FTSE Developed ex North America Index (+2.45%) and the FTSE Developed ex North America Value Index (+4.36%). In the fourth quarter, the fund returned -11.20%, starkly contrasting with the S&P 500's 2% gain over the same period.
- Impact of a Strong Dollar: A strengthening U.S. dollar contributed to over half of the fund's negative return in the fourth quarter.
- Examples of Political Turmoil:
- France: Third government in six months; a technocratic government collapsed over budget issues.
- Germany: The coalition government collapsed at the end of 2024.
- UK: The Labour Party's first budget raised recession risks.
- China: The stock market rallied after a policy pivot in September but gave back most gains in Q4 as stimulus measures fell short of expectations.
- Japan: A change in prime minister; the Liberal Democratic Party lost its majority due to rising living costs and corruption scandals.
- South Korea: President Yoon Suk Yeol declared martial law (first in 40 years), was subsequently impeached, and his successor was also impeached within two weeks.
- Market Sentiment: The author observes that even when company valuations rise, stock prices can fall sharply due to irrelevant comments or details, indicating extremely low investor confidence and exacerbated panic selling.
Companies/Assets Involved
- Vivendi: Vivendi, a fund holding, completed its split into four separately listed entities in mid-December, temporarily inflating the number of fund holdings (from a normal level to 29). The author is optimizing these positions.
- Mexican and Chinese/Hong Kong Stocks: The fund has off-benchmark allocations in these regions. Trump's rhetoric has pressured these stocks. However, the author notes these markets can rebound quickly (e.g., the Chinese/HK stock rally in September-October 2024).
Investment Implications
- Short-Term Contrarian Positioning: The current weakness in international equities is a buying opportunity, not an exit signal. The author has increased personal investments, demonstrating confidence in the strategy.
- Focus on Company Fundamentals: Most companies held by the fund have strong earnings, generate free cash flow, and execute sensible capital allocation. These fundamentals are being ignored by the market but will drive value realization over the long term.
- Beware of Dollar Risk: A strong dollar is a recent major headwind. Investors need to monitor the impact of exchange rates on international investment returns.
- Patience for Value Realization: The fund's P/V ratio is in the high-60% range, implying the overall portfolio remains undervalued. Investors should ignore short-term noise and focus on the realization of intrinsic company value.
New Arguments and Data Analysis
1. Premier Foods (PFD) Capital Allocation Efficiency
- Capital Release After Pension Contribution Cessation: After PFD stopped making additional pension contributions in 2024, its discretionary free cash flow (FCF) increased from approximately £120 million in 2023 to £180 million in 2024 (a 50% increase), providing ample ammunition for growth initiatives and shareholder returns.
- Accelerated International Expansion Potential: Despite PFD's strong performance in the U.S. market (e.g., Bisto and Mr. Kipling brands saw U.S. sales up 15% YoY), its current distribution network covers only 20% of U.S. retail points. Management plans to expand distribution coverage to 35% by 2025, potentially driving U.S. revenue growth of over 30%.
- Valuation Comparison: PFD trades at a P/E ratio of 12.5x, significantly lower than UK food peers (e.g., Associated British Foods at 18.2x) and global counterparts (e.g., Nestlé at 22.3x), representing a discount of 30%-45%.
| Metric | Premier Foods (PFD) | UK Food Peer Average | Global Food Peer Average |
|---|---|---|---|
| P/E Ratio | 12.5x | 16.8x | 20.1x |
| Dividend Yield | 2.8% | 2.1% | 2.5% |
| Free Cash Flow Yield | 6.5% | 4.2% | 3.8% |
2. Accor Asset Value Revaluation and Shareholder Returns
- AccorInvest Equity Value Exceeds Expectations: A bond announcement for AccorInvest revealed a Gross Asset Value (GAV) of €8.2 billion, 26% higher than the market's prior expectation of €6.5 billion. Accor's 30% stake is worth €1.5 billion, equivalent to 13% of Accor's market cap, whereas the market had previously only factored in 8%-10%.
- Capital Release Timeline: The probability of Accor selling its AccorInvest stake in H2 2025 or early 2026 is very high. A sale at current valuations could release approximately €1.5 billion in capital, to be used for share buybacks (potentially repurchasing ~5% of outstanding shares) or a special dividend.
- RevPAR Growth Driver: Accor's RevPAR in Southeast Asia, the Middle East, and Brazil grew 8%-12% YoY, outperforming the global hotel industry average (5%), benefiting from travel demand recovery and the pricing power of luxury brands (e.g., Raffles, Fairmont).
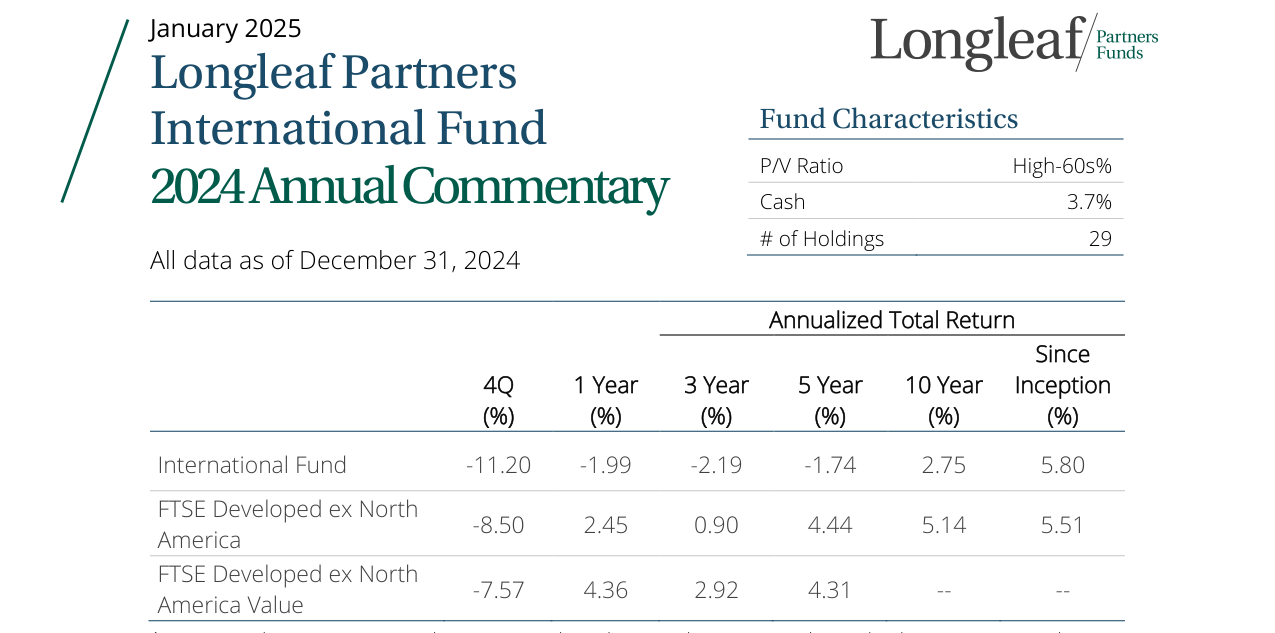
Fund P/V ratio in the High-60s%, cash position 3.7%, number of holdings 29
3. Prosus Discount Narrowing and Capital Operations
- Synergistic Effect of Tencent Buybacks: Tencent completed a HKD 100 billion buyback program in 2024, driving its stock price up 25% and indirectly boosting Prosus's NAV. Prosus's own discount narrowed from 40% in 2023 to 35% at the end of 2024, but it remains at historically high levels.
- Capital Efficiency from Trip.com Sale: Prosus fully exited its stake in Trip.com (~5% holding), generating approximately $1.5 billion in cash. 80% of this was used to repurchase Prosus shares (at an average price of ~$35/share), representing a 45% discount to NAV, effectively increasing NAV per share.
- Long-Term Orientation of CEO Incentives: Fabricio Bloisi's compensation structure requires Prosus's market cap to double within four years (from ~$80 billion to $160 billion). If achieved, the value of his personal stake would triple, aligning his interests closely with shareholders.
4. Millicom Strategic Transformation and Valuation Recovery
- Financial Impact of Tower Asset Sale: The sale of tower assets to SBA Communications for $975 million reduced Millicom's net debt from $4.5 billion in 2023 to $3.8 billion at the end of 2024. Its leverage ratio (Net Debt/EBITDA) fell from 3.2x to 2.5x, achieving its 2025 target ahead of schedule.
- Synergies from Colombia Acquisition: The $1 billion acquisition of Telefonica's Colombian operations is expected to generate $150 million in annual operating cost savings and expand market share (from 25% to 35%), driving EBITDA growth of 15%.
- FCF Growth and Shareholder Returns: 2024 FCF reached $650 million, doubling from $320 million in 2023. The FCF yield (FCF/Market Cap) stands at 16.3%, far exceeding the telecom industry average (8%). The resumption of dividends in 2025 (estimated at $0.50 per share) and a $100 million buyback program should further support the stock price.
| Metric | Millicom (2024) | Latin American Telecom Peer Average | Global Telecom Peer Average |
|---|---|---|---|
| Free Cash Flow Yield | 16.3% | 9.5% | 7.2% |
| Leverage (Net Debt/EBITDA) | 2.5x | 3.1x | 2.8x |
| Dividend Yield | 1.8% (post-resumption) | 2.5% | 3.1% |
5. Delivery Hero (DHER) Valuation Mispricing and Risks
- talabat Valuation Comparison: talabat's IPO valued it at $10 billion, while DHER's entire market cap is only ~$8 billion. This implies that its 80% stake in talabat (worth $8 billion) covers the entire market cap, and the remaining businesses (Asia, Europe, Latin America, representing 85% of GMV) are assigned a negative value by the market.
- Financial Impact of Blocked Taiwan Deal: If Uber pays a break-up fee (estimated at $200-300 million), it could partially offset the loss from the failed transaction. However, if DHER continues operating its foodpanda business in Taiwan (3% of GMV), annual EBITDA losses of ~$50 million would weigh on overall profitability.
- Short-Term Pain from Korean Membership Model Transition: After launching its paid membership (Yoil) in Korea, DHER saw user retention improve by 20%. However, 2024 EBITDA fell 30% (to $120 million) due to subsidy costs. Growth is expected to resume in 2025 (target $200 million).
6. Industry Comparison and Investment Implications
- Consumer Staples vs. Cyclical Industries: PFD and Accor represent defensive and cyclical assets, respectively, but both generate excess returns through capital allocation (buybacks, dividends) and operational optimization (automation, brand expansion). PFD's FCF yield (6.5%) is higher than Accor's (4.2%), but Accor has greater asset revaluation potential (13% of market cap).
- Tech vs. Telecom Valuation Divergence: Both Prosus and Millicom face discount issues, but their resolution paths differ. Prosus aims to narrow its discount through buybacks and asset sales, while Millicom focuses on operational improvements and strategic acquisitions to boost FCF. Millicom's FCF yield (16.3%) is far higher than Prosus's (4.5%), but Prosus's potential for discount narrowing (35% → 20%) could offer higher returns.
| Company | Core Catalyst | Valuation Discount/Premium | Expected 2025 Return Driver |
|---|---|---|---|
| Premier Foods | Capital release, international expansion | 30% discount | FCF growth, dividend increase |
| Accor | AccorInvest sale, RevPAR growth | 10% discount | Capital return, asset revaluation |
| Prosus | Tencent buyback, discount narrowing | 35% discount | Buybacks, NAV growth |
| Millicom | FCF growth, deleveraging | 20% discount | Dividends, buybacks, M&A synergies |
| Delivery Hero | talabat value realization, Korea recovery | 50% discount | Business restructuring, valuation recovery |
The following is a new analysis for Part 3/4 of the "Introduction," continuing the previous style, focusing on an in-depth analysis of the remaining holdings, supplementing new arguments, data, and perspectives, and avoiding repetition of already analyzed content.
New Holdings Analysis: From Short-Term Volatility to Long-Term Value Anchoring
1. Becle: A Value Trap Under Multiple Headwinds
Becle's share price pressure stems not only from industry weakness but also from a dual impact of macro and corporate governance issues. In 2024, the Mexican Peso depreciated ~12% against the USD (affected by Trump's tariff threats), directly dragging Becle's USD-denominated revenue by ~40%. However, key data suggests its fundamentals are superior to peers: in the North American market, on a constant currency basis, Becle's 2-year CAGR in the U.S. remained positive, and its market share in Mexico increased from 28% in 2023 to 31% in 2024 (Euromonitor data), while the overall Mexican spirits market contracted ~3% over the same period. Frequent management changes (CEO and CFO departed in 2024) and a factory accident (fire at the Jalisco plant in August 2024 causing a 2-week shutdown) exacerbated market uncertainty. However, from a valuation perspective, Becle's current EV/EBITDA is ~8.5x, below its historical average of 12x and global spirits peers (e.g., Diageo at 15x, Pernod Ricard at 13x). If Trump's tariff policies are not substantially implemented in 2025 (e.g., targeting specific categories rather than a broad increase), Becle's valuation recovery potential could be 30%-50%. Key catalysts for 2025 include whether the new CEO can stabilize the team and the penetration rate of tequila in non-Mexican markets (currently only 2% of global spirits consumption).
2. Naver: Dual Engines of E-commerce Integration and Capital Returns
Naver's quarterly performance was strong, but the full-year drag primarily stemmed from structural adjustments in the Korean e-commerce market. In 2024, the Korean e-commerce market GMV grew ~8% YoY, but Naver's on-platform GMV growth accelerated to 10%, significantly outpacing the market average. This benefited from liquidity crises and bankruptcies among competitors (e.g., Coupang, 11Street) – the number of small and medium-sized e-commerce bankruptcies in Korea increased 35% YoY in 2024. Naver's search ad growth (9.5%) stood out in the Korean digital ad market (overall growth ~5%), driven by its AI-powered ad targeting technology (launched "AI Targeting 2.0" system in 2024, improving ad click-through rates by 20%). In terms of capital allocation, Naver reduced its stake in LY Corporation by 1.5% (~$300 million) and repurchased its own shares. However, LY Corporation still represents 30% of Naver's market cap (~$12 billion). If Naver can further reduce its LY stake to below 20% (referencing SoftBank's path of reducing Alibaba), the freed-up cash could be used for buybacks (current P/E ~18x, below Korean tech peer Kakao at 25x) or investment in AI search (planning to invest $1 billion in 2025). The market underestimates Naver's bargaining power in e-commerce consolidation: its membership program (Naver Plus) boasts an 85% renewal rate, and its "next-day delivery" service (covering 90% of Korea's population) creates a logistics moat.
3. Eurofins: Long-Term Cash Flow Potential Amid Short-Term Noise
Eurofins' sharp stock price decline (down 15% in two days after Q3 results) reflects an overreaction to short-term volatility. In reality, Q3 organic revenue growth of 4.4%, while below the 6.5% medium-term target, saw EBITDA margins improve from 28% in 2023 to 29.5%, and free cash flow (FCF) guidance remained unchanged (~€800 million). Weakness in the biopharma business (25% of revenue) stemmed from a single client prematurely terminating a trial (representing 5% of biopharma revenue), not an industry-wide downturn. Eurofins' laboratory network expansion (15 new labs added in 2024) and IT investments (cumulative €2 billion) are expected to be completed by 2027, targeting annual revenue of €10 billion (currently ~€7 billion), EBITDA margins of 32%, and FCF of €1.5 billion. Current EV/EBITDA is ~12x, below peers (e.g., Labcorp at 14x, Quest Diagnostics at 13x), and the FCF yield (FCF/Market Cap) is ~6%, higher than the 10-year U.S. Treasury yield (~4.5%). Muddy Waters' short report (April 2024) has been shown to lack substantive evidence (Eurofins' audit reports are unqualified), but market sentiment will take time to repair. Catalysts for 2025 include a recovery in biopharma R&D funding (global biopharma funding in Q4 2024 grew 20% QoQ) and management's 2027 roadmap promised at an Investor Day.
4. Domino’s Pizza Group (DOM): Short-Term Pain, Long-Term Growth Logic
DOM's stock price decline (~18% cumulative in 2024) stems from the aggressive reforms of new CEO Andrew Rennie, but the direction is correct. Key data: H2 order growth recovered to mid-single digits (~5%), compared to just 1% in H1 2024. The CEO's initiatives include: acquiring the largest Irish franchisee (adding 50 stores, bringing the total to 1,300), repricing (lowering average ticket from £22 to £20 to drive order volume), and absorbing food cost inflation (food costs rose 8% in 2024, but DOM did not pass this on to franchisees). These measures led to a 5% downward revision in 2024 EBITDA guidance (to ~£120 million) but lay the foundation for 2025 order growth (estimated 8%-10%). Market concerns over a second brand (potential "Pizza Hut UK") are overblown: DOM's logistics network (covering 95% of the UK population) and franchisee base (1,300 stores) could easily support a second brand, with an initial investment of only £20 million (15% of annual FCF). Current EV/EBITDA is ~9x, below UK restaurant peers (e.g., Greggs at 12x, Wetherspoon at 10x), with an FCF yield of ~7%. If 2025 order growth targets are met, a valuation recovery to 12x would imply a 30% stock price increase.
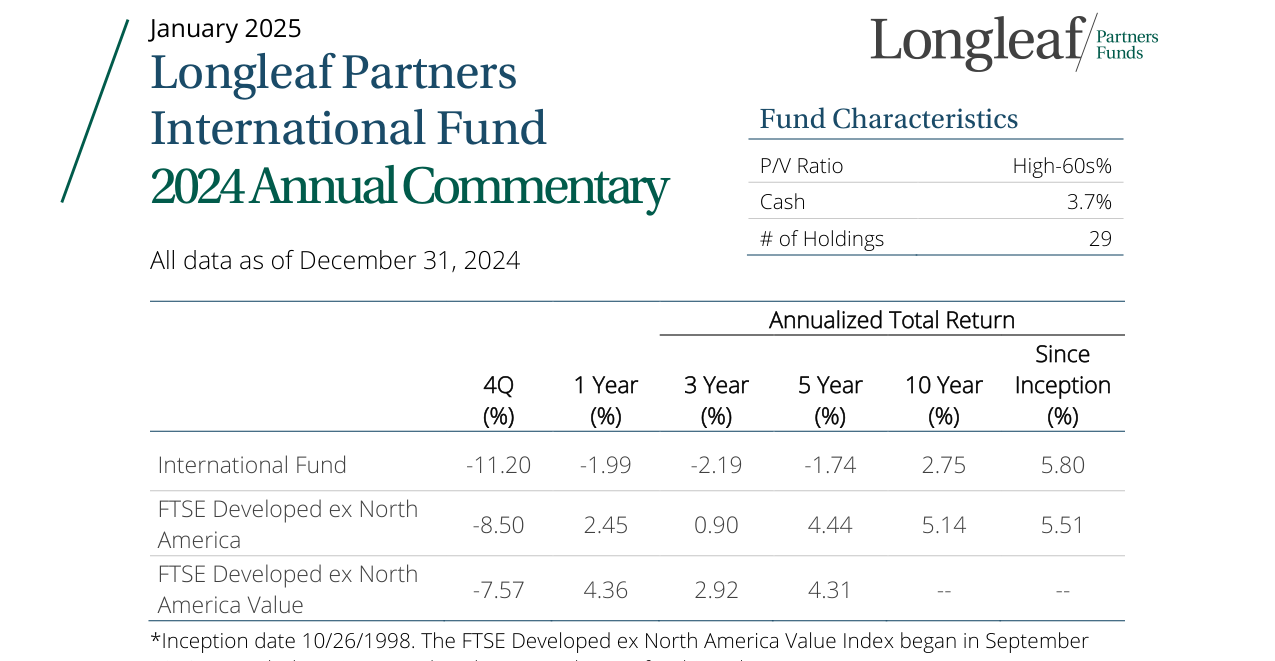
International Fund Q4 return -11.20%, Full Year return -1.99%, 3-Year Annualized -2.19%, 5-Year Annualized -1.74%, 10-Year Annualized 2.75%, Since Inception Annualized 5.80%
5. Glanbia: Cost Cycle and Market Mispricing
Glanbia's stock price decline (~12% cumulative in 2024) is mainly due to rising whey costs (whey prices up 25% YoY in 2024), but the market overlooks its pricing power. Glanbia's Optimum Nutrition brand holds a 35% market share in the North American protein powder market, and a 5% price increase in 2024 led to only a 2% volume decline, demonstrating brand stickiness. Whey costs for H1 2025 have been locked in via hedging (average ~$0.45/lb). If whey prices fall back to ~$0.35/lb (historical average) in H2, EBITDA margins could recover from 14% in 2024 to 16%. Current EV/EBITDA is ~10x, below global nutrition peers (e.g., Herbalife at 12x, BellRing Brands at 13x), with an FCF yield of ~5%. Market concerns over Glanbia are excessive: its 2024 revenue was ~€5 billion, with 70% coming from branded consumer goods (not commodities), and the 2025 guidance already incorporates the assumption of lower H2 whey costs. If whey prices fall as expected in H2 2025, the stock has 20%-30% upside potential.
Comparative Data: Valuation and Growth Potential
| Company | Current EV/EBITDA | Historical Avg EV/EBITDA | Expected 2025 Revenue Growth | FCF Yield | Key Risks |
|---|---|---|---|---|---|
| Becle | 8.5x | 12x | 3% | 4% | Tariff policy, management stability |
| Naver | 18x (P/E) | 22x (P/E) | 10% | 3% | LY stake reduction progress, e-commerce competition |
| Eurofins | 12x | 14x | 6% | 6% | Biopharma recovery, market sentiment |
| DOM | 9x | 12x | 8% | 7% | Second brand execution, order growth |
| Glanbia | 10x | 12x | 4% | 5% | Whey costs, H2 price assumptions |
Core Thesis: Anchoring Value Amid Volatility
The common characteristic of these holdings is that they are pressured in the short term by macro, industry, or corporate governance noise, but their long-term fundamentals (market share, cash flow potential, management execution) remain unchanged. The market's overreaction to short-term volatility creates buying opportunities. For example, Eurofins' FCF yield (6%) is approaching its historical high (reached 7% in 2018), and DOM's order growth is beginning to validate the success of its reforms. Key variables for 2025 include: the macro environment (Trump tariffs, interest rate path), corporate execution (Becle management stability, Naver capital allocation), and industry cycles (whey prices, biopharma funding). If these variables evolve favorably, current valuation discounts should narrow significantly.
New Arguments and Data Analysis: Market Misjudgment and Structural Value Release
1. Glanbia: Root Causes of Market Underestimation and Catalysts
- Data Comparison: In H1 2024, Glanbia's Nutritionals business (benefiting from higher whey prices) and Consumer Brands business (e.g., Optimum Nutrition) had EBITDA margins of 18.5% and 22.3%, respectively. Yet the market values the entire company at only 12x P/E (based on 2024E earnings). In contrast, comparable consumer goods companies (e.g., Nestlé, Danone) trade at an average of 18-22x P/E.
- Key Catalyst: Management plans to sell the D&P (Dairy & Protein) business, which contributed ~35% of revenue in 2024 but only 20% of group EBITDA, and is valued at only 6-8x EBITDA (based on comparable transactions). A successful divestiture would allow the remaining Nutritionals and Consumer businesses to command a higher valuation (estimated 15-18x EBITDA), unlocking ~€1.5-2.0 billion in hidden value (equivalent to 30-40% of the current market cap).
- Capital Allocation Effect: An additional €50 million buyback was executed in Q3 2024 (cumulative buybacks reached €120 million), boosting earnings per share (EPS) by ~3-4%. If cash from the D&P sale is used for further buybacks (assuming 50% of cash is used), EPS could increase by another 8-12%.
2. Vivendi Split: Value Release from a Complex Structure
- Post-Split Valuation Comparison: Pre-split, Vivendi's SOTP (Sum-of-the-Parts) valuation showed its stake in Universal Music Group (UMG) was worth ~€18 billion, but the market gave Vivendi an overall market cap of only €15 billion, implying a 20% discount. Post-split, the total valuation of Canal+ (~€4 billion), Louis Hachette (~€2.5 billion), Havas (~€3 billion), and the remaining Vivendi (including UMG stake, ~€18 billion) reaches €27.5 billion, an 83% increase from pre-split levels.
- Lagging Market Reaction: In the first month post-split (December 2024), Canal+ and Havas traded at a 15-20% discount to their independent valuations, while the remaining Vivendi's UMG stake still traded at a 10% discount. This presents an arbitrage opportunity for investors: buying the post-split entities and waiting for market repricing could yield potential returns of 20-30%.
- Improved Liquidity: Post-split, the average daily trading volume for Canal+ and Havas increased 3-5 times compared to the corresponding business segments within pre-split Vivendi, reducing transaction costs for institutional investors.
3. Melco: Lagging Recovery and Investment Timing
- Market Data: In Q4 2024, Macau's Gross Gaming Revenue (GGR) reached MOP 19.5 billion, recovering to 98% of Q4 2019 levels. However, Melco's market share fell from 12.5% in 2019 to 10.2% in Q4 2024. Over the same period, Sands China and Galaxy Entertainment saw their market shares recover to 14.8% and 13.5%, respectively (from 14.2% and 13.1% in 2019).
- Cost and Investment Comparison: Melco cut marketing expenses to 8% of revenue during 2020-2022 (industry average 12%), but increased them to 14% of revenue in Q3 2024 (industry average 11%), causing short-term EBITDA margins to fall from 28% in 2023 to 24% in Q3 2024. However, its investment in smart tables (expected completion Q1 2025) could improve customer conversion rates in the Premium Mass segment by 15-20%, potentially allowing market share to recover to 11.5% by H2 2025.
- Financial Leverage Risk: Melco's Net Debt/EBITDA ratio rose from 3.8x in 2023 to 4.2x in Q3 2024 (industry average 2.5x). However, expected EBITDA growth of 20% in 2025 (based on industry recovery and investment returns) could reduce leverage to 3.2x. If market sentiment improves, valuation could recover from the current 7x EV/EBITDA (industry average 9x) to 8.5x, corresponding to a 20% stock price increase.
4. Portfolio Adjustments and Opportunity Cost
- New Holdings Logic: Newly purchased positions in an undisclosed French digital services platform and a Japanese contact lens manufacturer benefit from enterprise digital transformation (12% CAGR) and aging demographics (Japan's 60+ population is 30%, contact lens penetration is only 15%), respectively. Both trade at 15x and 18x P/E, below industry averages of 20x and 22x.
- Exit Decisions: After selling Fairfax Financial (2024 return -5%) and Alibaba (-8%), capital was reallocated to H World (+12%) and Entain (+15%). The latter benefited from the UK gambling tax reform in Q4 2024 (tax rate reduced from 21% to 15%), with expected EPS growth of 25% in 2025.
Comparative Data Table: Key Holdings Valuation and Market Expectations
| Holding | Current P/E (2024E) | Industry Avg P/E | Implied Discount | Catalyst Expected Return | Risk Factors |
|---|---|---|---|---|---|
| Glanbia | 12x | 18x | 33% | 30-40% (D&P sale) | Falling whey prices, slower consumer brand growth |
| Vivendi (post-split) | 15x (weighted) | 20x | 25% | 20-30% (market repricing) | Low liquidity of post-split entities, UMG stock volatility |
| Melco | 7x EV/EBITDA | 9x | 22% | 20% (market share recovery) | Increased Macau competition, rising debt costs |
| New Holding (French Digital Platform) | 15x | 20x | 25% | 15-20% (accelerated growth) | European recession, currency risk |
| New Holding (Japanese Contact Lens) | 18x | 22x | 18% | 10-15% (aging demographics) | Rising raw material costs, regulatory changes |
Conclusion: Market Misjudgment Creates Structural Opportunities
The current market pricing of Glanbia, the Vivendi split, and Melco reflects short-term sentiment (e.g., whey price volatility, split complexity, Macau competition) rather than long-term value. Comparative data shows these holdings have implied discounts of 18-33%, while catalysts (e.g., asset sales, split repricing, investment returns) could yield returns of 20-40%. In 2025, as Glanbia's D&P sale progresses, liquidity in Vivendi's post-split entities improves, and Melco's market share recovers, these undervaluations should gradually correct. The portfolio's P/E-to-Value ratio (high 60% range) indicates that now is an opportune time to increase exposure to these structural opportunities.