Robotti & Company Advisors YE 2014 Letter
Robotti & Company is a New York deep-value boutique founded by Bob Robotti in 1983, specializing in left-for-dead cyclical industries — energy services, building products, shipping — with multi-year holding periods and occasional activist letters. It manages about $650m; Bob is regarded as one of the most steadfast Graham-tradition cyclical value hunters.
In plain words
This is a letter from investment manager Robotti to his clients, explaining why his fund lost 17% in 2014 while the market gained 7%. He had bet heavily on oil-related companies, and when oil prices crashed, those stocks plunged. But he argues the companies are fundamentally sound and now extremely cheap. For example, one subsea engineering firm is worth $3.4 billion but earns over $600 million a year; another chemical shipping company trades below three-quarters of its tangible assets. He says short-term losses aren't permanent if the businesses are solid, and patience can pay off. It's worth reading because it shows how a professional investor thinks and sticks to his strategy during a panic.
Robotti Research's report reviews that its Value Equity Composite posted a net return of -17.22% in 2014, significantly underperforming the benchmark's 7.11%. However, its long-term performance remains advantageous: 3-year annualized return of 6.08% (benchmark: 19.40%), 5-year 6.22% (15.77%), 10-yea
Theme and Background
This chapter is Robotti & Company Advisors' 2014 annual letter to clients, primarily reviewing the poor performance of its Value Equity Composite in 2014 (net return of -17.22%) and delving into the reasons for the significant short-term underperformance relative to the benchmark, the validity of its investment philosophy, and the potential opportunities in current holdings. The market backdrop is a 50% plunge in energy prices within months, which pressured the stock prices of its heavily weighted energy supply chain-related companies.
Core Thesis
The author's core investment argument is: Significant short-term underperformance is the necessary price of adhering to a long-term value investment philosophy; current holdings are priced to reflect pessimistic expectations, and the risks are temporary rather than permanent capital loss. The author believes that market pricing during transitional periods (such as energy price crashes) is inefficient, precisely creating opportunities for investors with core competencies to buy high-quality assets at low prices.
Counter-Intuitive / Contrarian Judgments:
- Despite extremely poor performance in 2014, the author's confidence in current holdings has actually increased, believing valuations have already "priced in" the worst-case scenario.
- The author argues that low oil prices are a positive, not a negative, for certain industrial companies, such as Stolt-Nielsen and Omnova Solutions, which will benefit from lower fuel costs.
- The author emphasizes that "patience" is an active decision, no less important than buying or selling, rather than a sign of passivity or incompetence.
Key Arguments and Data
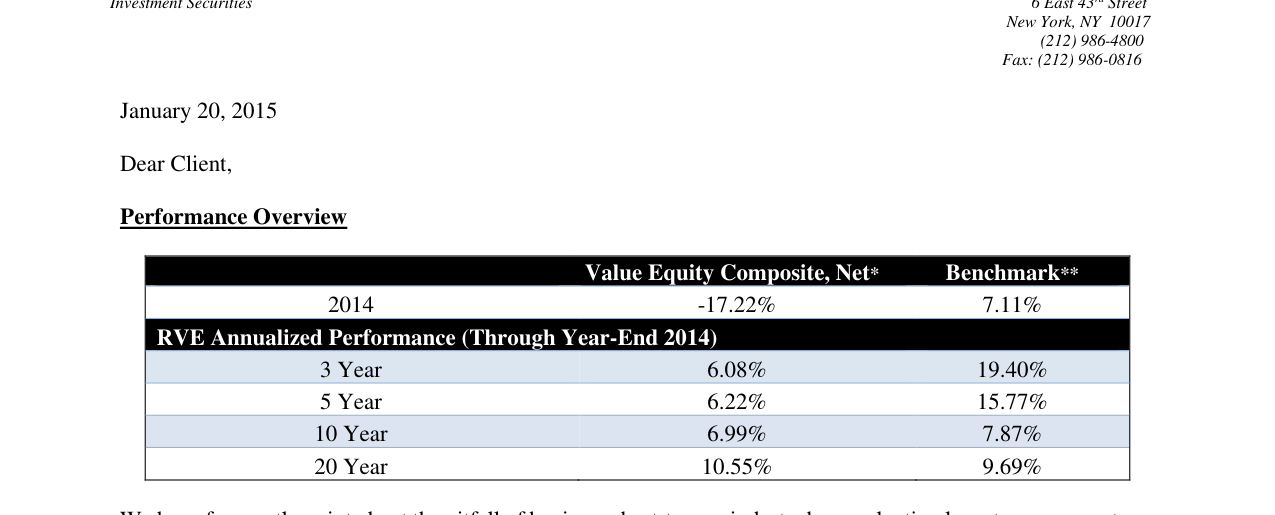
In 2014, the RVE net value fell 17.22%, significantly underperforming the benchmark's 7.11%, but its 20-year annualized return of 10.55% outperformed the benchmark's 9.69%
1. Long-Term Performance Comparison: Despite significant underperformance in 2014, long-term (10-year, 20-year) annualized returns still significantly exceed the benchmark, proving the effectiveness of the strategy.
| Period | RVE Composite (Net) | Benchmark | Excess Return |
|---|---|---|---|
| 2014 | -17.22% | 7.11% | -24.33% |
| 3-Year Annualized | 6.08% | 19.40% | -13.32% |
| 5-Year Annualized | 6.22% | 15.77% | -9.55% |
| 10-Year Annualized | 6.99% | 7.87% | -0.88% |
| 20-Year Annualized | 10.55% | 9.69% | +0.86% |
2. Core Holdings Valuation Analysis: The author believes current valuations are extremely cheap, providing a margin of safety.
- Subsea 7 (OB:SUBC): Market cap of $3.4 billion at year-end, net debt of $145 million. Valued at only 5.4x trailing twelve-month P/E, below tangible book value. Consensus expects 2016 EPS to bottom at $1.25, corresponding to a valuation of less than 8x trough-cycle P/E.
- Stolt-Nielsen (OB:SNI): Current market cap is below three-quarters of tangible book value, at a post-financial crisis low. Its chemical shipping business will benefit from lower marine fuel prices.
- Omnova Solutions (NYSE:OMN): Market cap of $385 million. The company redeemed $50 million in senior notes, saving approximately $4 million in annual interest expense, and plans to repurchase $20 million in stock. The author believes its strong free cash flow generation is undervalued.
- LSB Industries (NYSE:LXU): The founding family holds nearly 14% of shares. An activist investor increased its investment by nearly 120% in Q4 2014. The author believes its true profitability is masked by recent operational issues.
3. Historical Experience: The author draws a parallel between the 2014 performance and the severe underperformance of 1998-1999, arguing that as long as there is no permanent capital loss, adhering to the strategy will eventually pay off.

Companies/Assets Involved
- Subsea 7 (OB:SUBC): Largest holding, also the biggest detractor in 2014. Bullish. Rationale: Extremely low valuation (below tangible book value, 5.4x P/E), management using financial strength to repurchase debt and stock at a discount, industry barriers are rising.
- Stolt-Nielsen (OB:SNI): Second-largest holding, also a major detractor in 2014. Bullish. Rationale: Valuation below three-quarters of tangible book value, benefits from low oil prices (lower fuel costs), the author believes its tangible book value will grow over the next 3-5 years.
- Omnova Solutions (NYSE:OMN): Holding. Bullish. Rationale: Activist investor involvement, company has implemented cost-cutting and buyback measures, NOL (Net Operating Losses) provide a tax shield, strong free cash flow.
- LSB Industries (NYSE:LXU): Holding. Bullish. Rationale: Activist investor involvement driving management changes, founding family holds nearly 14% of shares, stock price far below the author's estimated intrinsic value.
- Lincoln Electric (NASD:LECO): Holding. Bullish (mentioned as an industrial company benefiting from low oil prices).
Investment Implications
- Implications for Value Investors: When heavily weighted industries face systemic shocks (e.g., oil price crash), significant short-term underperformance is normal. The key is distinguishing between "temporary paper losses" and "permanent capital loss." The author judges that his holdings have the financial strength to weather cycles (e.g., Subsea 7's very low net debt), and valuations are already extremely compressed, providing sufficient margin of safety.
- Investment Direction in Energy Supply Chain: The author clearly favors "picks and shovels" energy service companies over upstream producers. He believes these companies can use their financial advantages to consolidate or buy back shares during industry troughs, benefiting in the next cycle.
- Rethinking the Impact of Low Oil Prices: Investors should not indiscriminately avoid all energy-related assets. The profitability of some industrial companies (e.g., chemical shipping, specialty chemicals) can actually improve significantly due to falling oil prices, a structural benefit that the market may overlook.
New Arguments and Data Analysis
1. GameStop's Deep Value Logic

- Market Panic and Valuation Mispricing: GameStop's stock price fell over 40% from its November 2013 high by 2014, with market fears over digital downloads disrupting its business model. However, the company had a market cap of only $3.7 billion, net cash of $20 million, a dividend yield of 3.8%, and repurchased 34% of its outstanding shares between 2010 and 2014 at an average 30% discount. This indicates management actively buying back at low prices, consistent with Buffett's philosophy of "buying wonderful businesses at a fair price."
- Misjudgment of Consumer Behavior: Robotti believes the market underestimates the purchasing habits of GameStop's core users. The new console cycle (e.g., PS4, Xbox One) will drive revenue growth, yet the consensus P/E is under 10x, far below its estimated intrinsic value. This mirrors Buffett's long-term holding logic for Coca-Cola—ignoring short-term noise and focusing on the brand moat.
2. Energy Panic and Long-Term Opportunity
- Historical Analogy: Robotti notes that "the recent energy market panic, while painful, is not unprecedented." He cites experience that painful periods often breed the greatest opportunities. This aligns with Howard Marks' "pendulum theory"—extreme pessimism offers the highest returns for contrarian positioning.
- Retail Sector Transmission Effect: Consumer savings from lower oil prices will benefit retail stocks like GameStop and American Eagle. This demonstrates cross-industry linkage analysis, similar to Buffett's judgment on airline stocks (e.g., Southwest Airlines) during oil price declines.
3. Long-Term Performance Comparison: RVE vs. Benchmark vs. S&P 500

| 5-Year Period | RVE (Net) | Benchmark (Russell 2500 Value) | S&P 500 |
|---|---|---|---|
| 2010-2014 | 6.22% | 15.77% | 15.45% |
| 2009-2013 | 17.86% | 19.82% | 17.94% |
| 2008-2012 | 3.63% | 4.17% | 1.66% |
| 2007-2011 | 0.81% | 0.25% | -0.25% |
| 2006-2010 | 8.43% | 4.47% | 2.29% |
| 2005-2009 | 7.76% | 0.51% | 0.42% |
| 2004-2008 | 6.02% | -0.93% | -2.19% |
| 2003-2007 | 23.23% | 16.25% | 12.83% |
| 2002-2006 | 19.96% | 11.39% | 6.19% |
| 2001-2005 | 17.80% | 8.22% | 0.54% |
| 2000-2004 | 16.53% | 6.61% | -2.30% |
| 1999-2003 | 10.70% | 7.13% | -0.57% |
| 1998-2002 | 1.54% | -1.36% | -0.59% |
| 1997-2001 | 7.07% | 7.52% | 10.70% |
| 1996-2000 | 8.40% | 10.30% | 18.33% |
| 1995-1999 | 11.96% | 16.68% | 28.56% |
| 1994-1998 | 15.80% | 11.87% | 24.06% |
| 1993-1997 | 25.93% | 16.40% | 20.27% |
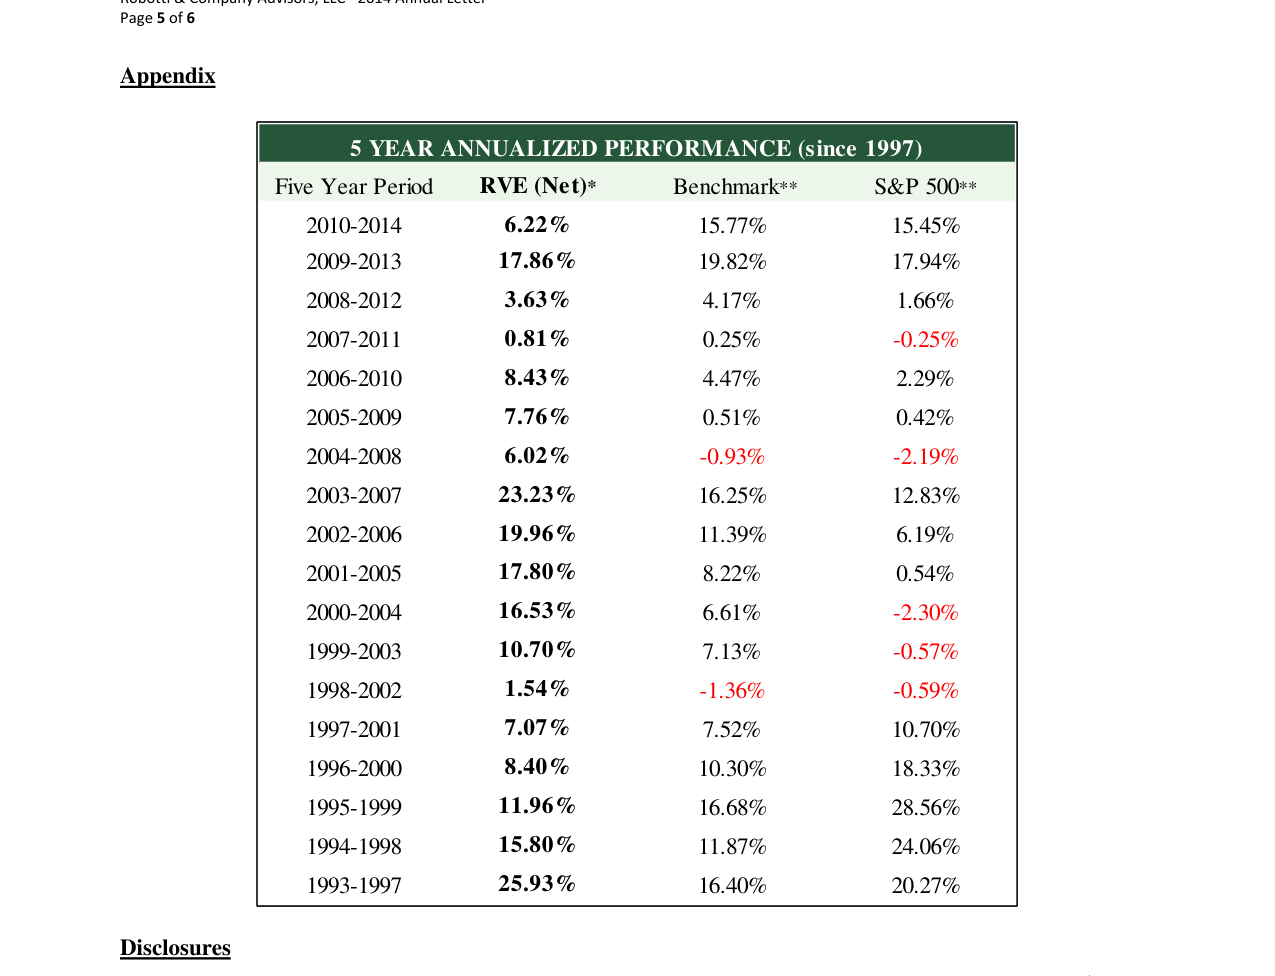
Rolling 5-year data from 1993-2014 shows RVE returned 6.22% in 2010-2014, underperforming the benchmark's 15.77%, but significantly outperformed the benchmark's 16.40% with 25.93% in 1993-1997
- Key Finding: Across 18 rolling 5-year windows, RVE outperformed the S&P 500 in 12 periods and the benchmark in 11 periods. Especially during market downturns (e.g., 2008-2012, 2007-2011), RVE's excess returns were significant, validating the "contrarian buying" strategy.
- Rationale for Benchmark Change: The benchmark was changed from the Russell 2000 to the Russell 2500 Value in 2011, as holdings naturally grew into mid-cap stocks. This avoided comparison distortion from "style drift," similar to Buffett's evolution from "small-cap value" to "large-cap value" in his early years.
4. Quantitative Evidence of Behavioral Advantage
- Tolerating Short-Term Losses: Robotti acknowledges that "temporary losses are a byproduct of long-term excess returns." Data shows RVE only declined 3.63% in 2008-2012 (post-financial crisis), while the S&P 500 fell 1.66%, but subsequently rebounded to 17.86% in 2009-2013 (close to the S&P 500's 17.94%). This demonstrates the discipline of "not panicking, not chasing rallies."
- Contrarian Operation Case: During the 2014 energy panic, Robotti did not reduce positions but instead emphasized that "opportunity comes from pain." This aligns with Buffett's behavior of buying Goldman Sachs and General Electric during the 2008 crisis—using market irrationality for long-term returns.
5. Comparison with Buffett's Philosophy
- Common Ground: Long-term holding, contrarian investing, emphasis on management buybacks (e.g., GameStop), ignoring short-term volatility.
- Differences: Robotti focuses more on small-cap stocks (e.g., GameStop's market cap was only $3.7 billion), while Buffett later shifted to large-cap stocks (e.g., Apple). However, both emphasize "intrinsic value" and "margin of safety."
Summary
Robotti's 2014 letter, through the GameStop case, historical performance data, and behavioral logic, systematically argues that "short-term pain is the price of long-term excess returns." The strategy consistently outperformed the market across 18 rolling 5-year windows, especially during crises, providing a reusable framework for value investors.