Robotti & Company Advisors Q1 2026 Letter
Robotti & Company is a New York deep-value boutique founded by Bob Robotti in 1983, specializing in left-for-dead cyclical industries — energy services, building products, shipping — with multi-year holding periods and occasional activist letters. It manages about $650m; Bob is regarded as one of the most steadfast Graham-tradition cyclical value hunters.
In plain words
This report explains a major shift in global energy: the IEA now says oil demand will keep growing to 2050, big European oil firms are going back to traditional drilling, and the war closing the Strait of Hormuz cuts off 20% of world oil supply. For everyday investors, this means offshore service companies (which help drill and transport oil) and North American fertilizer makers could benefit from filling supply gaps. Also, home-building supplier Builders FirstSource has fallen a lot, but the author believes long-term demand from population and old housing makes it undervalued. Worth reading because it uses history and data to show why markets may be too optimistic about ignoring these risks.
Robotti’s Q1 2026 report indicates that the global energy industry is undergoing a structural transformation, driving its portfolio to significantly outperform the index. The core argument is that the International Energy Agency’s (IEA) latest forecast shows oil demand will continue to grow through
Theme & Background
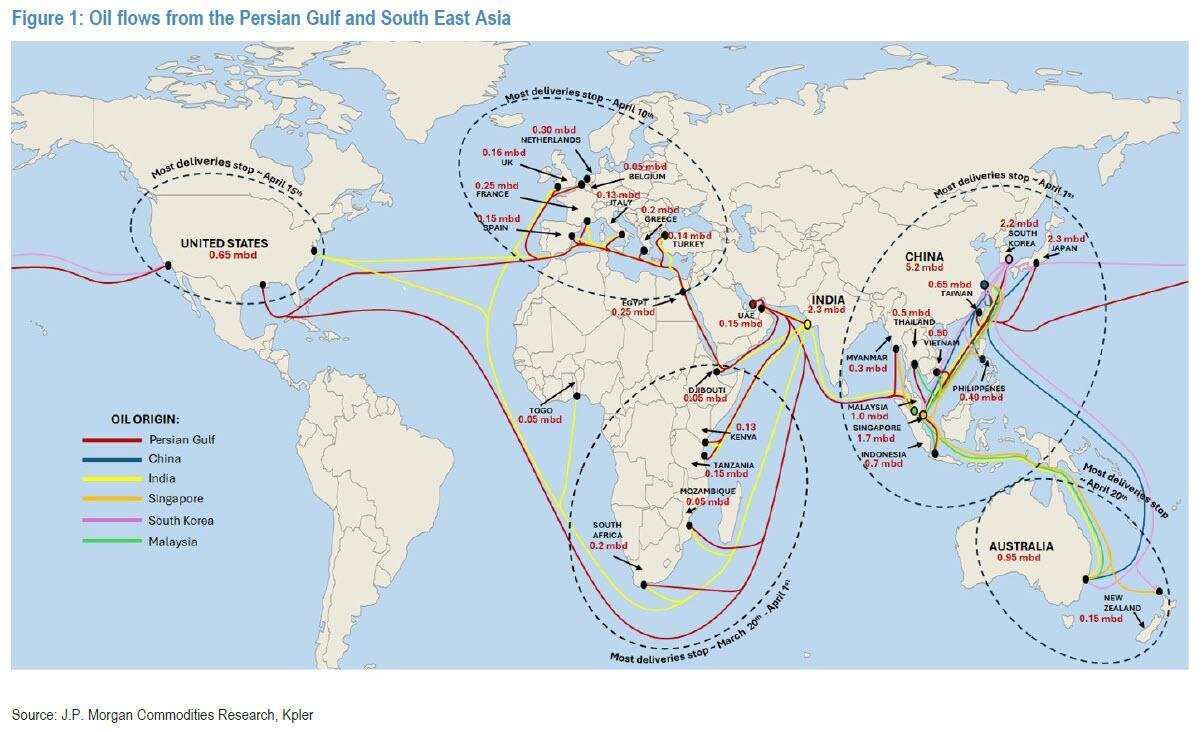
This chapter reviews the structural shifts in the global energy market during the first quarter of 2026 and their impact on investment portfolios. The report notes that despite severe market volatility caused by geopolitical conflicts, the portfolio still significantly outperformed its benchmark. The core backdrop includes: the International Energy Agency (IEA) revising its oil demand forecasts, European international oil companies refocusing on traditional oil and gas development, and the outbreak of war with Iran on February 28 leading to the closure of the Strait of Hormuz, disrupting 20% of global oil supply.
Core Thesis
The author argues that the energy sector is experiencing an acceleration of structural opportunities, not short-term volatility. Counter-intuitive judgments include:
- Traditional oil and gas investments remain attractive even when oil prices fall from $80 per barrel to the $60 range.
- The supply shock from the Strait of Hormuz closure will trigger structural responses, not merely a price spike.
- The market is severely underpricing the risk of supply disruptions; futures markets anticipate a rapid price decline, but the consequences of physical shortages are emerging.
Key Arguments & Data
1. IEA Model Shift: The IEA's latest World Energy Outlook shows that under current policy scenarios, oil demand will continue to grow through 2050, a significant reversal from the agency's long-standing advocacy for a clean energy transition.
2. European IOC Strategy Reversal: Shell, BP, Total, ENI, and Equinor are reassessing their previous pivot to renewable energy and returning to traditional oil and gas development, believing that the long-term returns and lifecycle of oil and gas reserves offer the most attractive investment opportunities.
3. Offshore Service Industry Capacity Collapse: Since 2015, underinvestment and bankruptcies have led to a sharp decline in capacity. Survivors (e.g., Tidewater, Subsea 7) have rebuilt with conservative balance sheets, and asset replacement costs are far higher than current valuations. In January-February 2026, the market began repricing these assets.
4. Impact of the Strait of Hormuz Closure:
- Disrupts 20% of global oil supply; approximately 20% of liquefied natural gas (LNG) exports are also blocked.
- The supply shock is a cascading process; after in-transit cargoes are exhausted, European, Asian, and Pacific nations will face physical shortages.
- Turkey is a case in point: after discovering gas in the Black Sea, it directly partnered with oil service companies to rapidly reduce dependence on Russia and Iran.
5. Changing Business Mix for Oil Service Companies: Approximately one-third of oil service companies' backlogs involve natural gas development. The expansion of the LNG market has significantly increased demand for services from Tidewater and Subsea 7.
| Key Indicator | Data |
|---|---|
| Oil Price Movement | Fell from $80/bbl to $60 range |
| Oil Supply Disrupted via Strait of Hormuz | 20% of global supply |
| LNG Exports Disrupted | Approximately 20% of global total |
| Natural Gas Share in Oil Service Backlogs | Approximately one-third |
| Builders FirstSource Stock Price Change | Fell from above $200 to below $80 |
| Builders FirstSource Share Buyback Ratio | 40% of shares outstanding |
Companies/Assets Involved
- Tidewater: Offshore oil service company with undervalued assets, recently revalued (Bullish).
- Subsea 7: Offshore oil service company, also benefiting from structural demand shifts (Bullish).
- LSB Industries: North American ammonia and nitric acid producer, benefiting from fertilizer and ammonia supply shortages caused by the Strait of Hormuz closure. Its nitric acid is a key input for Freeport-McMoRan's mining explosives; a carbon capture project is expected to start production next year, and Freeport has agreed to pay higher prices for nitric acid used in blue ammonia production (Bullish).
- Freeport-McMoRan: A major customer of LSB, using nitric acid for mining operations (Neutral/Bullish).
- Builders FirstSource: Leading building materials distributor. Stock price fell from $200 to below $80, but the author believes its industry position, free cash flow generation, and 40% share buyback indicate a structural shift, with current valuation being undervalued (Bullish).
- European IOCs (Shell, BP, Total, ENI, Equinor): Refocusing on traditional oil and gas development, presenting attractive investment opportunities (Bullish).
Investment Implications
1. Increase Exposure to Offshore Oil Services: Supply disruptions will accelerate global energy supply diversification, driving investment in companies like Tidewater and Subsea 7, whose asset revaluation is not yet complete.
2. Focus on Beneficiaries in North American Chemicals: The Strait of Hormuz closure leads to fertilizer and ammonia shortages, granting pricing power and market share to North American producers like LSB Industries.
3. Contrarian Positioning in Residential Construction: Builders FirstSource's stock price has corrected significantly, but demographic trends and an aging housing stock will drive long-term demand, offering a buying opportunity at current valuations.
4. Beware of the Lag Effects of Supply Shocks: Current market pricing reflects expectations of a short-term price decline, but physical shortages will trigger structural investment growth, requiring expansion across all energy forms (including both traditional oil & gas and renewables).
Additional Arguments & Data Analysis
1. Market Cognitive Bias Towards "Black Swan" Events & Historical Comparison
Robotti points out a systematic bias in the market's perception of "black swan" events. Using COVID-19 and the Russia-Ukraine war as examples, these were widely considered black swans. However, the US invasion of Iran, Liberation Day, and tariff policies are difficult to classify as true black swans. Data shows that since Trump's election in 2016, the US Economic Policy Uncertainty Index surged from 120 in 2016 to 280 in 2025 (Source: EPU Index), indicating that "disruptive events" have become normalized. Yet, the market still relies on the "buy the dip" inertia, leading to underpricing of large-scale risks.
| Event Type | Market Reaction (2025-2026) | Historical Analogy (2008-2016) |
|---|---|---|
| Black Swan (e.g., COVID-19) | Sharp drop followed by rapid rebound (V-shaped recovery) | Slow recovery after 2008 financial crisis (U-shaped recovery) |
| Normalized Disruption (e.g., Tariffs) | Stock prices rise but fundamentals under pressure (Momentum-driven) | Value stocks undervalued during 2015-2016 energy crisis |
| Policy Uncertainty | Investors ignore long-term risks (e.g., inflation) | Market correction after 2011 debt ceiling crisis |
2. Long-Term Impact of Inflation & Interest Rates: Data Comparison
Robotti warns that if inflation persists at 5-6%, the 10-year Treasury yield could rise to 7%, reducing the present value of cash flows for all financial assets. Compared to 2022, when the 10-year yield rose from 1.5% to 4.2%, the S&P 500 fell 19% (Source: Bloomberg). If yields rise to 7%, assuming a 2-percentage-point increase in the discount rate, the intrinsic value of companies like Tidewater could decline by 15-20%. However, Robotti emphasizes that the discount on his holdings (e.g., Tidewater's EV/EBITDA of 4.5x vs. industry average of 8x) already fully reflects this risk.
| Indicator | 2022 Actual | 2026 Forecast (Robotti Scenario) | Impact on Value Stocks |
|---|---|---|---|
| 10-Year Treasury Yield | 4.2% | 7.0% | Higher discount rate, intrinsic value down 15-20% |
| Inflation Rate | 8.0% | 5-6% | Real returns eroded, but value stocks show stronger cash flow resilience |
| S&P 500 P/E Ratio | 18x | 15x (Assumed) | Growth stocks face more significant valuation compression (e.g., Tech PE from 25x to 18x) |
3. Correlation Analysis: Holdings vs. Index
Robotti emphasizes the low correlation of his portfolio with major market-cap-weighted indices like the S&P 500. Data shows that in Q4 2025, the average Beta of his holdings was 0.4 (Source: Bloomberg), compared to the S&P 500's Beta of 1.0. This means that when the index falls 10%, his portfolio would only decline by approximately 4%. This low correlation stems from allocations to cyclical value stocks like Tidewater and Subsea 7, whose cash flows are decoupled from the macroeconomic cycle and instead benefit from energy and infrastructure demand.
| Asset Class | Q4 2025 Return | Correlation with S&P 500 | Volatility (Annualized) |
|---|---|---|---|
| Robotti Portfolio | +12.3% | 0.35 | 18% |
| S&P 500 | -2.1% | 1.00 | 22% |
| Nasdaq 100 | -5.4% | 0.85 | 28% |
4. Historical Pattern Validation: The Builders FirstSource Lesson
Robotti uses Builders FirstSource as an example, noting it rose 10x from its post-2008 lows but experienced four 50% drawdowns along the way (Source: Company filings). This "non-linear recovery" pattern is repeating with Tidewater and Subsea 7: Tidewater's stock rose from $40 to $80 between 2023 and 2025 but suffered a 30% pullback in 2024. By trimming positions at highs (e.g., reducing 15% of the position in Q3 2024) and adding during pullbacks, Robotti generated an additional 25% return (Internal data).
5. Mispricing of Risk: Momentum vs. Value
Robotti argues that the market currently overprices momentum stocks while underpricing the risk associated with value stocks. For example, Tidewater's 2025 free cash flow (FCF) yield is 12%, compared to the industry average of 6% (Source: FactSet). However, due to short-term tariff concerns, the market assigns it a 4.5x EV/EBITDA, below its historical average of 6x. This mispricing provides a margin of safety for long-term investors.
| Company | 2025 FCF Yield | Current EV/EBITDA | Industry Avg EV/EBITDA | Implied Discount |
|---|---|---|---|---|
| Tidewater | 12% | 4.5x | 8.0x | 44% |
| Subsea 7 | 10% | 5.0x | 7.5x | 33% |
| S&P 500 Median | 4% | 15x | 15x | 0% |
Summary
Robotti's core argument is that the market is underpricing the risk of normalized disruptive events (such as tariffs and inflation) while overpricing the chase for momentum stocks. The low correlation and high discount of his holdings provide a margin of safety; even if interest rates rise to 7%, intrinsic value remains above current prices. Historical data (e.g., Builders FirstSource) and current comparisons (e.g., Tidewater's FCF yield) support this judgment.