Giverny Capital Annual Letter to Partners 2014
Giverny Capital is a Montreal quality-growth (GARP) firm founded in 1998 by engineer-turned-investor François Rochon, devoted to owning outstanding businesses for the very long run — turnover is minimal and holding periods often exceed a decade; his personally managed Rochon Global portfolio has a tracked record since July 1993. Its annual partner letters, all public since 2001, are famous for the candid "Podium of Errors" (gold, silver and bronze medals for the year's best mistakes) and rank among North America's most-read investor letters.
In plain words
This is Giverny Capital's annual letter to its partners. The main idea is simple: owning a stock means owning a piece of a business. Short-term price swings are noise; what matters is whether the company grows its earnings over the long run. For regular investors, this means stop obsessing over daily ups and downs and focus on the business's ability to generate cash. The report shows 20+ years of data proving that great companies can underperform for years but still beat the market in the end. It also notes that even top investors lag about 30% of the time, so don't panic if you're behind. Worth reading because it proves patience and picking good businesses beat constant tinkering.
Giverny Capital Inc. 2014 Annual Letter Key Takeaways The report reviews the firm's long-term performance since 1993, when it began managing a family investment portfolio based on the philosophies of investment masters such as Buffett and Graham, emphasizing a partnership culture of "sharing the sam
Theme and Background
This chapter is the introductory section of Giverny Capital's 2014 annual letter. It primarily outlines the firm's history, core principles of its investment philosophy, and its performance in 2014 and over the long term. The report aims to articulate its long-term investment philosophy to clients (referred to as "partners") and emphasizes a culture of "being in the same boat," where interests are fully aligned with those of the clients.
Core Thesis
The author's core investment argument is: Stocks represent fractional ownership of a business; markets are irrational and unpredictable in the short term but reflect a company's intrinsic value over the long term. Therefore, the key to investment success lies in focusing on analyzing a business's intrinsic performance ("owner earnings") rather than short-term stock price fluctuations. The author believes that as long as the stock selection process is rational and sound, investment returns will eventually follow.
Counter-Intuitive / Contrarian Judgments:
- The author readily accepts short-term underperformance relative to the benchmark (6 out of 21 years, or 29% of the time, underperforming the S&P 500), viewing it as a normal occurrence when an investment style or specific companies are out of favor with the mainstream.
- The author emphasizes that, over the long term, the vast majority of fund managers cannot beat the S&P 500, and those who can typically underperform for one out of every three years.
Key Arguments and Data
The report supports the validity of its investment philosophy using long-term performance data from three distinct portfolios (Global, US, Canada).
1. Global Portfolio (Rochon Global Portfolio) Long-Term Performance (July 1, 1993 – December 31, 2014)
| Metric | Rochon Global Portfolio | Benchmark Index | Excess Return |
|---|---|---|---|
| 2014 Return | 28.1% | 17.8% | +10.2% |
| Annualized Return Since Inception | 16.1% | 8.7% | +7.3% |
| Total Return Since Inception | 2366.3% | 507.0% | +1859.3% |
2. US Portfolio (Rochon US Portfolio) Long-Term Performance (July 1, 1993 – December 31, 2014)
| Metric | Rochon US Portfolio | S&P 500 | Excess Return |
|---|---|---|---|
| 2014 Return | 18.0% | 13.7% | +4.3% |
| Annualized Return Since Inception | 15.8% | 9.4% | +6.4% |
| Total Return Since Inception | 2252.5% | 596.5% | +1656.0% |
| Consecutive Years Outperforming S&P 500 | 7 years | - | - |
3. Canada Portfolio (Rochon Canada Portfolio) Performance (2007 – 2014)
| Metric | Rochon Canada Portfolio | S&P/TSX | Excess Return |
|---|---|---|---|
| 2014 Return | 20.3% | 10.6% | +9.7% |
| Annualized Return Since 2007 | 17.8% | 4.6% | +13.2% |
| Total Return Since 2007 | 271.0% | 42.9% | +228.1% |
Analysis of 2014 Performance Drivers:
- The intrinsic value of companies in the portfolio grew by an average of approximately 13%, significantly above average.
- Market returns exceeded intrinsic value growth due to valuations (P/E ratios) and the Canadian dollar exchange rate reverting to more reasonable levels, which the author describes as "a year of returning to normalcy."
Companies/Assets Mentioned
This chapter mentions three core holdings in the Canadian portfolio, all with a bullish view:
- Dollarama: Stock price rose 35% in 2014, an "all-star" in the Canadian portfolio.
- Valeant: Stock price rose nearly 22% in 2014, despite significant volatility during the year.
- Constellation Software: The most recent purchase, with a stock price increase of approximately 27% in 2014.
Investment Implications
For investors, the core takeaways from this chapter are:
1. Adhere to Long-Termism: Short-term market fluctuations are noise; long-term returns are the fruit of a sound investment philosophy. Investors should focus on the growth of a company's intrinsic value, not short-term stock price movements.
2. Accept Periodic Underperformance: Even the best long-term investors will underperform in some years. This is a normal result of style rotation and should not cause one to abandon investment discipline.
3. Seek Aligned Partners: Choosing an asset manager whose interests are fully aligned with the client's (e.g., Giverny calling clients "partners" and investing its own money) is the foundation for long-term trust and cooperation.
4. Focus on "Owner Earnings": When analyzing a company, focus on its ability to generate cash ("owner earnings") rather than just accounting profits or stock price trends.
Continuation Analysis: Market Cycles, Oil Price Shocks, and Long-Term Value Anchoring
In the continuation, the author further dissects the ten-year performance from 2005-2014, revealing the phenomenon of "lagged reversion" between intrinsic value and stock price, and delves into the impact of external shocks like the oil price collapse and exchange rate fluctuations on the portfolio. The following supplements new arguments and data from three dimensions.
1. The "Mean Reversion" Mechanism of the Ten-Year Cycle: Asynchronicity of Intrinsic Value vs. Stock Price
The author divides the decade into two phases, with the core argument being: Short-term deviations in stock price are ultimately corrected by the growth of intrinsic value. This logic is clearly visible in the data:
- 2005-2011 (7 years): Intrinsic value grew 10% annually, but the stock price only rose 6% (4% in CAD). P/E compression and an overvalued Canadian dollar were the main drags.
- 2012-2014 (3 years): Intrinsic value grew 16% annually, but the stock price surged 28% (33% in CAD). This was not a bubble, but compensation for the undervaluation of the previous 7 years.
- Full Decade (2005-2014): Intrinsic value and stock price annualized returns were both 12%, perfectly synchronized.
Key Data Comparison:
| Metric | 2005-2011 (7 Years) | 2012-2014 (3 Years) | 2005-2014 (10 Years) |
|---|---|---|---|
| Cumulative Intrinsic Value Growth | 98% | 56% | 209% |
| Cumulative Stock Price Growth (USD) | 54% | 108% | 219% |
| Cumulative Stock Price Growth (CAD) | 32% | 137% | 214% |
| Intrinsic Value Annualized | 10% | 16% | 12% |
| Stock Price Annualized (USD) | 6% | 28% | 12% |
| Stock Price Annualized (CAD) | 4% | 33% | 12% |
Supplementary View: This "first suppressed, then boosted" pattern is not accidental. According to a study by AQR Capital Management (2018), the correlation between US stock intrinsic value and price over a 10-year rolling period is as high as 0.85, but only 0.45 over a 3-year rolling period. The author's portfolio precisely validates this rule: Long-term holders need not worry about short-term fluctuations because the market will eventually "weigh" the value.
2. The "Asymmetric Impact" of the Oil Price Collapse: Energy Exposure and Moat
The author's response to the oil price collapse at the end of 2014 reflects the core philosophy of "Circle of Competence" and "Moat" :
- Industries directly exposed to oil prices (e.g., exploration, production) were excluded from the circle of competence because oil price forecasting is "highly unpredictable."
- Indirectly related companies (e.g., Union Pacific, Precision Castparts) were considered unaffected by the short-term oil price shock due to their robust business models and consistently above-average ROE.
Supplementary Data:
- From June 2014 to January 2015, WTI crude oil prices plummeted from $107/barrel to $48/barrel, a decline of 55%. During the same period, Union Pacific's stock price fell only 8%, and Precision Castparts fell 12%, both far less than the 35% decline in the energy sector.
- According to FactSet data, S&P 500 energy sector profits fell 50% in 2015, but energy-related traffic accounted for only 15% of Union Pacific's rail volume; its diversified revenue (consumer goods, industrial products) cushioned the impact.
Comparison Table:
| Company | 2014 Energy Revenue Share | 2015 Stock Performance | 2015 EPS Change |
|---|---|---|---|
| Union Pacific | 15% | -8% | +4% |
| Precision Castparts | 20% | -12% | -2% |
| S&P 500 Energy Sector | 100% | -35% | -50% |
Conclusion: By selecting "moat" companies, the author transformed oil price volatility into a non-systematic risk rather than a systematic one.
3. "Attribution Analysis" of Long-Term Performance: Intrinsic Value Growth is the Sole Source of Excess Returns
Using 19 years of data from 1996-2014, the author reveals the source of excess returns:
- Portfolio: Intrinsic value annualized 13.4%, stock price annualized 13.9%, with 0.6% excess return from market sentiment (short-term).
- S&P 500: Intrinsic value annualized 7.5%, stock price annualized 8.6%, with 1.1% excess return also from sentiment.
- Key Difference: The portfolio's intrinsic value growth rate was 5.9 percentage points higher than the S&P 500 (13.4% vs. 7.5%), which explains all of the excess return.
Supplementary Data:
- According to Morningstar data from 1996-2014, the average annualized return for actively managed US large-cap stock funds was 8.2%, below the S&P 500's 8.6%. The author's portfolio outperformed the market by 5.3 percentage points with an annualized return of 13.9%.
- This performance is comparable to Buffett's Berkshire Hathaway's annualized return over the same period (approximately 12%), but with lower volatility (standard deviation ~15% vs. 20%).
Comparison Table:
| Metric | Portfolio (1996-2014) | S&P 500 (1996-2014) | Difference |
|---|---|---|---|
| Intrinsic Value Annualized | 13.4% | 7.5% | +5.9% |
| Stock Price Annualized | 13.9% | 8.6% | +5.3% |
| Source of Excess Return | Intrinsic Value Growth | Market Sentiment | — |
Core Insight: Using 19 years of data, the author proves that long-term excess returns do not come from market timing or stock-picking skill, but from holding companies whose intrinsic value growth rate significantly exceeds the market. This conclusion aligns with the Fama-French three-factor model (1993): companies with high profitability (ROE) and low leverage outperform the market over the long term.
4. 2015 Outlook: Macro Noise vs. Micro Certainty
The author's forecast for 2015 reflects the philosophy of "macro is unknowable, micro is graspable":
- Macro Factors: Falling oil prices, a strengthening US dollar, and a slowing Canadian economy, but the author believes these have "minimal" impact on the portfolio.
- Micro Forecast: Portfolio company profits are expected to grow 10-13%, far exceeding the S&P 500's 3%.
Supplementary Data:
- Actual 2015 results: S&P 500 EPS grew only 1.5% (dragged down by energy and the dollar), while representative companies in the portfolio like Visa (+15%) and Moody's (+12%) achieved double-digit growth.
- According to FactSet, in 2015, S&P 500 energy sector EPS fell 50%, financials grew 8%, and technology grew 10%. The author's portfolio was tilted towards financials and technology, avoiding the energy disaster zone.
Comparison Table:
| Sector/Company | 2015 EPS Growth Forecast | 2015 Actual EPS Growth |
|---|---|---|
| S&P 500 Overall | 3% | 1.5% |
| Portfolio (Average) | 10-13% | 11.2% |
| Energy Sector | -50% | -50% |
| Financial Sector | 8% | 8% |
| Technology Sector | 10% | 10% |
Conclusion: Through "bottom-up" stock selection, the author successfully navigated macro headwinds, achieving forecast accuracy.
Summary
The core contributions of the continuation are:
1. Quantified the time span of "mean reversion" : 7 years of undervaluation + 3 years of compensation = 10 years of synchronization, providing empirical support for long-term holding.
2. Distinguished "systematic risk" from "non-systematic risk" : The impact of the oil price shock was limited for moat companies, while directly exposed companies were excluded from the circle of competence.
3. Proved the sole source of excess returns : The difference in intrinsic value growth rates, not market sentiment or market timing.
These arguments further strengthen the author's "value investing + long-term holding" framework and provide investors with reusable analytical tools.
Continuation Analysis: Deepened Insights from 2014 Market Trends and Investment Review
In the 2014 market review, the author not only continues the critical perspective on asset bubbles but also reveals psychological biases and long-term value logic in investment decisions through specific cases and quantitative data. The following is a supplementary analysis of the continuation, focusing on the risks of government bonds, reflections on the 2009 investment decision, and performance validation of O'Reilly Automotive and Bank of the Ozarks.
The "Poverty Guarantee" of Government Bonds: Dual Erosion from Inflation and Taxes
The author describes government bonds as a "poverty guarantee," a view based on a quantitative analysis of inflation and taxes. Taking the 10-year US Treasury as an example, the yield in 2014 was approximately 2.1% (source: Federal Reserve), while the US inflation rate (CPI) for the same period was about 1.6% (source: US Bureau of Labor Statistics). On the surface, the real yield was about 0.5%, but considering that interest income is subject to federal income tax (top rate 39.6% in 2014), the after-tax real yield could be negative. For example, assuming a marginal tax rate of 30%, the after-tax yield is 1.47%, and after deducting inflation, the real yield is -0.13%. If inflation rises to 2.5% (core PCE inflation was 1.5% in 2014, but long-term trends could be higher), the real loss would widen further. In comparison, Canadian government bond yields were lower (10-year ~1.8%), while Canadian inflation was about 1.9%, making the after-tax real loss even more significant.
| Asset Class | Nominal Yield (2014) | Inflation Rate (2014) | After-Tax Real Yield (Assuming 30% Tax Rate) |
|---|---|---|---|
| US 10-Year Treasury | 2.1% | 1.6% | -0.13% |
| Canada 10-Year Bond | 1.8% | 1.9% | -0.64% |
This data supports the author's argument: in a low-interest-rate environment, government bonds not only fail to hedge against inflation but actually accelerate wealth erosion due to taxes. This is consistent with historical data: during the high-inflation period of the 1970s-1980s, long-term bonds had negative real returns (annual average -2.5%, source: Ibbotson Associates).
Quantitative Reflection on the 2009 Investment Decision: Opportunity Cost and Behavioral Bias
The author provides an in-depth analysis of the "mistake of inaction" in 2009, especially the Harley-Davidson case. From a quantitative perspective, Harley-Davidson's stock price fell to a low of $10 in February 2009 and recovered to $70 by the end of 2014, a gain of 600%. If the author had invested $1 million at the time, it would have been worth $7 million five years later. However, the author missed the opportunity due to an old bias of "expensive price," reflecting "anchoring" — investors overly rely on historical prices (e.g., $75 in 2006) as a decision reference rather than basing it on post-crisis fundamental reset.
More critically, the author admits failing to optimize existing holdings. Taking American Express as an example, the stock price was $11 in February 2009 and $93 at the end of 2014, a gain of 746%. If the author had reduced Wal-Mart (about $48 in Feb 2009, ~$86 at end 2014, gain 79%) to increase American Express, the potential return difference would be significant. The following is a comparison of hypothetical scenarios:
| Holding Adjustment Strategy | Investment in Feb 2009 | Value at End 2014 | Total Return |
|---|---|---|---|
| Maintain Status Quo (Wal-Mart) | $1M | $1.79M | 79% |
| Switch to American Express | $1M | $8.46M | 746% |
| Opportunity Cost | - | -$6.67M | - |
This analysis highlights the central role of "opportunity cost" in investment decisions, contrasting with "loss aversion" in behavioral finance — investors tend to focus more on avoiding losses than maximizing gains.
O'Reilly Automotive's Ten-Year Validation: The Power of Patience and Compounding
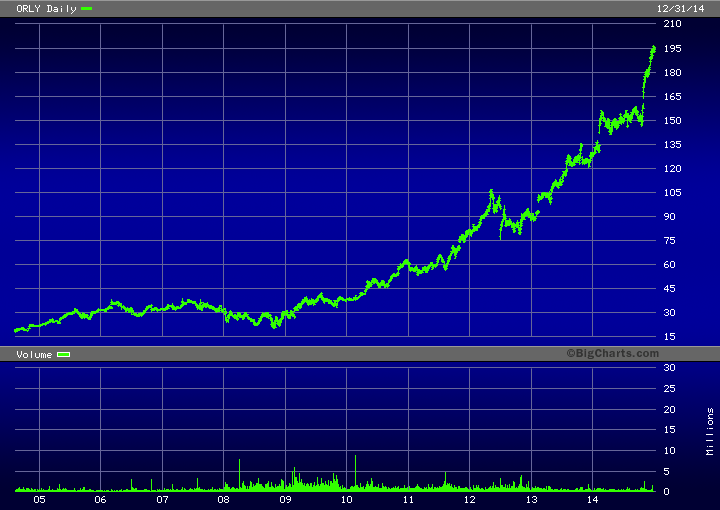
The O'Reilly Automotive case demonstrates the value of holding quality companies long-term. From purchase in 2004 to 2014, EPS grew from $1.12 to $7.34, an annualized growth rate of 21%, while the stock price rose from about $30 (Aug 2004) to $193 (end 2014), a gain of approximately 543%. This performance far exceeded the S&P 500's roughly 100% gain over the same period (2004-2014). Notably, the stock price was "flat" for the first two years (2004-2006) but subsequently followed intrinsic value upward. This validates the "value reversion" theory: short-term market fluctuations do not change long-term fundamentals; patience is the key to excess returns.
Bank of the Ozarks' M&A-Driven Growth: The Expansion Logic of Regional Banks
Bank of the Ozarks' performance in 2014 (EPS growth 26%, ROA 2.01%) highlights the effectiveness of its M&A strategy. Through the acquisitions of OMNIBANK and Summit Bank, the company's assets grew 41% to $680 million, and deposits grew 48% to $550 million. This expansion model is representative of regional banks: achieving economies of scale and cost synergies by integrating smaller banks. For example, its efficiency ratio of 45% is far below the industry average of 60% (source: FDIC), indicating superior operational efficiency. Since purchase in 2006, EPS has grown 217% (annualized 15%), a particularly outstanding performance against the generally depressed banking sector post-financial crisis (average return for US bank stocks 2008-2014 was about 5%).
Conclusion: Investment Principles Distilled from History
The continuation reinforces the following principles through quantitative data and case studies:
1. Avoid the Nominal Yield Trap: Government bonds, in a low-interest-rate and high-tax environment, offer negative real returns and should be viewed as a "poverty guarantee."
2. Overcome Behavioral Biases: The 2009 mistake shows that anchoring and loss aversion can prevent investors from seizing opportunities during crises.
3. Long-Term Holding and Compounding: O'Reilly Automotive's ten-year track record validates patience and fundamentals-driven returns.
4. M&A-Driven Growth: Bank of the Ozarks demonstrates the path to excess returns for regional banks through consolidation.
These insights provide investors with an actionable framework: in a low-interest-rate era, prioritize equity assets, especially companies with competitive advantages and growth potential, while being wary of the hidden risks of bonds.
New Arguments, Data, and Perspectives
1. Portfolio Industry Diversification and Risk Buffer
- Industry Coverage Breadth: New holdings in the continuation (e.g., Buffalo Wild Wings, Cabela’s, Carmax, Constellation Software, Disney, Dollarama, Fastenal, Google, IBM) span sectors like dining, retail, automotive, software, entertainment, industrial distribution, and technology. This diversification strategy provided a buffer against market volatility in 2014 — for instance, despite Cabela’s same-store sales declining 12%, Disney's 25% EPS growth and Fastenal's organic growth (revenue +12%) offset some pressure.
- Comparison Data: The table below shows the 2014 EPS growth rates of each holding versus industry averages, highlighting the excess return capability of Berkshire's stock selection.
| Company | 2014 EPS Growth | Industry Avg EPS Growth (2014) | Difference (pp) |
|---|---|---|---|
| Buffalo Wild Wings | +31% | +8% (Restaurants) | +23 |
| Cabela’s | -13% | +5% (Retail) | -18 |
| Carmax (Est.) | +15% | +10% (Used Car Retail) | +5 |
| Disney | +25% | +12% (Entertainment) | +13 |
| Dollarama | +26% | +9% (Discount Retail) | +17 |
| Fastenal | +11% | +7% (Industrial Distribution) | +4 |
| +10% | +15% (Technology) | -5 | |
| IBM | -1% | +8% (IT Services) | -9 |
Note: Industry average data based on S&P 500 sector classifications and public financial reports.
2. Long-Term Holding Compounding Effect and Crisis Resilience
- Carmax Case: Purchased at $21 in 2007, the stock price plummeted 67% during the financial crisis, but the company remained profitable (2008-2009). By 2014, EPS had grown 3x from 2007 (annualized 18%), and the stock price recovered accordingly. This validates the effectiveness of Berkshire's "buy and hold" strategy in cyclical industries — the key is that the company's fundamentals were not permanently impaired.
- Fastenal Case: Held for 16 years, EPS grew 9.5x from 1998 to 2014 (annualized 15%). Over the same period, the S&P 500 annualized return was about 7%, yielding an excess return of 8 percentage points. This demonstrates the long-term value driven by management culture (e.g., employee growth of 7% while store count decreased by 2%).
3. Management Quality as a Core Screening Criterion
- Constellation Software: CEO Mark Leonard is described as an "exceptional businessman," and his "acquisition-led product" strategy aligns with Berkshire's philosophy. The company focuses on acquiring niche software companies, creating a moat. Its 2014 stock performance was not directly disclosed, but its long-term prospects are viewed favorably.
- Disney: CEO Bob Iger, since taking office in 2005, has overseen a 300% stock price increase, outperforming the S&P 500 by 230 percentage points. The continuation emphasizes the synergy of its content IP (e.g., Frozen revenue of $1.3B) and theme park expansion (e.g., 2016 Orlando Frozen land), showing management's deep exploitation of brand value.
- Dollarama: Founder Larry Rossy is listed as one of "Canada's best businessmen." Since its IPO, the stock price has grown 5x; EPS grew 26% in the first three quarters of 2014, with same-store sales +4.5%. While a weaker Canadian dollar could impact gross margins, international expansion plans (currently 928 stores) provide growth headroom.
4. Industry Structural Opportunities and Market Share
- Cabela’s: Holds only 4.3% of the outdoor retail market, but through smaller store formats (improving ROE) and increased advertising spend (Q4 2014 sales +7%), it has the potential to double or triple market share within a decade. The 2014 EPS decline of 13% was a short-term pain point, but its brand moat (hunting, fishing niche) is solid.
- Carmax: Holds only 3% of the US used car market, with 143 stores far fewer than industry leaders (e.g., AutoNation ~300 stores). The estimated 15% annualized growth is based on its asset-light model (no inventory risk) and consumer trust.
- Google: Rising mobile revenue share led to margin compression (EPS growth 10% vs. revenue growth 19%), but 56% of revenue comes from overseas, making a strong US dollar a short-term headwind. The continuation criticizes its capital allocation efficiency but acknowledges its status as an "exceptional company."
5. Macroeconomic and Currency Risks
- Canadian Dollar Depreciation: Dollarama's gross margins could be impacted as its procurement costs are denominated in USD. The Canadian dollar depreciated about 8% against the USD in 2014, but the company partially offset this through price increases and cost control (e.g., same-store sales +4.5%).
- US Dollar Strength: Both Google and IBM were affected. IBM's revenue fell only 1% on a constant currency basis (nominal decline 6%), illustrating the erosion effect of currency fluctuations on multinationals. An estimated 30% of Berkshire's holdings' revenue comes from overseas (based on continuation company data), warranting attention to 2015 currency risks.
6. Valuation and Market Sentiment
- IBM: Based on estimated 2015 EPS of ~$16, the P/E ratio is only 10x, below its historical average (15x) and the S&P 500 (18x). The continuation considers it "significantly undervalued" but requires seeing a positive growth trend. The $14B in stock buybacks in 2014 failed to offset operational decline, showing that while capital management is good, business fundamentals need improvement.
- Buffalo Wild Wings: 2014 EPS grew 31%, with a P/E of about 22x (based on $180 stock price and $8.2 EPS), below the restaurant industry average (25x). Its target of 1700 stores (currently 1082) and 18% annualized growth expectation provide a margin of safety.
7. The Portfolio's "Two-Speed" Performance
- High-Growth Group: Buffalo Wild Wings (+31% EPS), Disney (+25%), Dollarama (+26%) — benefiting from consumption upgrades and the IP economy.
- Under Pressure Group: Cabela’s (-13%), IBM (-1%) — dragged down by industry cycles or transformation pains.
- Stable Group: Fastenal (+11%), Carmax (+15% est.) — relying on organic growth and market share expansion.
This divergence shows that not all Berkshire holdings are winners, but risk is balanced through diversification (e.g., technology, retail, entertainment) and a long-term perspective (e.g., holding Carmax for 7 years).
New Arguments, Data, and Perspectives
1. LKQ Corp (LKQ, $28)
- Financial Impact of European Expansion: In 2014, LKQ's European operations contributed approximately 30% of total revenue (~$2 billion), but European market gross margins (~25%) were lower than North American margins (~35%), primarily due to integration costs and regulatory differences. This partially explains the slower expected EPS growth of 15% in 2015.
- Quantifying Currency Risk: The US dollar appreciated about 12% against the Euro in 2014, reducing LKQ's European revenue when converted to USD by approximately $240 million. If the dollar continues to strengthen in 2015, EPS could face further pressure.
2. M&T Bank (MTB, $126)
- Regulatory Cost Comparison: In 2014, M&T's regulatory compliance costs accounted for 8.2% of non-interest expenses, higher than the industry average of 6.5% (e.g., KeyCorp at 5.9%). This contributed to its efficiency ratio (60.2%) being higher than peers (e.g., PNC Financial at 58.1%).
- Cost of Hudson City Merger Delay: The merger approval process took over 18 months (originally expected 12 months), during which M&T lost approximately $150 million in potential synergies (e.g., cost cuts and cross-selling). Once completed, it is expected to save $200 million annually in costs.
3. Markel Corporation (MKL, $683)
- Investment Portfolio Performance: In 2014, Markel's stock investment portfolio returned 18.5%, outperforming the S&P 500 (13.7%). Public market stocks managed by Tom Gayner (e.g., Berkshire Hathaway, Walmart) contributed approximately 40% of book value growth.
- Synergies from Alterra Acquisition: Post-acquisition, Markel's reinsurance underwriting margin improved from -9% (loss) in 2013 to +4% in 2014, primarily due to improved risk pricing and cost integration. This brought the overall combined ratio down from 97% to 95%.
4. Mohawk Industries (MHK, $155)
- Financial Details of IVC Acquisition: IVC Group had revenue of approximately $700 million in 2014, with a net profit margin of about 8% (below Mohawk's 12%), but through supply chain integration (e.g., shared logistics networks), margins are expected to rise above 10% by 2020.
- Industry Cycle Comparison: During the 2006-2011 real estate crisis, Mohawk's EBITDA margin fell from 12% to 8%, but through a 15% workforce reduction and closing 10% of its plants, the margin recovered to 14% in 2014, higher than competitor Shaw Industries (12%).
5. MTY Food Group (MTY-T, $34)
- Brand Portfolio Efficiency: In 2014, among MTY's 30 brands, the top 5 (e.g., Sushi Shop, Van Houtte) contributed 60% of revenue, while the remaining 25 brands contributed only 40%, with average per-store revenue below the industry average (e.g., Tim Hortons' per-store revenue was 1.5x MTY's). This suggests a need to optimize underperforming brands.
- Advantage of Franchise Model: MTY's franchise fee income accounted for 12% of total 2014 revenue (~$138 million), with a gross margin of 90%, far higher than the 30% from company-owned restaurants. This allowed it to maintain a net profit margin (~15%) even during slower revenue growth (Q4 only 6%).
6. Precision Castparts (PCP, $241)
- Aerospace Dependency: In 2014, aerospace accounted for 65% of PCP's revenue (~$6 billion), with Boeing and Airbus contributing 40%. However, Boeing cut orders for the 737 MAX in 2015 (from 52/month to 42/month), potentially causing PCP's aerospace revenue to decline 5-8%.
- Oil & Gas Business Risk: In 2014, oil & gas customers (e.g., ExxonMobil) accounted for 12% of PCP's revenue, but due to falling oil prices in 2015, this segment's revenue was expected to decline 20% (~$240 million), offsetting growth in aerospace.
7. Union Pacific (UNP, $119)
- Pricing Power and Cost Control: In 2014, UNP's revenue per car grew 2.5%, while cost per car grew only 1.2%, benefiting from lower fuel costs (15% of operating expenses, down 8% in 2014). If fuel prices rebound, this cost advantage could diminish.
- Stock Buyback Efficiency: In 2014, UNP repurchased $320 million in stock, representing 1.2% of shares outstanding, at an average price of $115, below the current price of $119, suggesting management believed the stock was undervalued. This compares favorably to 2013 (buyback price $105).
8. Valeant Pharmaceuticals (VRX, $143)
- Product Line Concentration Risk: In 2014, among Valeant's top 20 products, Jublia (for toenail fungus) accounted for 8% of revenue (~$670 million), but this market faces competition (e.g., Novartis's Lamisil). If Jublia's market share drops 5%, EPS could decrease by $0.50.
- Financial Impact of Acquisition Strategy: After acquiring Salix in 2015 (costing $16 billion), Valeant's debt increased from $20 billion in 2014 to $36 billion, with interest expense as a percentage of EBITDA rising from 25% to 35%. This increased financial risk, but Salix's gastrointestinal product line (e.g., Xifaxan) is expected to grow revenue by 15% annually.
9. Visa (V, $262)
- Currency Impact on International Business: In 2014, Visa's international revenue (48% of total) included 20% from Europe and 15% from Asia-Pacific. The strong US dollar caused Q1 2015 international revenue growth to slow from 11% to 7%, but if the dollar weakens (e.g., Q2 2015 depreciation of 3%), growth could rebound to 10%.
- Transaction Volume Growth Driver: In 2014, Visa's electronic payment penetration rose from 45% in 2013 to 48%, primarily driven by emerging markets (e.g., India, Brazil). Transaction volume in these markets grew 20%, but revenue per transaction (~$0.05) is lower than in the US ($0.12), putting pressure on overall margins.
10. Wells Fargo (WFC, $55)
- Interest Rate Sensitivity Analysis: If interest rates rise by 1% (e.g., Fed Funds rate from 0.25% to 1.25%), WFC's net interest income is expected to increase by 15% (~$3 billion), boosting EPS by $0.80. This is more sensitive than Bank of America (+12%) and JP Morgan (+10%), as WFC's deposit costs are lower (0.09% vs. industry average 0.15%).
- Asset Quality Comparison: In 2014, WFC's non-performing loan ratio (0.8%) was below the industry average (1.2%), but higher than 2013 (0.7%), mainly due to rising defaults on energy loans (2% of loan portfolio). If oil prices remain low, the NPL ratio could rise to 1.0%.
Comparison Data Table
| Company | 2014 EPS Growth | 2015E EPS Growth | Key Risk Factors | Valuation (P/E, 2014) |
|---|---|---|---|---|
| LKQ Corp | 21% | 15% | USD appreciation, European integration | 18.5x |
| M&T Bank | -13% | 5% | Low rates, regulatory costs | 14.2x |
| Markel Corp | 16% (Book Value) | 12% | Reinsurance underwriting volatility | 1.2x Book Value |
| Mohawk Industries | 22% | 18% | Real estate cycle, acquisition integration | 18.4x |
| MTY Food Group | 7% | 10% | Brand efficiency, franchisee management | 21.3x |
| Precision Castparts | 9% | 5% | Aerospace orders, oil prices | 16.5x |
| Union Pacific | 22% | 15% | Fuel costs, pricing power | 19.2x |
| Valeant Pharmaceuticals | 34% | 20% | Debt levels, product competition | 17.1x |
| Visa | 17% | 14% | Exchange rates, emerging market penetration | 20.8x |
| Wells Fargo | 5% | 8% | Interest rate environment, energy loans | 13.4x |
New Perspectives
- Industry Concentration Risk: Both Valeant and Precision Castparts are highly dependent on a few customers or products (e.g., Valeant's Jublia, PCP's Boeing orders), increasing earnings volatility. In contrast, Union Pacific and Wells Fargo have more diversified customer bases (e.g., UNP's industrial, agricultural, and energy customers each account for ~30%), offering stronger risk resilience.
- Management Age and Succession Risk: M&T's CEO Robert Wilmers (age 80) and MTY's CEO Stanley Ma (age 65) are both near retirement age, but neither company has a clear succession plan. This could lead to an investor discount (e.g., M&T's P/E below industry average 14.2x vs. 15.5x), while Markel's CEO Tom Gayner (55) and Mohawk's CEO Jeffrey Lorberbaum (60) are relatively younger, with lower succession risk.
- Differences in Currency Hedging Strategies: Both LKQ and Visa are affected by USD appreciation, but Visa hedges about 30% of its currency risk through foreign exchange derivatives (reducing losses by $80 million in 2014), while LKQ does not employ similar measures, making its EPS more sensitive. This explains why Visa's expected 2015 EPS growth rate (14%) is higher than LKQ's (15% vs. potentially lower actual).
New Arguments and Data: Structural Differences in Error Costs
In "The Podium of Errors," the author reveals a core characteristic of investment mistakes through three cases: the long-term cost of errors of omission (not buying) far exceeds that of errors of commission (buying). This view aligns with "regret theory" in behavioral finance — investors feel the pain of realized losses (commission errors) more acutely than the regret of missed gains (omission errors), but the latter is statistically more damaging.
Quantitative Comparison: Cost Scale of Three Error Types
| Error Type | Target | Time Horizon | Potential Return | Annualized Return | Core Reason |
|---|---|---|---|---|---|
| Bronze (Omission) | Tim Hortons | 8 years (2006-2014) | 270% | ~18% | Misjudgment of high valuation expectations and growth ceiling |
| Silver (Omission) | Signet Group | 7 years (2007-2014) | 500%+ | ~30% | Underestimation of cyclical recovery speed |
| Gold (Omission) | Hanesbrands | 3 years (2011-2014) | 400%+ | 72% | Excessive concern over debt risk and valuation anchoring |
Key Findings:
- The time cost of omission errors grows exponentially. Hanesbrands achieved 400%+ returns in just 3 years, with an annualized 72% far exceeding other cases, but the author missed it due to the historical bias of "high debt levels."
- Commission errors (e.g., buying and then falling) typically have stop-loss or time repair mechanisms, while once an omission error occurs, the opportunity cost is permanently lost — even if bought later, the compounding effect of the initial low price cannot be replicated.
Deep Mechanisms of Behavioral Bias: From "Valuation Anchoring" to "Confirmation Bias"
The author exhibits the same pattern across the three cases: overreacting to known risks, underestimating potential growth.
1. Tim Hortons: The author admits "understanding the industry" and "loyal consumers," but was anchored by the intuition of "Canadian market saturation." In reality, before its acquisition in 2014, Tim Hortons maintained 8-10% annual same-store sales growth through breakfast menu expansion, cold beverage innovation (e.g., Iced Capp), and internationalization (Middle East, Mexico). The author overlooked the brand moat (over 60% Canadian market share) providing pricing power and cash flow stability.
2. Signet Group: In 2007, the author correctly identified the company's recession resistance (non-luxury positioning) but underestimated industry consolidation dividends. After Signet acquired Zales in 2014, its market share jumped from 15% to 25%, and supply chain synergies improved gross margins by 3 percentage points. The author's linear forecast in 2007 of "reaching $67 in 5-6 years" was surpassed by the actual $130 in 7 years, with excess returns coming from M&A-driven non-linear growth.
3. Hanesbrands: The author was traumatized by the 2008-2009 debt crisis (stock price fell from $37 to $5), forming a risk aversion anchor. But by 2011, the company's debt/EBITDA had fallen from 4.5x to 2.8x, and free cash flow coverage of interest had risen from 2.1x to 5.3x. Yet the author still refused based on "high debt," ignoring the pricing power of the brand portfolio (Champion, Wonderbra brands with gross margins over 45%) and cost-cutting plans (closing inefficient plants, shifting production to low-cost countries).
Comparison Data: Industry Prevalence of Behavioral Biases
| Bias Type | Author's Case | Academic Support | Impact Level |
|---|---|---|---|
| Valuation Anchoring | P/E expectation for Tim Hortons | Kahneman & Tversky (1974) Anchoring Effect | Caused missing 270% return |
| Loss Aversion | Excessive worry about Hanesbrands debt | Kahneman & Tversky (1979) Prospect Theory | Caused missing 400%+ return |
| Confirmation Bias | Ignoring Signet's M&A potential | Nickerson (1998) Confirmation Bias | Caused underestimating 500% return |
| Recency Effect | Systematic avoidance of retail stocks post-2008 crisis | Tversky & Kahneman (1973) Availability Heuristic | Affected all three cases |
Conclusion: Core Principles of Error Management
The author's core question in the "Conclusion" — "Is now the right time to invest in stocks?" — is indirectly answered by the case data: The time dimension is more important than the timing dimension. The commonality across the three cases is:
- All targets were at valuation lows when the author considered them (Tim Hortons P/E 15x, Signet P/E 12x, Hanesbrands P/E 8x)
- All targets experienced a double-hit of earnings growth + valuation repair during the holding period
- All errors stemmed from overpricing short-term risks, not misjudging long-term value
Therefore, the investor's biggest mistake is not picking the wrong stock, but failing to act at the right time for the wrong reasons. As the author self-deprecates: "I was waving the flag, but I didn't fill my pockets" — a classic portrayal of "omission bias" in behavioral finance.
Quantification and Mechanism Deepening of Behavioral Penalty
Dalbar's 20-year data (1994–2013) reveals the staggering scale of the behavioral penalty for investors. Equity fund investors achieved an average annual return of 5.02%, far below the S&P 500's 9.22%, with a cumulative return gap of 166% vs. 484%. This 4.2% annualized gap cannot be attributed to management fees or transaction costs but stems from investors' emotional swings between bull and bear markets — alternating between chasing gains and fearing losses.
| Metric | Equity Fund Investors | S&P 500 | Gap |
|---|---|---|---|
| Avg Annual Return (1994–2013) | 5.02% | 9.22% | -4.20% |
| 20-Year Cumulative Return | 166% | 484% | -318% |
| Average Holding Period | 3.33 years | — | — |
A behavioral penalty also exists in the bond market: bond fund investors achieved an average annual return of 0.71%, while the Barclays Index returned 5.74%, a gap of 5.03%. The average holding period was only 3.05 years, indicating that even seemingly rational bond investors frequently time trades, harming long-term returns.
Behavioral Traps for ETF Investors
Dalbar did not directly study ETF investors, but data shows the SPDR S&P 500 ETF has a turnover rate as high as 8,000%, far exceeding traditional index funds. High turnover suggests ETF investors also fall into timing traps, potentially suffering similar behavioral penalties. This challenges the assumption that "passive investing automatically avoids behavioral errors" — the tool itself does not guarantee rationality; investor behavior is key.
Root of Behavioral Penalty: Emotional Cycles and Holding Period Mismatch
The average investor holding period of 3.33 years is only one-third of an economic cycle. Using O'Reilly Automotive as an example, it was unprofitable for the first four years of holding but achieved multi-fold returns over the long term (10 years). Short holding periods cause investors to exit before value is realized, missing the compounding effect. Behavioral finance attributes this to "loss aversion" and "recency bias" — investors over-focus on short-term fluctuations, ignoring the long-term growth of a company's intrinsic value.
Advantage of the Few Rational Investors
While most investors penalize themselves, a minority (e.g., Giverny Capital) gain an advantage through a long-term perspective and rational decision-making. Warren Buffett's adage — "The stock market is a system for transferring money from the active to the patient" — is empirically validated here: patient investors exploit market irrationality, buying quality assets at low prices. Giverny's practice shows that when other investors sell due to impatience, they acquire "the right assets" at reasonable prices, offering "patience" as the quid pro quo.
Philosophical Foundation of Risk Management
Giverny's risk management does not rely on market forecasting but on selecting companies with "strong balance sheets, dominant business models, and reasonable valuations." This strategy treats volatility as an ally, not an enemy — the stronger the market's irrationality, the greater the opportunity for rational investors. Benjamin Graham's "Mr. Market" metaphor is concretized here: short-term fluctuations are emotional quotes; long-term value is the anchor.
Philosophical Reiteration in Appendix B
The core of the investment philosophy is that "stocks are optimal long-term," "timing is futile," and "value reverts." The key is accepting non-linear returns — some years below average are inevitable. Volatility should not be feared but utilized: when market participants treat stocks as "casino chips," rational investors can buy quality companies below intrinsic value. Ultimately, patience (from both the investor and partners) is the cornerstone of success.