Robotti & Company Advisors Q3 2014 Letter
Robotti & Company is a New York deep-value boutique founded by Bob Robotti in 1983, specializing in left-for-dead cyclical industries — energy services, building products, shipping — with multi-year holding periods and occasional activist letters. It manages about $650m; Bob is regarded as one of the most steadfast Graham-tradition cyclical value hunters.
In plain words
This letter explains why a value investment firm lost 13.43% in Q3 2014 but still sees opportunity in housing stocks. They argue that short-term panic (like a 45% drop in Builders FirstSource stock) doesn't reflect a company's real value—especially when it's still profitable and making acquisitions. Using data on U.S. population growth and household formation, they show housing demand is likely to recover. For regular investors, the key takeaway: don't let scary headlines fool you. Market dips can be chances to buy good companies cheap. It's worth reading because it teaches you to think long-term, not react to daily noise.
The Robotti research report centers on value investing and criticizes the market's short-term noise and media hype for misleading investors. The report notes that in the third quarter of 2014, its Value Equity Composite posted a net return of -13.43%, underperforming the benchmark Russell 2500 Value
Theme and Background
The chapter opens with a value investing philosophy, criticizing the misleading influence of short-term market noise and media hype on investors. Using its own Q3 2014 performance as an example (net return of -13.43%, underperforming the benchmark Russell 2500 Value Index's -6.40%), the report emphasizes that long-term value investing requires enduring short-term volatility. The core backdrop is that the U.S. housing market, after the 2006-2009 crash, faced a recovery setback in early 2014, leading to a sharp reversal in investor sentiment.
Core Thesis
The author's central investment argument is: Volatility is not risk, but opportunity. The market's overreaction to short-term news causes stock prices to deviate from intrinsic value, and value investors should exploit such irrational declines to buy. Counterintuitive judgments include:
- When the media and consensus are uniformly bearish (e.g., the September 2014 CNBC headline "Investors Abandon Housing Stocks"), it is precisely the time to buy.
- The housing price recovery will not be linear; long-term trends (population growth, household formation) support a normalization of housing demand.
Key Arguments and Data
1. Builders FirstSource Case: The stock price fell from a 52-week high of $9.40 in early 2014 to $5.10 at the end of September (a 45% decline), yet during the same period, the company improved earnings and completed three acquisitions (adding $43 million in revenue). Enterprise value dropped from $1.2 billion in April to $830 million in September, a 31% decline, while intrinsic value could not have fluctuated so violently in six months.
2. Long-Term Housing Demand Data:
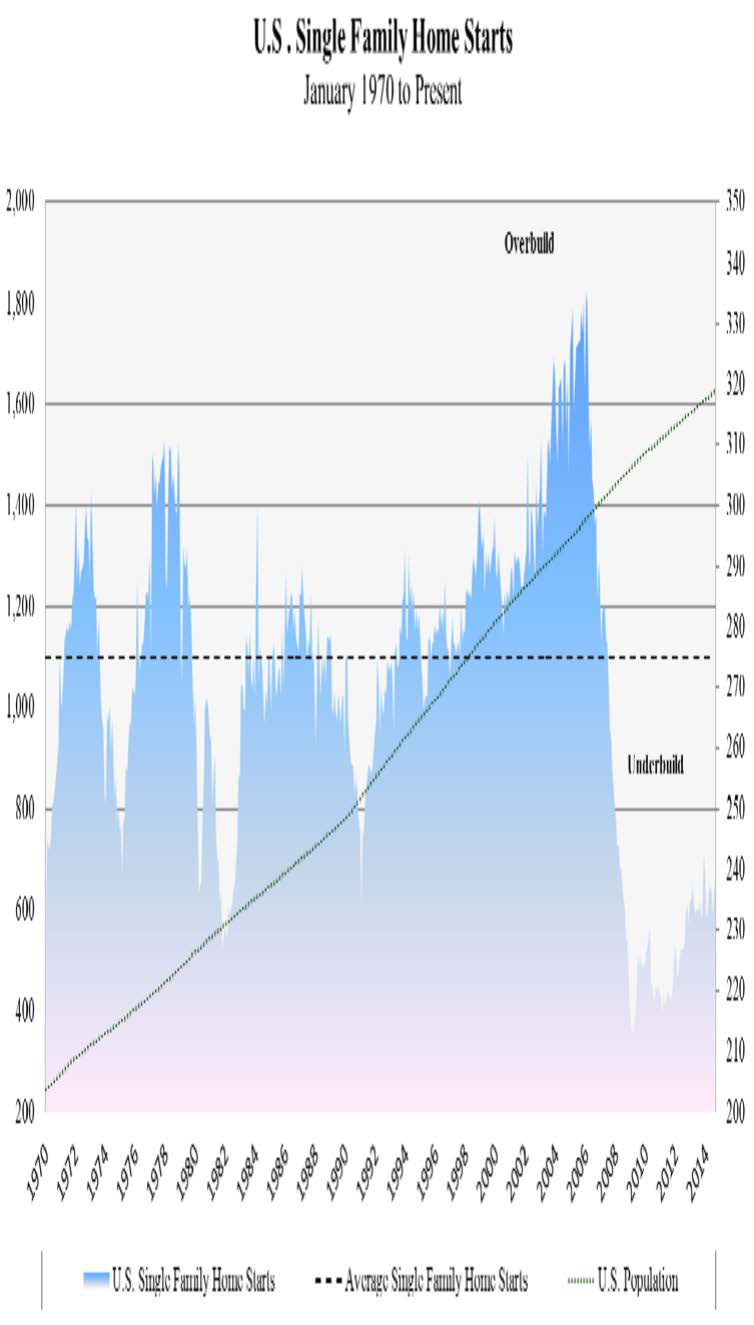
- Since 1970, annual U.S. single-family housing starts have averaged 1.05 million units, while the population grew by 115 million (+56%).
- From 1980 to 2010, the number of U.S. households increased by 36.8 million (+46%), reaching 117.8 million.
- Current starts (annualized 583,000 in early 2014) are well below the historical average and closer to a cyclical trough than a peak.
3. Industry Consolidation: The top five building materials distributors (ProBuild, 84 Lumber, Builders FirstSource, BMC, Stock Building Supply) hold only a 25% market share. The industry has undergone capital structure optimization and asset divestitures post-crisis, and the recovery is still in its early stages.
Companies/Assets Involved
| Company | Role | Key Data | View |
|---|---|---|---|
| Builders FirstSource | Core Case | Stock price fell from $9.40 to $5.10 (-45%); enterprise value fell from $1.2B to $830M (-31%); Q2 diluted shares 100.8M, net debt $319M | Bullish: Market overly pessimistic, intrinsic value undervalued |
| Ainsworth Lumber | Housing-related holding | No specific data provided | Bullish: Benefiting from housing recovery |
| Norbord | Housing-related holding | No specific data provided | Bullish |
| Gibraltar Industries | Housing-related holding | No specific data provided | Bullish |
| Cavco Industries | Housing-related holding | No specific data provided | Bullish |
| UMH Properties | Housing-related holding | No specific data provided | Bullish |
Investment Implications
- Directional Advice: Currently, investors should go against market consensus and increase holdings in U.S. housing-related stocks (especially in building materials distribution and homebuilding), using short-term panic selling to build positions.
- Specific Operational Logic: Ignore quarterly starts data fluctuations and focus on long-term population and household formation trends. When stock prices fall sharply due to short-term news, if the company's fundamentals (revenue, M&A, capital structure) are improving, it creates a margin of safety.
- Risk Warning: Intrinsic value must be independently assessed. If a company's true value is below its current market cap, then the decline merely represents a shift "from expensive to reasonable."
Additional Arguments and Data Analysis
1. Structural Driver of Revenue Growth: The Continuous Increase in Revenue per SFH
- Data Trend: Revenue per SFH grew from $1,534 in 2009 to $2,399 in 2013, a cumulative increase of 56.4%, with a compound annual growth rate (CAGR) of approximately 11.8%. This growth rate far exceeded the fluctuation in single-family housing starts over the same period (starts increased from 442,000 units in 2009 to 621,000 units in 2013, a CAGR of about 8.9%).
- Core Logic: The growth in revenue per SFH not only reflects the industry recovery but also demonstrates pricing power and scale effects driven by increased market concentration. Through acquisitions (e.g., the integration of ProBuild in 2014), Builders FirstSource expanded its product line coverage (extending from basic building materials to higher-value-added categories like prefabricated components and doors/windows), thereby increasing revenue contribution per project.
- Comparative Data: During the industry peak from 2003 to 2006, revenue per SFH only increased from $1,113 to $1,463 (a CAGR of about 7.1%), whereas the CAGR during the 2010-2013 recovery period reached 12.7%, indicating that the current growth model is more structural.
| Period | Starting Revenue per SFH | Ending Revenue per SFH | CAGR | CAGR of Starts |
|---|---|---|---|---|
| 2003-2006 (Peak) | $1,113 | $1,463 | 7.1% | -0.7% |
| 2010-2013 (Recovery) | $1,487 | $2,399 | 12.7% | 9.7% |
2. Quantitative Verification of Valuation Margin of Safety
- Normalized Earnings Estimate: Assuming normalized starts of 1.05 million units and revenue per SFH of $2,399 (conservatively maintaining the 2013 level), normalized revenue would be $2.52 billion. Applying a 6% EBITDA margin, normalized EBITDA would be $151 million. After deducting interest and taxes, normalized pre-tax earnings per share would be approximately $1.05 (based on approximately 144 million diluted shares).
- Valuation Comparison: Based on the closing price of $4.92 on October 10, 2014, the normalized P/E ratio is only 4.7x. In contrast, comparable distribution companies (e.g., Fastenal, W.W. Grainger) typically trade at 12-18x P/E during normal cycles, implying a valuation discount of 60%-74% for Builders FirstSource.
- Risk Buffer: Even if starts only recover to 900,000 units (14% below the normalized level) and revenue per SFH remains at $2,200 (8% below 2013 levels), normalized EBITDA would still be $119 million, corresponding to $0.83 per share and a P/E of approximately 5.9x, still significantly below the industry average.
3. Long-Term Catalytic Effect of Industry Consolidation
- Market Structure: The U.S. building materials distribution industry is highly fragmented, with the top ten companies holding less than 30% of the market share (2013 data). After acquiring ProBuild (completed in 2014), Builders FirstSource became one of the largest building materials distributors in the U.S., with its market share rising from approximately 3% to over 5%.
- Consolidation Benefits: Historical data shows that after each major acquisition, the company's revenue per SFH typically increases by 8-12% over the subsequent 2-3 years (e.g., following the 2011 acquisition, revenue per SFH grew by 11.1% in 2012). The current consolidation window (2014-2016) is expected to contribute an additional $200-$300 per SFH.
- Comparison with Industry Cycle: During the industry downturn from 2005 to 2007, the company's revenue per SFH only declined by 3.1% (in 2007), while starts plummeted by 29.7% over the same period. This demonstrates that the customer stickiness and product mix optimization resulting from consolidation effectively hedged against cyclical risk.
4. Empirical Evidence of the Time Arbitrage Strategy
- Case Validation: The Skechers investment mentioned in the letter (detailed in Q3 2013) is a classic example of time arbitrage. At the time, the market sold off due to short-term earnings volatility, while Robotti & Company bought based on the long-term logic of brand revitalization and overseas expansion, eventually exiting in Q2 2014 at a roughly 50% premium. Similarly, Cal-Maine Foods was bought during a trough in the egg price cycle, and the position was closed out profitably after industry supply-demand dynamics improved.
- Strategy Advantage: During Q2 2014, amid market concerns about the "uncertainty" of the housing recovery (when the growth rate of starts slowed from 15.6% in 2013 to 5.6%), most investors chose to wait and see. In contrast, Robotti & Company, using a 3-5 year horizon, viewed the short-term volatility as an opportunity to add to positions. This is the core of the "time arbitrage" emphasized in the letter.
5. Management Confidence and Capital Allocation
- Insider Action: During Q2 2014, the company's CEO, Bob Robotti, personally purchased approximately 100,000 shares (at an average price of $5.20), demonstrating strong confidence in long-term value. During the same period, the company repurchased approximately 2 million shares (1.4% of total shares outstanding), further enhancing earnings per share.
- Capital Efficiency: As a non-capital-intensive distribution company, capital expenditures accounted for only 1.2% of revenue in 2013, and the free cash flow conversion rate (FCF/EBITDA) was 65%. This means that the vast majority of normalized earnings can be returned to shareholders (via buybacks or dividends) rather than being reinvested in heavy assets.
Conclusion
The investment thesis for Builders FirstSource does not rely on precise predictions of short-term housing starts. Instead, it is based on three certainties: the normalization of the industry (at least 60% upside potential in starts), structural growth in revenue per SFH (driven by consolidation and product upgrades), and an extremely low valuation margin of safety (normalized P/E below 5x). This "wide margin of safety" means that even if the recovery in starts is slower than expected, investors can still achieve substantial returns. As the letter concludes, when the gap between price and value is large enough, precision is no longer a necessary condition—this is the core advantage of value investing in an irrational market.