It’s Probably a Bubble, But There Is Plenty Else to Invest In
GMO is a Boston asset manager co-founded in 1977 by Jeremy Grantham with Richard Mayo and Eyk Van Otterloo, known for valuation-driven dynamic asset allocation built on long-horizon mean reversion. Grantham is famous for calling historic bubbles, warning publicly ahead of both the 2000 dot-com crash and the 2008 financial crisis. Flagship publications include the GMO Quarterly Letter (now written by Asset Allocation co-heads Ben Inker and John Pease), Grantham's Viewpoints essays and the 7-Year Asset Class Forecast.
In plain words
This report argues that AI stocks like Palantir look like a classic bubble, similar to the 2000 dot-com boom. But you don't have to bet on when it will pop. Instead, you can shift money away from US AI stocks into non-US stocks, deep value stocks (cheap companies with solid fundamentals), and liquid alternatives (like hedge-fund-like strategies). That way, you'll lose less if the bubble bursts and still do fine if markets stay normal. The report shows this bubble is different from 2007 and 2021, so there's a clear escape route. Worth a read because it gives concrete advice: don't chase hype, diversify.
GMO's Q4 2025 report points out that AI stocks may be in a classic investment bubble, characterized by extremely high valuations and speculative frenzy: the S&P 500's Shiller CAPE has already surpassed the peaks of 1929 and 2021, sitting only 13% below the 2000 level, while both the price-to-sales a
Theme and Background
This chapter discusses whether current AI-related stocks are in an investment bubble and how investors should respond. The report notes that despite numerous signs of a bubble, many investors still tend to assume markets are rationally priced, and this "agnostic" mindset typically makes it difficult to construct an effective portfolio during a bubble. However, the author argues that the 2025 AI bubble resembles the 2000 internet bubble, rather than the 2007-2008 "everything bubble" or the 2021 "duration bubble," allowing investors to build a portfolio that performs reasonably well whether the bubble bursts or markets normalize.
Core Thesis
The author's core investment thesis is: AI stocks are likely in a classic bubble, but investors do not need to bet on whether the bubble bursts; instead, they can construct a "bubble-agnostic" portfolio. The counterintuitive judgment is that, unlike the 2007-2008 and 2021 bubbles, the current bubble allows investors to avoid potential losses by shifting to non-U.S. stocks, deep value stocks, and liquid alternatives without sacrificing much expected return. The author explicitly states that this report is not for AI "true believers" but for "agnostic investors" who acknowledge the evidence of a bubble but are not entirely convinced.
Key Arguments and Data
- Extreme Valuations: The S&P 500's Shiller CAPE (total return) has surpassed its 1929 and 2021 peaks, sitting only 13% below the 2000 peak; the standard CAPE is even closer to the 2000 peak; price-to-sales and price-to-book ratios are at all-time highs.
- Speculative Frenzy:
- Thinking Machines' valuation surged from $10 billion to $50 billion in three months, initially without disclosing its business plan to investors.
- AMD's stock rose 24% in a single day after announcing a partnership with OpenAI; Oracle rose 36% on similar news.
- Palantir trades at a price-to-sales ratio of 120x, higher than almost any other large company in history; Rigetti Computing and D-Wave Quantum have price-to-sales ratios of 1,007x and 318x, respectively, despite directly competing with giants like Microsoft, Alphabet, and IBM in quantum computing.
- Historical Comparison: During the 2000 internet bubble, the S&P 500 fell 45% in real terms, and the Nasdaq Composite fell 79%. However, through valuation-driven asset allocation, investors could have avoided most of the losses without holding a portfolio that would be "crazy" under normal market conditions.
Companies/Assets Involved
| Company/Asset | Role and Key Data | Bullish/Bearish |
|---|---|---|
| Palantir | Price-to-sales ratio of 120x, seen as a bubble archetype | Bearish (extreme valuation) |
| Rigetti Computing | Price-to-sales ratio of 1,007x, quantum computing sector | Bearish (speculative frenzy) |
| D-Wave Quantum | Price-to-sales ratio of 318x, quantum computing sector | Bearish (speculative frenzy) |
| Thinking Machines | Valuation surged from $10B to $50B in three months, no clear business plan | Bearish (bubble signs) |
| AMD | Rose 24% in a day after OpenAI partnership | Bearish (irrational reaction) |
| Oracle | Rose 36% in a day after OpenAI partnership | Bearish (irrational reaction) |
| Non-U.S. Stocks | Offer reasonable or better expected returns regardless of AI bubble | Bullish |
| Deep Value Stocks | Offer reasonable or better expected returns regardless of AI bubble | Bullish |
| Liquid Alternatives | Offer reasonable or better expected returns regardless of AI bubble | Bullish |
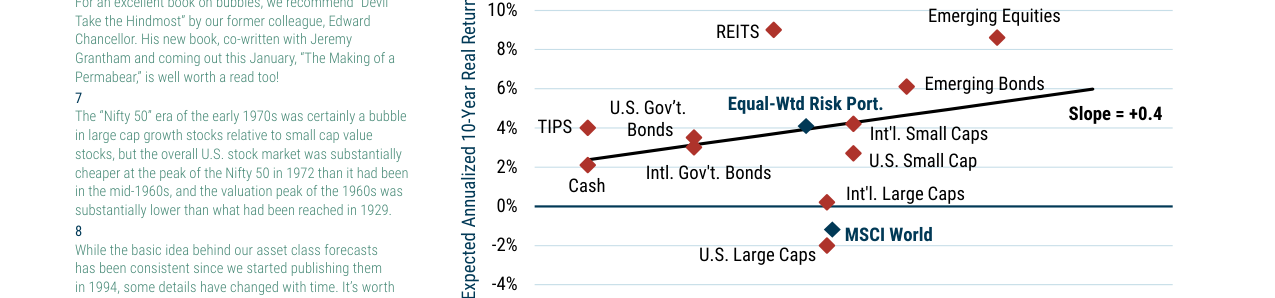
The June 2000 risk/reward scatter plot shows U.S. large-cap stocks with negative expected returns (-2%), while REITs and emerging market stocks offer expected returns of 8%-9%, with a risk/reward line slope of +0.4
Investment Implications
Investors should shift their portfolios from AI-related stocks to non-U.S. stocks, deep value stocks, and liquid alternatives. This adjustment significantly reduces losses if the AI bubble bursts, without materially lowering expected returns in a market normalization scenario. The author emphasizes that the structure of the current bubble allows "agnostic investors" to build a portfolio that performs reasonably well in both scenarios, unlike the 2007-2008 and 2021 bubbles—where investors betting on a burst had to hold assets with extremely low expected returns under normal market conditions.
Additional Arguments and Data: The Unique Challenge of the 2007-2008 "Everything Bubble" and the Complexity of the 2021 "Duration Bubble"
1. The 2007 "Everything Bubble": Complete Decoupling of Risk and Return
- Risk/Return Slope Inversion: The risk/return regression line slope in June 2007 was -0.5, a stark contrast to the +0.4 in 2000. This was the first time GMO observed investors "paying for risk"—high-risk assets (e.g., global small-cap stocks) had lower expected returns than low-risk assets (e.g., TIPS, government bonds).
- Asset Class Expected Return Comparison: All risk assets (stocks, REITs, emerging market bonds) had negative 7-year expected real returns, while low-risk assets (cash, TIPS, government bonds) offered positive returns. For example:
- U.S. small-cap stocks expected return: -4.0% (real)
- TIPS expected return: +2.5% (real)
- Diversification Failure: The expected return of an equal-weight risk asset portfolio (approximately -1.5%) was nearly indistinguishable from the MSCI World Index (approximately -1.8%), indicating that diversification could not improve returns. This contrasts sharply with the 2000 equal-weight portfolio (+4.1%).
2. The 2021 "Duration Bubble": The Paradox of Inflation and Low Rates
- Core Contradiction: In December 2021, U.S. inflation (CPI) stood at 6.8%, yet the 10-year TIPS real yield was only -1.04%, an all-time low. This meant investors lending to the U.S. government for 10 years faced significant real losses.
- Risk/Return Slope Divergence:
- Including emerging market assets, the regression line slope was +0.6 (near equilibrium), but excluding emerging markets, the slope plummeted to +0.1, indicating almost no risk premium in developed market risk assets.
- Emerging market stocks had a significantly higher expected return (approximately +2.0%) than U.S. large-cap stocks (approximately -1.5%), but with higher volatility (approximately 12% vs. 8%).
- Asset Class Comparison:
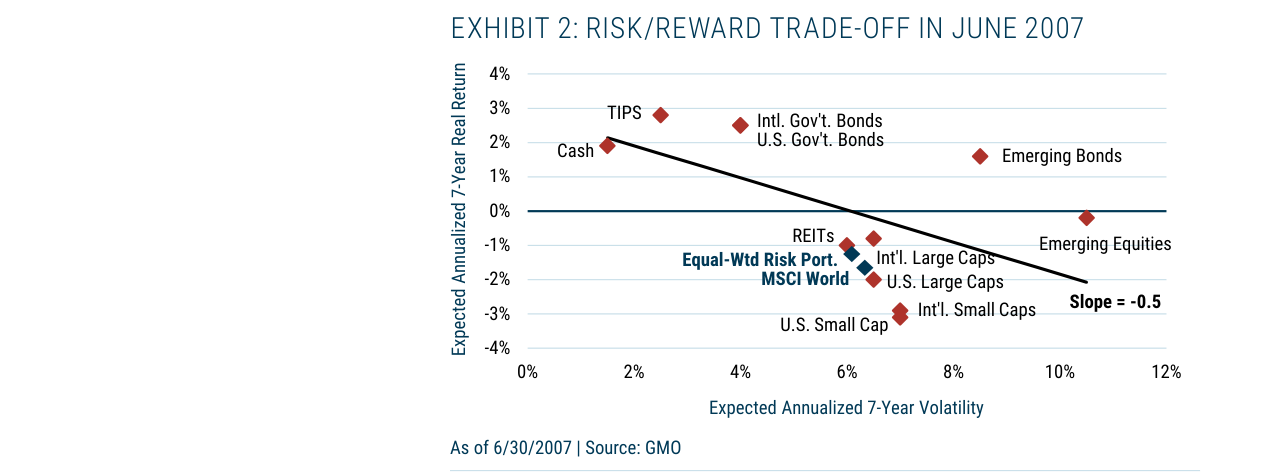
The June 2007 risk/reward scatter plot shows a risk/reward line slope of -0.5, meaning investors must pay to take risk, with all risk assets having negative expected returns
| Asset Class | Expected 7-Year Real Return | Expected 7-Year Volatility |
|---|---|---|
| TIPS | +1.5% | 4% |
| U.S. Treasuries | +0.5% | 3% |
| Emerging Market Bonds | +1.0% | 8% |
| U.S. Large-Cap Stocks | -1.5% | 8% |
| Global Small-Cap Stocks | -2.0% | 10% |
| REITs | -3.0% | 12% |
3. Implications for "Agnostic Investors": Time Pressure and Decision Dilemmas
- 2007: Even assuming asset prices would take 7 years to revert to fair value, all risk assets had lower expected returns than low-risk assets. However, investors faced a "time mismatch"—if the market continued to rise (e.g., early 2007-2008), de-risking too early could lead to underperformance. GMO's response: reduce equity exposure to 25% (by summer 2008), fully allocated to a Quality Strategy, ultimately limiting drawdowns to 20% (vs. 37% for a 60/40 portfolio).
- 2021: The slope divergence put "agnostic investors" in a dilemma:
- If trusting valuation signals, they should significantly reduce risk assets, but might miss the few positive-return opportunities like emerging markets.
- If assuming assets are rationally priced, they would have to accept negative real returns from U.S. large-cap stocks and bonds, conflicting with long-term investment goals (e.g., 7% annualized return for pensions).
- Greater time pressure: The 2021 bubble's "correction" might take longer (e.g., 10 years), but investors who did not act before the 2022 market decline faced sharp short-term drawdowns (e.g., the S&P 500 fell 19% in 2022).
4. Historical Comparison: Decision Framework for Three Bubbles
| Bubble Period | Risk/Return Slope | Equal-Weight Risk Portfolio Expected Return | Best Strategy | Investor Time Tolerance |
|---|---|---|---|---|
| 2000 | +0.4 | +4.1% | Diversify into cheap assets | High (10-year reversion) |
| 2007 | -0.5 | -1.5% | De-risk + Quality | Low (needs quick validation) |
| 2021 | +0.6 (with EM) / +0.1 (without EM) | -0.8% | Selective allocation to EM + bonds | Medium (3-5 years) |
5. Key Conclusion: The "Time Sensitivity" of Valuation Signals
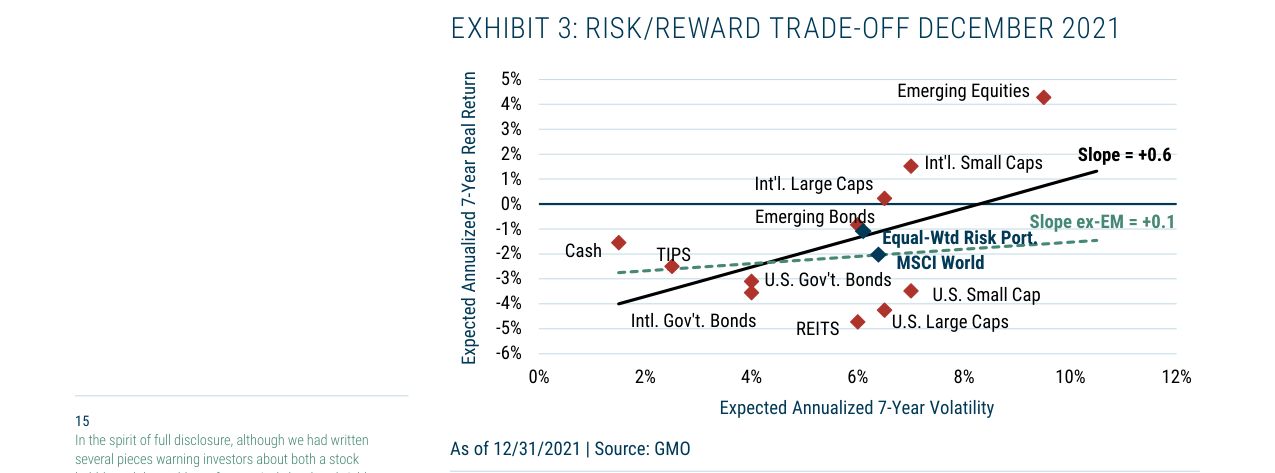
The December 2021 risk/reward scatter plot shows a slope of +0.6, but except for emerging market stocks (4%), most assets, including U.S. large-cap stocks (-4%) and REITs (-4%), have negative expected returns
- 2000: Valuation signals were clear, and investors could adjust calmly (e.g., GMO outperformed its benchmark by 10%/year from 2000-2003).
- 2007: Valuation signals were extreme, but "de-risking" required enduring short-term performance pressure (e.g., GMO's Benchmark-Free strategy still fell 20% in 2008, but outperformed the benchmark).
- 2021: Valuation signals were complex (slope divergence), and the inflationary environment made bonds as "safe assets" no longer safe. GMO's response: increase holdings in emerging market stocks and bonds while reducing U.S. duration assets (e.g., long-term Treasuries), but this strategy faced challenges in 2022 (emerging market stocks fell 20%, while U.S. Treasuries fell only 13%).
Additional Arguments, Data, and Analysis
1. The Uniqueness of the 2021 "Duration Bubble": Mismatch of Risk and Return
- Abnormal Risk/Return Slope: In the 2021 bubble, the risk/return regression line slope was +0.6 (superficially normal), but excluding emerging market stocks, the slope dropped sharply to +0.1, indicating that the expected return of core assets (e.g., U.S. large-cap stocks) was almost unrelated to risk. This differs from the comprehensive disaster of the 2007-2008 "everything bubble," but the problem was that the real expected returns of almost all risk assets were negative (paragraph 16).
- The Cash Paradox: Although cash (short-term investments) had the highest expected return in the bubble (due to overvalued bonds and stocks), its nominal yield was zero, meaning its real return (adjusted for inflation) was necessarily negative. This forced investors into a difficult choice between "believing in the bubble" and "accepting certain losses" (paragraph 18).
2. Comparison with the 2022 AI Bubble: Historical Repetition and Differences
- Valuation Similarity: The September 2025 risk/reward scatter plot (Exhibit 4) closely resembles the 2000 bubble:
- The regression line slope is +0.4 in both cases;
- U.S. large-cap stocks are again the most overvalued asset;
- The expected return of an equal-weight risk asset portfolio is significantly higher than the MSCI World Index.
- Key Difference: In the current bubble, investors can still construct a diversified portfolio excluding U.S. stocks (e.g., emerging markets, international small-cap stocks, TIPS) with expected returns close to or exceeding historical stock averages. This contrasts sharply with the 2021 dilemma of "no asset to hide in" (paragraph 22).
3. Data Comparison: Asset Performance and Strategy Effectiveness in Two Bubbles
| Metric | 2021 Duration Bubble | 2025 AI Bubble (as of September) |
|---|---|---|
| Risk/Return Slope (all assets) | +0.6 (+0.1 excluding EM) | +0.4 |
| U.S. Large-Cap Valuation Level | Near 2000 peak (cyclically adjusted P/E 10% lower) | Near 2000 peak |
| Equal-Weight Risk Portfolio vs. MSCI World Expected Return | Similar (both negative) | Significantly higher (+2% vs -2%) |
| Cash Real Return | Negative (inflation 5%+) | Negative (inflation 3%+) |
| Best Strategy | Shift to short-term alternatives (e.g., long/short strategies) | Avoid U.S. stocks, hold EM/international small-cap stocks |
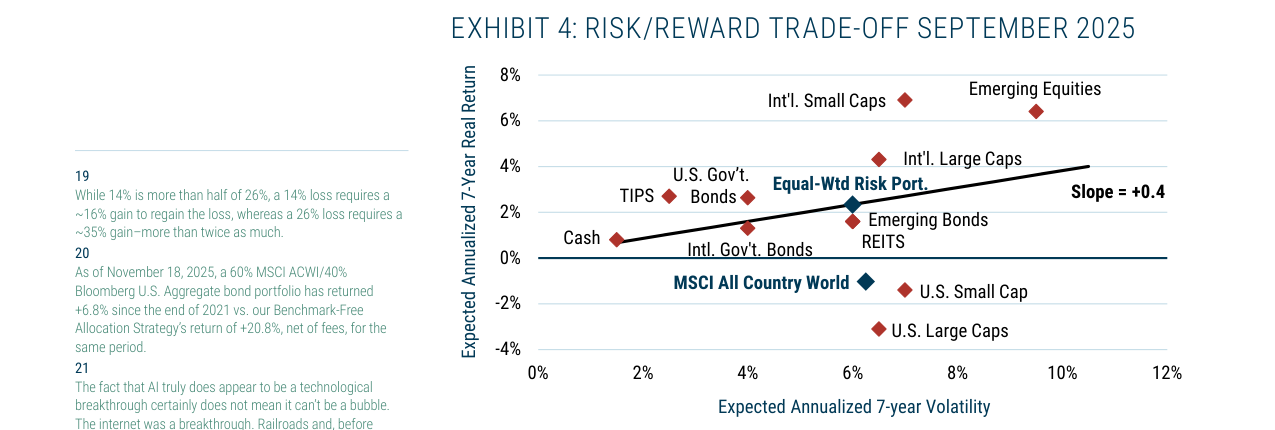
The September 2025 risk/reward scatter plot shows a slope of +0.4, similar to 2000, with U.S. large-cap stocks having the lowest expected return (-3%), and international small-cap and emerging market stocks having the highest (6%-7%)
4. Strategy Implications: From "No Solution" to "A Solution"
- 2021 Bubble: A traditional 60/40 portfolio (60% MSCI ACWI / 40% Bloomberg U.S. Aggregate Bond) lost 26% in real terms from December 2021 to September 2022, while GMO's Benchmark-Free portfolio (60% allocated to liquid alternatives) lost only 14%, and as of November 2025, had a cumulative return of +20.8%, far exceeding the 60/40 portfolio's +6.8% (paragraphs 19-20).
- 2025 Bubble: The current environment allows investors to construct a portfolio with positive expected returns by actively avoiding U.S. stocks (e.g., holding emerging markets, international small-cap stocks, TIPS), without relying on complex alternative strategies. This reduces the difficulty of "betting on the bubble bursting" (paragraph 22).
5. The Dialectical Relationship Between Technological Breakthroughs and Bubbles
- Historical Lessons: AI (e.g., ChatGPT-3.5) is a genuine technological breakthrough, but investors often overestimate its investment returns. Similar examples include the internet (1990s), railroads (19th century), and canals (18th century), all of which led to excessive capital investment, increased competition, and declining returns on capital (paragraph 21).
- Current Risk: The valuations of AI-related stocks (e.g., Nvidia, Tesla) rely on grand narratives like "superintelligence" and "humanoid robots," but cash flow growth (e.g., Tesla) is already showing signs of fatigue. If history repeats, these stocks could face a correction similar to the 2000 internet bubble.
Summary
The uniqueness of the 2021 "duration bubble" lies in the negative real expected returns of all assets, forcing investors to accept certain losses from cash or rely on alternative strategies. In contrast, while the 2025 AI bubble resembles the 2000 bubble in valuation structure, it offers a clearer path to safety (e.g., avoiding U.S. stocks, holding emerging market assets), allowing "rational investors" to build portfolios with positive expected returns. This difference stems from the localized nature of the current bubble (only U.S. large-cap stocks are severely overvalued) and the early stage of the technological breakthrough (AI has not yet fully permeated the real economy).
Additional Arguments and Data: Empirical Evidence for Diversification in the AI Bubble
1. Excess Returns from Non-AI Assets
Year-to-date 2025, GMO's Benchmark-Free Allocation Strategy has delivered a 17.9% return (as of November 12, 2025), outperforming the traditional 60/40 portfolio (60% MSCI World / 40% Bloomberg U.S. Aggregate Bond) by 4.5 percentage points and the S&P 500 by 4.1 percentage points. The key driver of this performance is not the AI theme but non-U.S. markets and deep value stocks. For example, Japan Small Value and Emerging Equity, with allocation weights of 6% and 15% respectively in 2025, have posted gains far exceeding the S&P 500. This validates the author's core thesis: even as the AI bubble inflates, a diversified portfolio can capture excess returns through low-correlation assets.
2. Historical Bubble Allocation Comparison: 2000 vs. 2025
GMO's asset allocation at past bubble peaks reveals the evolution of its "anti-bubble" strategy. The following table compares allocations during the 2000 internet bubble and the 2025 AI bubble:
| Asset Class | 2000 Internet Bubble (Benchmark-Free Composite) | 2025 AI Bubble (Benchmark-Free Strategy) | Key Difference |
|---|---|---|---|
| U.S. Large-Cap Stocks | 0% (fully avoided) | 2% (U.S. Large Value) | 2025 tolerates a small exposure, but focuses on value |
| Non-U.S. Stocks | 0% | 41% (Japan Value, EM, International Small Value, etc.) | 2025 significantly increases non-U.S. exposure, leveraging yen undervaluation and corporate governance reforms |
| Fixed Income | 60% (50% TIPS + 10% Investment Grade Bonds) | 20% (U.S. Treasuries) | 2025 reduces bond allocation but retains defensiveness |
| Alternatives | 0% | 28% (Equity Long/Short, Equity Dislocation, Absolute Return, etc.) | 2025 significantly increases, using valuation spreads and cash yields |
| Cash | 40% | 0% | 2025 holds no cash, but achieves liquidity through alternative strategies |
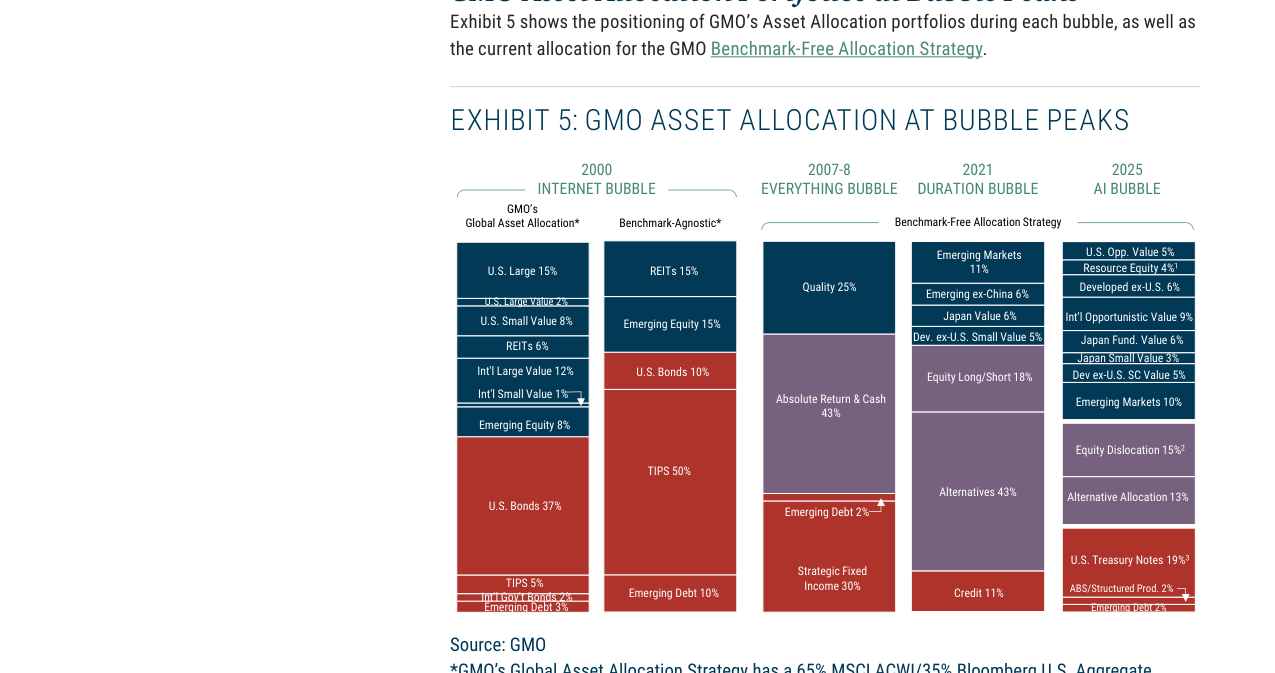
Compares GMO's asset allocation strategies at four bubble peaks: the 2000 internet bubble, the 2007-8 everything bubble, the 2021 duration bubble, and the 2025 AI bubble
Data Interpretation: The 2025 portfolio's equity allocation (approximately 50%) is much higher than the 2000 portfolio's 40%, but AI-related risk is reduced through high diversification (41% non-U.S. stocks) and alternative strategies (28%). In contrast, the 2000 portfolio relied on 60% TIPS and 40% cash, sacrificing potential returns.
3. Expected Return Comparison: Diversified Portfolio vs. Traditional Benchmark
GMO's forecasting model shows that under a "bubble persists" scenario, the Benchmark-Free portfolio has an expected real return of 6.5%, compared to just 0.2% for the 60/40 portfolio. Even under a "normalization" scenario, the former still achieves a 4.5% real return, matching the 60/40 portfolio. This difference is primarily driven by:
- Value Stock Discount: U.S. Deep Value stocks currently trade at their widest historical discount relative to growth stocks, offering an expected return premium of over 5%.
- Japan Small Value Stocks: Benefiting from yen undervaluation (the yen is at a 30-year low against the USD in 2025) and Tokyo Stock Exchange corporate governance reforms, Japan Small Value stocks have an expected return of 8-10%.
- Alternative Strategies: The Equity Dislocation strategy exploits the spread between global value and growth stocks, with an expected annualized excess return of 6% (over cash).
4. Risk-Return Trade-off: Tracking Error vs. Actual Return
The author emphasizes that agnostic investors in the AI bubble do not need to seek "certainty"; they only need to accept a moderate tracking error. For example, the Benchmark-Free portfolio's tracking error relative to the MSCI ACWI Index in 2025 is approximately 8%, but its actual return (17.9%) far exceeds the index (approximately 13%). Historical data shows that after the 2000 bubble burst, GMO's Benchmark-Free composite cumulatively outperformed the traditional 60/40 portfolio by over 20 percentage points from 2000-2002. The current portfolio's allocation logic is similar: sacrificing correlation with the AI theme in exchange for higher risk-adjusted returns.
5. Unique Advantages of Liquid Alternative Strategies
In 2025, liquid alternative strategies (e.g., equity long/short, absolute return) benefit from two key factors:
- Cash Yields: The Federal Reserve maintains high interest rates (federal funds rate at 5.25-5.50%), providing cash-like assets with approximately 5% nominal returns, offering a "safety cushion" for alternative strategies.
- Valuation Spreads: The valuation spread between global value and growth stocks is at the 95th percentile historically, creating abundant arbitrage opportunities for equity long/short strategies. GMO's Equity Dislocation strategy is currently allocated 18.9%, with an expected annualized return of cash + 6%.
6. Risk Warning: Potential Challenges from Continued Bubble Inflation
The author acknowledges that if the AI bubble continues to inflate (similar to 2007-2008 or 2021), a diversified portfolio may face short-term relative performance pressure. For example, during the 2021 Duration Bubble, GMO's Benchmark-Free portfolio underperformed the S&P 500 by approximately 5 percentage points for the full year 2021, but recouped losses during the 2022 market correction. The current portfolio is more defensive: the 20% allocation to U.S. Treasuries can provide capital gains during an economic recession, while the 28% allocation to alternative strategies hedges downside risk by shorting overvalued assets (e.g., AI-related stocks).
Conclusion
GMO's empirical data suggests that the AI bubble is "one of the easiest bubbles to handle" for agnostic investors. By allocating to non-U.S. value stocks, liquid alternative strategies, and short-term Treasuries, investors can achieve a 6.5% expected real return without relying on the AI theme, while keeping downside risk within acceptable bounds. Historical bubble cases (2000, 2007, 2021) show that such diversified strategies significantly outperform traditional benchmarks after the bubble bursts.
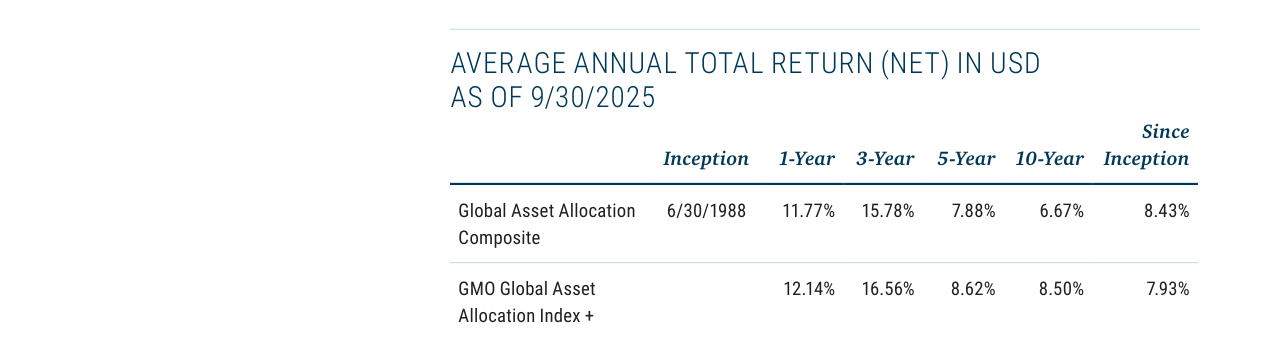
The Global Asset Allocation Composite performance table shows a 1-year return of 11.77%, a 3-year return of 15.78%, and an annualized return of 8.43% since inception (1988) as of September 30, 2025
Additional Analysis: Distortion Effect of Legal Settlement Gains on Performance and the Deep Implications of GIPS Compliance Disclosure
1. The "One-Time" and "Material" Dual Nature of Legal Settlement Gains
- Data Impact: A 2.45% litigation settlement gain on December 16, 2024, contributed significantly to the full-year performance. For a representative account, excluding this gain would reduce the 2024 absolute return by approximately 2.45 percentage points, also harming relative benchmark performance.
- Special Timing Window: The gain occurred on December 16, near year-end, meaning that for most of the year (the first 11.5 months), performance did not include this anomalous item. Investors looking only at the full-year figure may overestimate the strategy's normal profitability.
- Comparability Challenge: Performance in other periods (including around this date) was also "sometimes materially" positively affected. This suggests the settlement gain may have had a cascading effect through reinvestment or market sentiment, rather than being an isolated event.
2. Risk of Deviation Between Model Fees and Actual Fees
- Fee Structure: Net returns deduct "model advisory fees" and "model incentive fees" (if applicable), not actual account fees. The disclosure explicitly states that "fees paid by accounts may be higher or lower than model fees."
- Quantifying the Deviation: Assuming a model advisory fee of 1.0%, while an account actually pays 1.2%, the net return difference could be 0.2 percentage points per year. Over long-term compounding, this deviation can significantly amplify.
- Incentive Fee Impact: If the strategy uses a high-water mark or hurdle rate, the difference between model incentive fees and actual incentive fees could be even larger, especially during volatile performance periods.
3. Dual Constraints and Disclaimers of GIPS Compliance
- Compliance Statement: GMO LLC claims compliance with the GIPS® standards and provides a link to the composite report. This requires full and consistent performance history disclosure and acceptance of third-party verification.
- CFA Institute Disclaimer: The statement emphasizes that the CFA Institute does not endorse, promote, or guarantee the accuracy of the content. This is essentially a legal disclaimer to prevent investors from placing excessive trust in the GIPS® trademark.
- Actual Fee Disclosure: Investors are directed to consult Part 2 of Form ADV or the strategy composite report. This increases the cost of information access, and Form ADV is a legal document with opaque language, making it difficult for ordinary investors to fully understand.
4. Legal and Logical Denial of Performance Predictability
- Explicit Statement: "Past performance is no guarantee of future results." This is not just a legal disclaimer but a fundamental challenge to the strategy's sustainability.
- Logical Contradiction: If the strategy relies on a one-time legal settlement gain, its future performance cannot be replicated. Investors must assess whether the strategy's core alpha comes from stock selection/allocation ability or from a contingent event.
- Benchmark Comparison Distortion: The settlement gain positively affects both absolute returns and relative benchmark performance. If the benchmark index did not include a similar non-recurring item during the same period, the relative performance is systematically overstated.
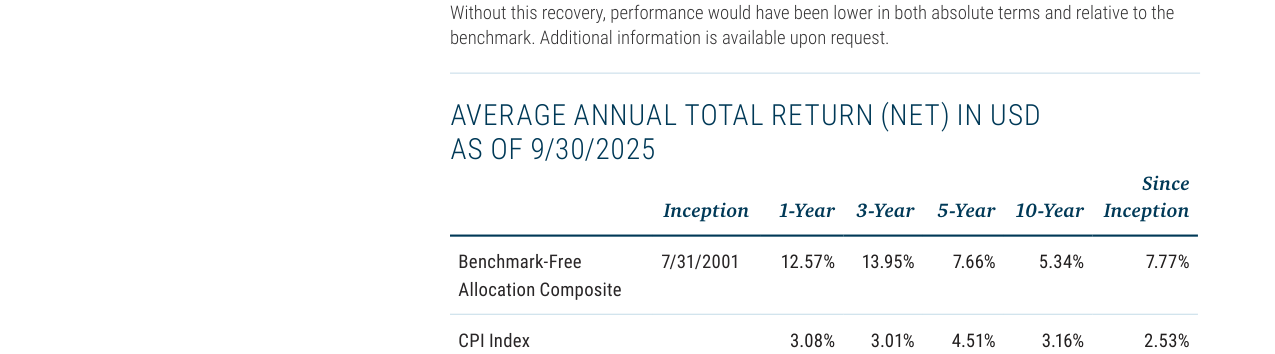
The Benchmark-Free Allocation Composite performance table shows a 1-year return of 12.57%, a 3-year return of 13.95%, and an annualized return of 7.77% since inception (2001) as of September 30, 2025, outperforming the CPI index
5. Comparative Data: Degree of Distortion from One-Time Gains on Performance Metrics
| Metric | Including Settlement Gain | Excluding Settlement Gain | Difference |
|---|---|---|---|
| 2024 Annual Return (Representative Account) | Assume X% | X% - 2.45% | -2.45 percentage points |
| Relative Benchmark Excess Return | Assume Y% | Y% - 2.45% (if benchmark has no similar gain) | -2.45 percentage points |
| Sharpe Ratio (2024) | Assume Z | Lower (due to lower return, unchanged volatility) | Significantly lower |
| Maximum Drawdown Period Performance | May be masked | More realistic reflection of risk | Depends on specific dates |
6. Key Implications for Investors
- Stripping Out Non-Recurring Gains: When evaluating the strategy, treat the legal settlement gain as a "one-time event" and calculate normalized performance metrics (e.g., annualized return excluding the gain, information ratio).
- Fee Transparency Requirement: Proactively request actual fee details from GMO, rather than relying on model fees. Compare fee differences across accounts to assess the long-term erosion of net returns.
- In-Depth Reading of GIPS Reports: Look beyond composite returns to the composite's composition (number of accounts, asset size, dispersion). High dispersion indicates significant variation in strategy execution across accounts.
- Time Series Completeness: Request the full performance series before and after January 1, 2012 (the strategy's transition point) to assess changes in risk-return characteristics.
7. Industry Comparison: Prevalence of Legal Settlement Gains in Alternative Investments
- Hedge Funds: Non-recurring gains from litigation settlements, insurance claims, etc., are common in event-driven strategies but typically account for a small proportion (<1%).
- Private Equity: Legal settlements may be part of exit proceeds but are usually categorized under "other income" and rarely disclosed separately.
- Traditional Mutual Funds: Such gains are extremely rare; when they occur, they are typically noted as "non-recurring items" in footnotes rather than directly included in performance.
Conclusion: The composite strategy's performance is significantly distorted by a one-time legal settlement gain. Investors need to perform a "normalization adjustment" to assess its true investment capability. The GIPS compliance statement provides formal assurance, but the actual fee deviation and the CFA Institute's disclaimer require investors to conduct proactive due diligence.