American Unexceptionalism
GMO is a Boston asset manager co-founded in 1977 by Jeremy Grantham with Richard Mayo and Eyk Van Otterloo, known for valuation-driven dynamic asset allocation built on long-horizon mean reversion. Grantham is famous for calling historic bubbles, warning publicly ahead of both the 2000 dot-com crash and the 2008 financial crisis. Flagship publications include the GMO Quarterly Letter (now written by Asset Allocation co-heads Ben Inker and John Pease), Grantham's Viewpoints essays and the 7-Year Asset Class Forecast.
In plain words
This report explains that the S&P 500's 15-year outperformance was driven by a handful of tech giants (like Apple, Nvidia) plus a strong dollar and rising valuations—not broad corporate strength. Now most U.S. companies show mediocre earnings growth, yet trade at high prices. Meanwhile, the U.S. is hurting itself with tariffs, immigration crackdowns, and policy uncertainty, making long-term investing harder. For ordinary investors, don’t blindly bet on U.S. stocks just because they did well. Consider international markets (Europe, Japan) with lower valuations and better prospects. Worth reading because it challenges the consensus and helps you avoid overpaying for hype.
GMO’s Q3 2025 letter, The End of American Exceptionalism, argues that investors widely believe the S&P 500 possesses inherent superiority, yet this conviction stems primarily from the exceptional performance of large-cap tech stocks over the past 15 years, rather than fundamental growth across the e
Theme and Background
This chapter, as the opening of the report, directly challenges the prevailing market consensus of optimism toward U.S. equities (especially the S&P 500). The author points out that investors take the strong performance of the U.S. economy and stock market over the past 15 years for granted, and consequently believe in the inherent superiority of the S&P 500. However, this belief may lack sustained fundamental support.
Core Thesis
The author's central judgment is: The S&P 500's cumulative excess return of 150% over global markets in the past 15 years was not driven by the fundamental superiority of the entire index, but entirely by a handful of mega-cap tech stocks. Investors who continue to bet on U.S. equities due to past mistakes are making a dangerous decision rooted in regret. The counterintuitive point is: the author admits that systematically underweighting U.S. equities over the past 15 years was a mistake, but argues that one should not simply flip positions out of regret; instead, a deep analysis of the sources of excess returns is necessary.
Key Arguments and Data
- Data Comparison: The S&P 500 has outperformed the MSCI World ex-USA (developed markets excluding the U.S.) by 150% cumulatively over the past 15 years.
- Logical Decomposition: The author plans to decompose the relative returns into three components (not elaborated in this chapter, but setting the stage for subsequent analysis):
1. Fundamental growth (revenue and earnings)
2. Valuation changes (price-to-earnings multiples)
3. Currency effects
- Critique of Market Consensus: Investors generally assume that U.S. stocks offer long-term annualized returns of 9%-12%, while overseas markets (China "terrible," Europe "uninspiring") carry higher risks. However, the author questions whether this consensus is grounded in fundamental facts.
Companies/Assets Involved
- S&P 500: The core subject of analysis, noted for its overall performance being distorted by a few mega-cap tech stocks (i.e., the "Magnificent Six" to be analyzed in later chapters).
- MSCI World ex-USA: Used as a benchmark for comparison, representing developed markets outside the U.S.
- China and European Markets: Commonly viewed by the market as underperformers, but the author hints they may be undervalued.
Investment Implications
- Do not blindly chase U.S. stocks out of regret: The excess returns of the past 15 years came mainly from a few tech stocks, not the entire index. Investors should distinguish between "good companies" and "good stocks."
- Reassess global allocation: If non-tech stocks in the S&P 500 do not show strong fundamentals yet still command valuation premiums, investors currently overweight U.S. equities should consider reducing positions and shifting to overseas markets with lower valuations and growth potential not fully priced in.
- Watch for subsequent decomposition analysis: The author will break down the sustainability of U.S. equity excess returns in later chapters through the three factors of fundamentals, valuation, and currency. Investors should wait for the full analysis before making decisions.
Theme and Background
This chapter focuses on the fundamental performance of U.S. equities (represented by the S&P 500) relative to other global developed markets (MSCI World ex-USA). The report challenges the widely held investor belief that U.S. companies consistently lead in fundamental growth, pointing out that this advantage has significantly diminished over the past decade and is primarily driven by a handful of mega-cap companies.
Core Thesis
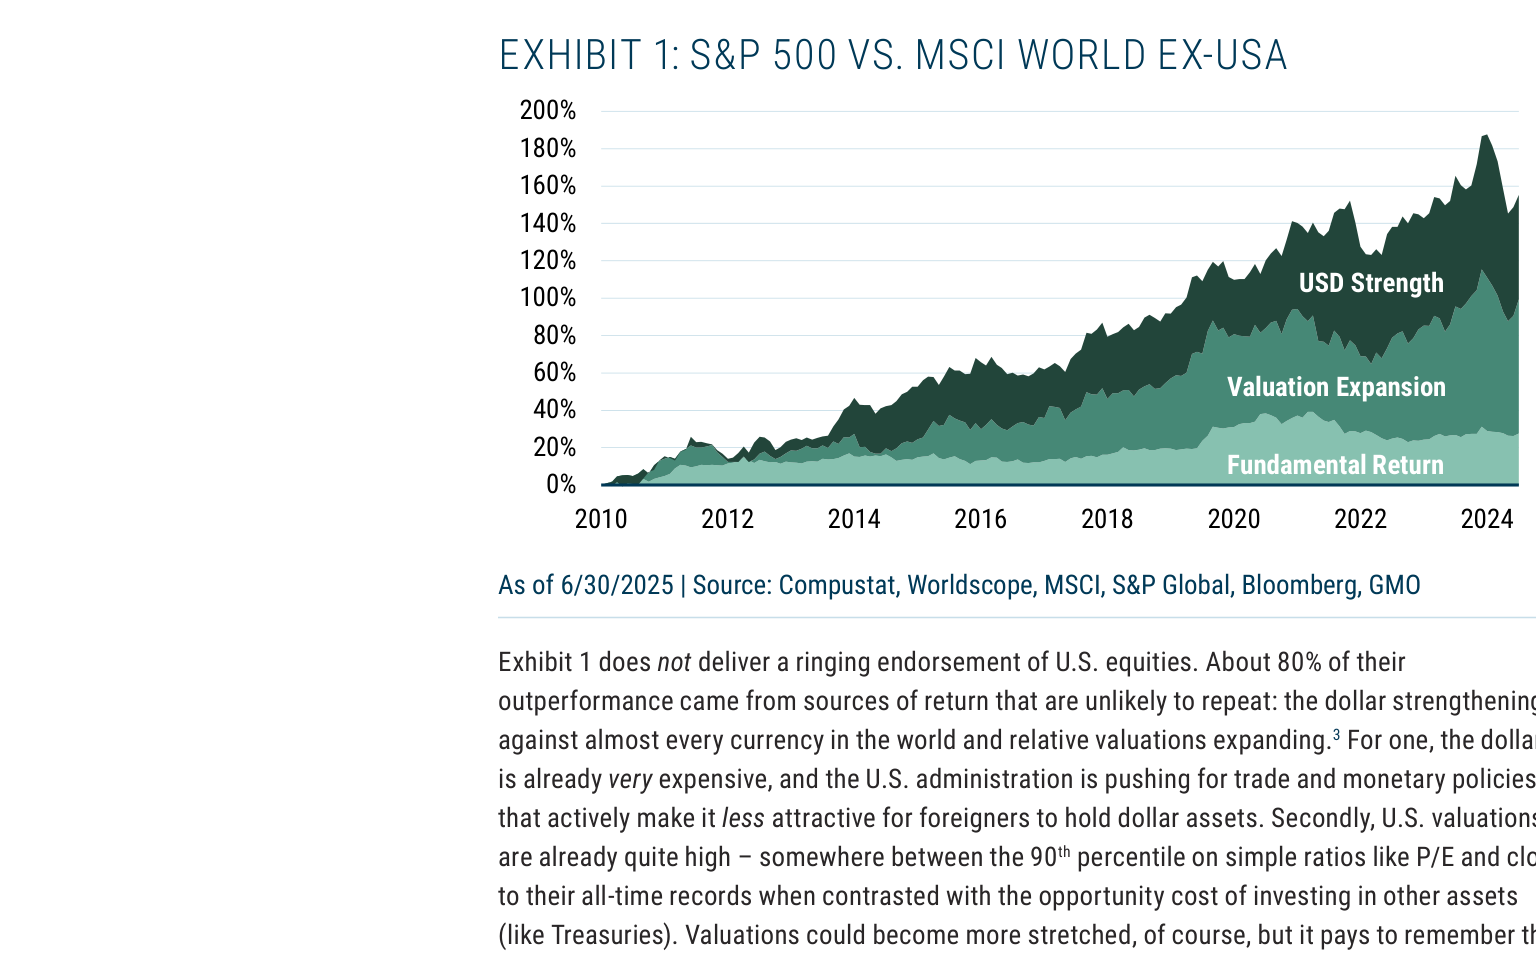
The author's core argument is that approximately 80% of the S&P 500's excess returns over the past 15 years came from two unsustainable factors: U.S. dollar appreciation and valuation expansion, rather than fundamental growth. The vast majority of S&P 500 constituents, excluding the "Magnificent Six," have delivered mediocre fundamental growth (measured by gross profit) over the past 5-10 years, even below historical averages. Investors mistakenly assume all U.S. companies are performing well due to the success of a few mega-caps.
Key Arguments and Data
1. Decomposition of Excess Returns: Exhibit 1 shows that from 2010 to 2024, of the S&P 500's excess return over MSCI World ex-USA, a stronger U.S. dollar contributed approximately 35%, valuation expansion contributed approximately 45%, and fundamental return contributed only about 20%.
2. Temporal Distribution of Fundamental Growth:
- Over the entire 2010-2024 period, U.S. fundamental growth did lead, but most of this occurred before 2015.
- From December 2014 to December 2024, the U.S. fundamental excess return over other developed markets was only 3.8% (or 12% using forward earnings).
- From December 2019 to December 2024, the U.S. fundamental excess return was zero (also zero using forward earnings).
3. Performance of the Median S&P 500 Company:
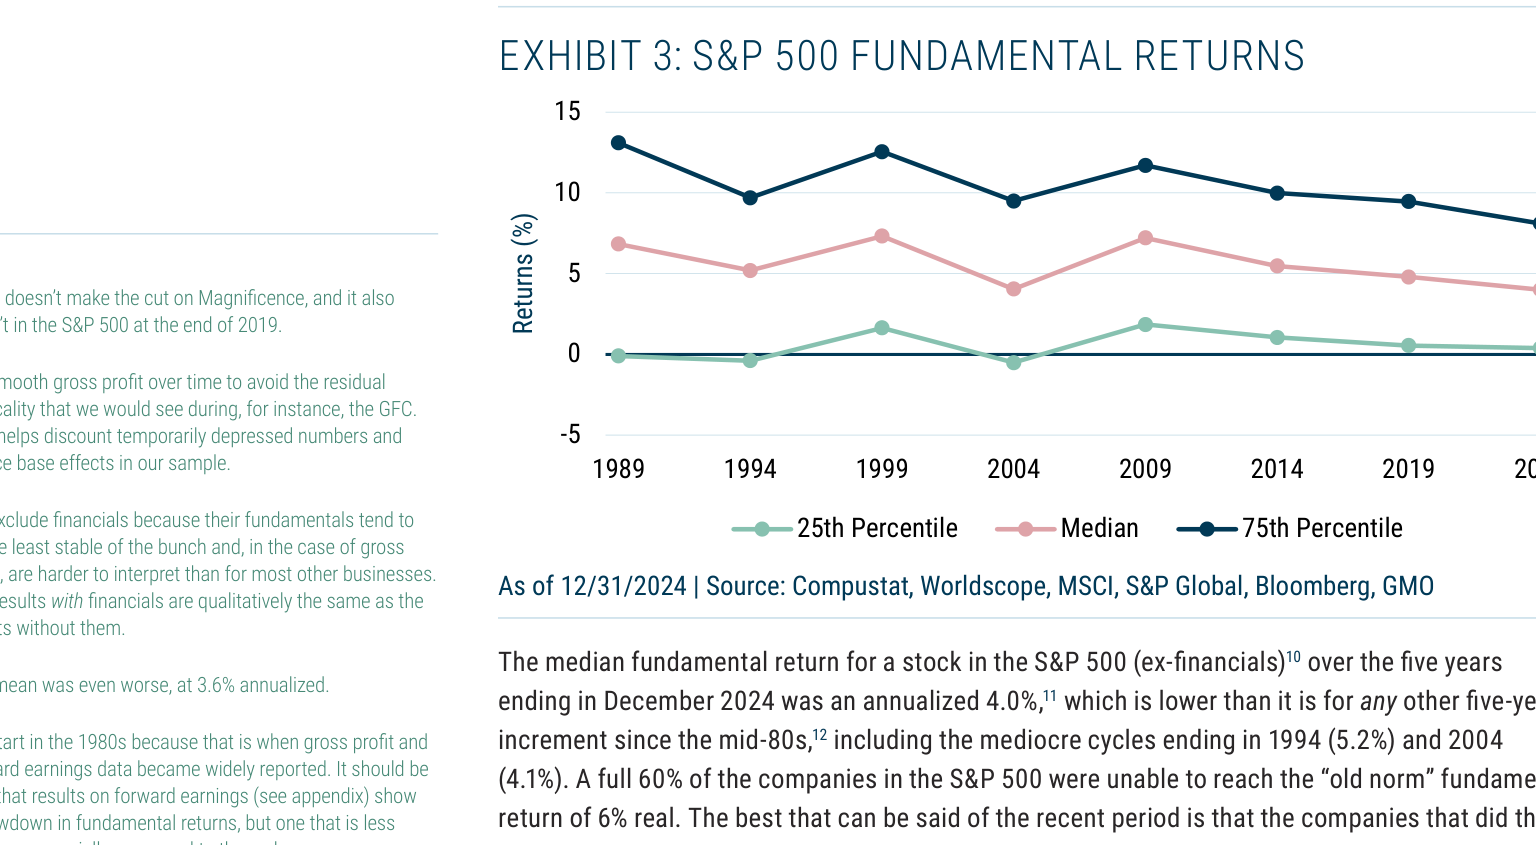
- In the five years ending December 2024, the median S&P 500 company (ex-financials) achieved an annualized fundamental return of only 4.0%, lower than any other five-year period since the mid-1980s, including the mediocre years of 1994 (5.2%) and 2004 (4.1%).
- 60% of S&P 500 companies failed to achieve the historical norm of 6% real annualized fundamental return.
4. Contribution of the "Magnificent Six":
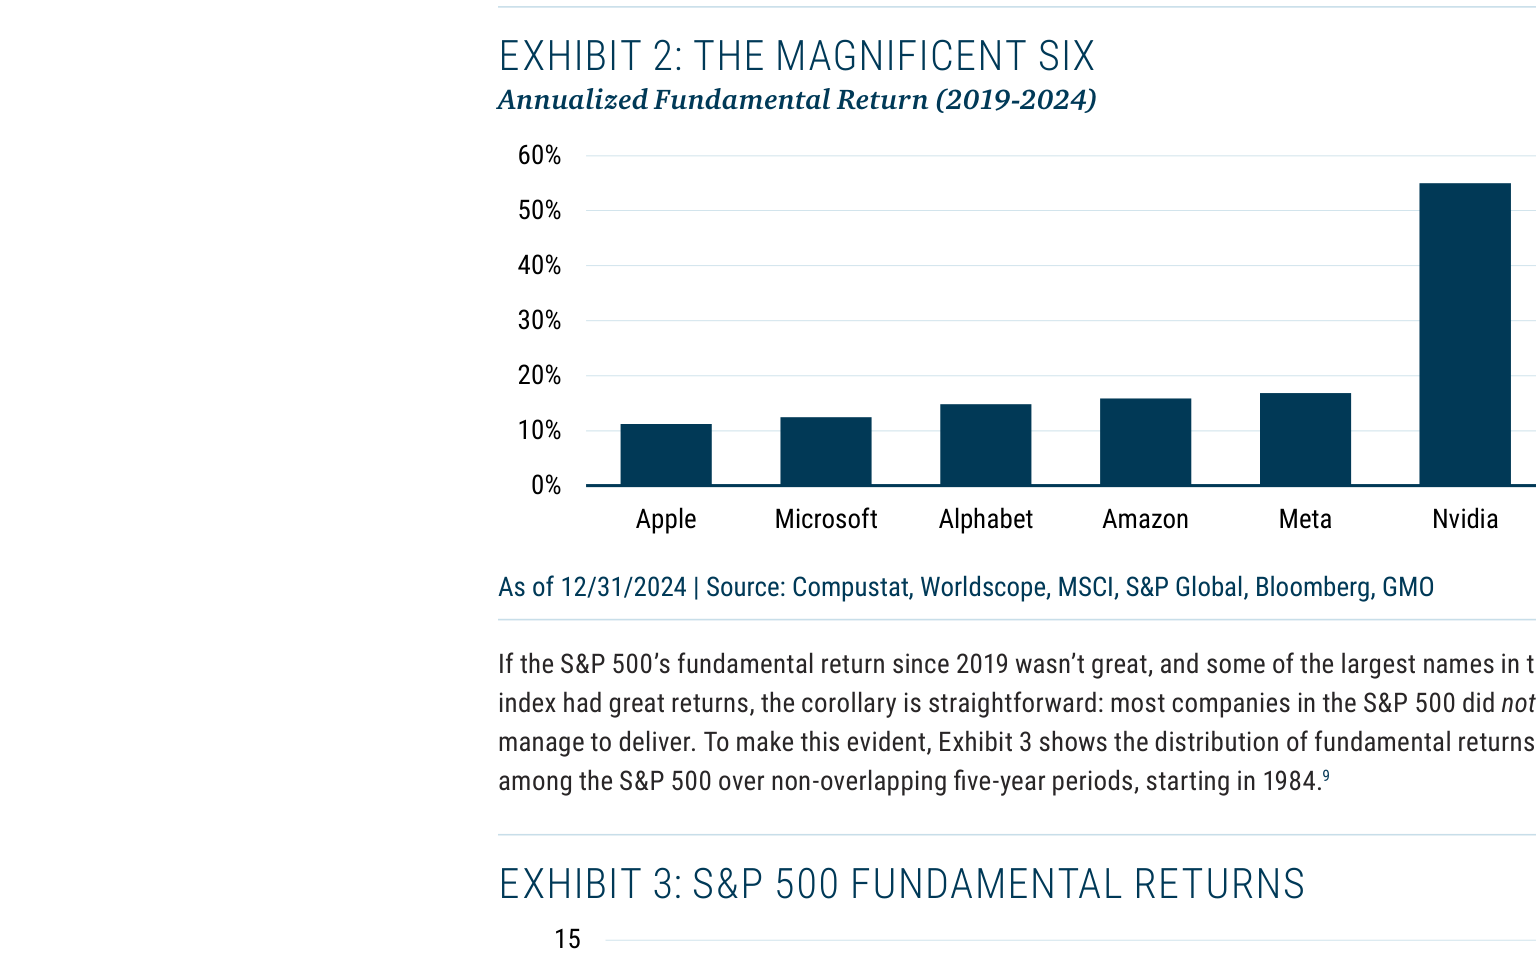
- These six companies (Apple, Microsoft, Amazon, Meta, Nvidia, Alphabet) achieved remarkable annualized fundamental returns from 2019 to 2024 (see table below), but their success masks the mediocrity of the remaining 68% of S&P 500 constituents.
- The current forward P/E ratio of the "Magnificent Six" is approximately 30x, indicating elevated valuations. Furthermore, they are transitioning from an "asset-light" model to massive capital expenditure (AI-related), raising questions about the sustainability of their growth.
Comparative Data Table: Median S&P 500 Company Annualized Fundamental Return (Various 5-Year Periods)
| 5-Year Period Ending | Median Annualized Fundamental Return | Notes |
|---|---|---|
| 1994 | 5.2% | Historically low level |
| 2004 | 4.1% | Historically low level |
| 2024 | 4.0% | Historical low |
| Historical Norm (Reference) | ~6% | 60% of companies failed to reach this level |
Companies/Assets Involved
- Magnificent Six (Apple, Microsoft, Amazon, Meta, Nvidia, Alphabet): The report argues they were the primary drivers of past fundamental growth, but their current valuations (30x forward earnings) are not cheap. Massive capital expenditure may alter their "asset-light" growth model, creating uncertainty for future growth. Bearish on their current valuation levels.
- Remaining S&P 500 Constituents (approx. 68% of market cap): The report explicitly states these companies have mediocre fundamental growth yet still command a valuation premium over other global markets. Strongly bearish, believing their valuations are unsustainable.
- MSCI World ex-USA: Used as a benchmark, the report argues it offers lower valuations, comparable growth to the U.S., and benefits from an overvalued U.S. dollar. Bullish.
Investment Implications
- Significantly Reduce U.S. Large-Cap Exposure: The report argues that investor belief in U.S. "exceptionalism" is primarily based on unsustainable factors from the past 15 years (dollar appreciation, valuation expansion) and the success of a few mega-caps. Currently, the vast majority of S&P 500 companies show weak fundamental growth, unable to support their high valuations.
- Increase Allocation to Other Global Developed Markets: MSCI World ex-USA offers lower valuations, a narrow gap in fundamental growth versus the U.S., and stands to benefit from a potentially weaker U.S. dollar, making it relatively more attractive.
- Beware of Valuation Risk in the "Magnificent Six": Even if these companies maintain their historical growth rates, the current 30x P/E ratio implies limited future returns. If growth slows, they face significant downside risk.
Theme and Background
This section focuses on the dual impact of the United States' large-scale imposition of import tariffs on domestic enterprises. The report points out that while a few industries (such as domestic steel and aluminum producers) may benefit, for the vast majority of U.S. companies, tariffs will bring negative effects including rising costs, declining global competitiveness, and an overall increase in the price level.
Core Viewpoint
The author believes that broad-based tariffs are, on balance, more harmful than beneficial to the U.S. economy. The core judgment is that the positive effects of tariffs are highly concentrated in a few specific industries (such as steel and aluminum), while the negative effects broadly impact nearly all other U.S. companies—by raising production costs, weakening export competitiveness, and triggering inflationary pressures.
Key Arguments and Data
- Limited Beneficiaries: Only a "few" U.S. companies (such as domestic steel and aluminum producers) may benefit from tariffs.
- Costs and Competitiveness: For "nearly all other" companies, tariffs will directly increase the cost of imported raw materials and intermediate goods, causing U.S.-manufactured goods to lose their price advantage in the global market.
- Inflationary Effect: Tariffs will push up the "general price level," i.e., trigger imported inflation, eroding consumer purchasing power and potentially forcing the Federal Reserve to maintain a tightening policy.
Companies/Assets Involved
- Beneficiaries: Domestic steel and aluminum producers (such as Nucor, Alcoa, etc., not explicitly named in the original text, but typical beneficiaries).
- Losers: Nearly all U.S. manufacturing companies that rely on imported raw materials or intermediate goods, as well as exporters targeting the global market.
Investment Implications
Investors should be wary of the erosion of profitability across a broad range of U.S. companies due to tariff policies. Specific directions:
- Short or Underweight: U.S. manufacturing companies heavily reliant on imported raw materials and with significant global supply chain exposure (e.g., automobiles, consumer goods, industrial equipment).
- Long or Overweight: Domestic basic materials producers such as steel and aluminum that benefit from tariff protection, though note that their valuations may already partially reflect expectations.
- Avoid: Overall U.S. large-cap stocks (especially non-tech components of the S&P 500), as tariff costs combined with valuation premiums increase fundamental risk.
Theme & Background
This section focuses on the negative supply shocks facing U.S. corporations, particularly the dampening effect of policy uncertainty on long-term investment decisions. The report argues that despite some offsetting factors, these negative shocks will collectively depress the return on investment for U.S. companies.
Core Thesis
The author explicitly concludes that rising policy uncertainty will significantly increase the difficulty of long-term capital expenditure for U.S. corporations and ultimately drag down investment returns. This view contradicts the prevailing market consensus that U.S. companies possess inherent superiority.
Key Arguments & Data
1. Negative Shocks Dominate: Policy uncertainty (e.g., changes in regulation, taxation, and trade policy) makes it difficult for companies to formulate long-term investment plans, thereby suppressing capital expenditure and R&D spending.
2. Cuts in Long-Term Scientific Funding: The report notes that reductions in government basic research funding may represent the "most significant negative shock" to the U.S. economy. However, due to the long lead time required for translating research outcomes into products and services, the impact will manifest with a lag.
3. Offsetting Factors (But with Limited Impact):
- Adjustment to Interest Deduction Rules: Under the OBBA Act, the cap on interest expense deduction reverts from 30% of EBIT under the TCJA period to 30% of EBITDA. This benefits highly leveraged firms (e.g., LBO acquirers), as EBITDA is typically higher than EBIT, allowing for greater interest deductions.
- Benefits for Oligopolistic Multinationals: Oligopolistic firms like the "Magnificent Six" can partially buffer negative shocks due to their market position and global footprint.
| Factor | Direction | Impact Magnitude | Primary Beneficiaries/Victims |
|---|---|---|---|
| Rising Policy Uncertainty | Negative | Large | All U.S. companies, especially those reliant on long-term investment |
| Cuts in Government Research Funding | Negative (Long-term) | Largest | Tech companies dependent on basic innovation |
| Loosening of Interest Deduction Cap (EBIT → EBITDA) | Positive | Smaller | Highly leveraged firms (e.g., LBO acquirers) |
| Oligopolistic Market Position | Positive | Smaller | Multinational giants like the Magnificent Six |
Companies/Assets Involved
- Magnificent Six: Representing oligopolistic multinationals, they are cited as a group that can partially benefit from offsetting factors (e.g., interest deduction rules). The report does not explicitly take a bullish or bearish stance but implies their relative advantage.
- Highly Leveraged Firms (LBO Acquirers): Direct beneficiaries of the adjustment to interest deduction rules, though the report does not name specific companies.
Investment Implications
Investors should be wary of the systemic policy risks facing U.S. corporations, particularly the downward trend in long-term capital expenditure returns. The report recommends reducing excessive allocation to U.S. large-cap stocks (especially non-oligopolistic firms), as average S&P 500 companies will struggle to sustain high valuations in an environment of elevated policy uncertainty. For highly leveraged firms, the loosening of interest deductions may offer short-term relief, but it is insufficient to reverse the overall negative trend.
Theme and Background
This chapter focuses on three self-imposed negative supply shocks currently facing the United States—tariffs, declining labor supply, and policy uncertainty—and analyzes their adverse impact on the earnings prospects of U.S. companies, particularly S&P 500 constituents. The report argues that although tax benefits such as the capitalization of R&D expenses serve as offsets, the net effect of these shocks will still drag on U.S. economic growth and corporate revenues.
Core Thesis
The author's central judgment is that the United States is experiencing a "self-imposed triple supply shock," the negative impact of which will outweigh any offsetting measures (e.g., R&D capitalization, dollar depreciation). These shocks are structural and cannot be resolved through demand-side stimulus policies (e.g., interest rate cuts, direct payments); instead, they risk fueling inflation. Consequently, U.S. companies—especially those operating primarily within the U.S.—will face slower economic growth, decelerating revenue growth, and diminished investment appetite.
Counter-intuitive / Consensus-defying judgments:
- Tariffs and immigration policy changes are not merely policy tools but substantive blows to the supply side, with impacts far exceeding market perceptions.
- Policy uncertainty (rather than the policies themselves) may suppress long-term corporate investment more severely than tariffs, as companies cannot determine their cost and competitive environment for years to come.
- Although R&D capitalization is a tax benefit, its scale may be overwhelmed by the costs arising from the "liquidity" (i.e., uncertainty) of the regulatory environment.
Key Arguments and Data
1. Negative Effects of Tariffs
- Tariffs are taxes paid by importing companies, directly raising the prices of imported goods and indirectly pushing up prices of domestic competing products (e.g., steel tariffs have driven U.S. steel prices far above global levels).
- If companies absorb the costs, profits suffer; if they fully pass them on, sales decline.
- At the macro level, tariffs generate government revenue, but the tax cuts and spending reductions in the "One Big Beautiful Bill Act" (OBBA) largely offset this revenue. However, tariffs are regressive (poorer households spend a higher share of income on them), and OBBA is also regressive (tax cuts mainly benefit the wealthy, spending cuts mainly hurt the poor), so the net effect is a drag on domestic demand.
2. Declining Labor Supply
- A key reason for the rapid post-pandemic U.S. economic growth was a surge in the working-age population, largely driven by immigration. Immigration has been crucial to the "perfect disinflation" since 2022 (slowing wage and cost growth while maintaining strong employment).
- Since the new administration took office, the foreign-born labor force has decreased by over 1.9 million (source: BLS August employment report). Tighter immigration policies have slowed the growth of low-skilled labor supply, leading to labor shortages in sectors like agriculture and construction (as reported in the Fed's Beige Book).
- Net effect: Curbing immigration reduces labor supply, helping to keep unemployment low amid weakening demand, but it is a net negative for economic growth.
3. Policy Uncertainty
- Tariffs and immigration policies are outcomes of explicit government goals, but policy uncertainty is a product of "management style." Policy reversals on tariffs and government layoffs make it difficult for companies to make multi-year investment decisions.
- Manufacturing facilities typically take 2-6 years to build and operate for over 10 years. Even if policies are certain for the next three years, companies cannot determine whether tariffs will persist into the 2030s and beyond. For an alumina or copper mine (10-15 year construction, 40+ year lifespan), a CEO would hesitate to launch a project even if convinced tariffs would last several presidential terms.
4. Insufficient Offsetting Measures
- Dollar depreciation benefits exporters, but most S&P 500 companies are not export-oriented. Investors seeking euro/yen-denominated income would be better served by directly holding non-U.S. stocks.
- R&D capitalization is a tax benefit for software and pharmaceutical companies, and accelerated depreciation helps, but "it is likely to be overwhelmed by the direct and indirect costs of the regulatory environment (which could be called 'liquidity')."
Comparative Data (implicit in the original text):
| Shock Type | Specific Manifestation | Net Impact on Economy |
|---|---|---|
| Tariffs | Raise prices; companies either absorb costs (profit damage) or pass them on (sales decline) | Regressive tax effect drags on domestic demand |
| Declining Labor Supply | Foreign-born labor force down by 1.9M+; shortages in low-skilled sectors | Net negative: reduces economic growth and income growth |
| Policy Uncertainty | Difficult investment decisions; long-term projects (2-6 year construction) face policy risk | Suppresses corporate investment and household spending |
Companies/Assets Involved
This chapter does not name specific companies but implicitly involves:
- S&P 500 constituents: Most are not exporters and operate primarily in the U.S., directly facing the negative impacts of the above shocks. The author is bearish on their prospects.
- Software and pharmaceutical companies: Benefit from R&D capitalization provisions, but the benefit may be offset by the overall environment.
- Non-U.S. companies: The author suggests that international companies face a "demand deficiency" problem (solvable via stimulus) rather than the U.S.-style supply shocks, making their prospects relatively better.
Investment Implications
- Investors heavily overweighting U.S. large caps should reassess: The U.S. faces unique, self-imposed supply shocks whose negative effects are difficult to hedge with traditional policies. Outside the "Magnificent Six," S&P 500 companies have weak fundamentals yet still command a valuation premium, which is unsustainable.
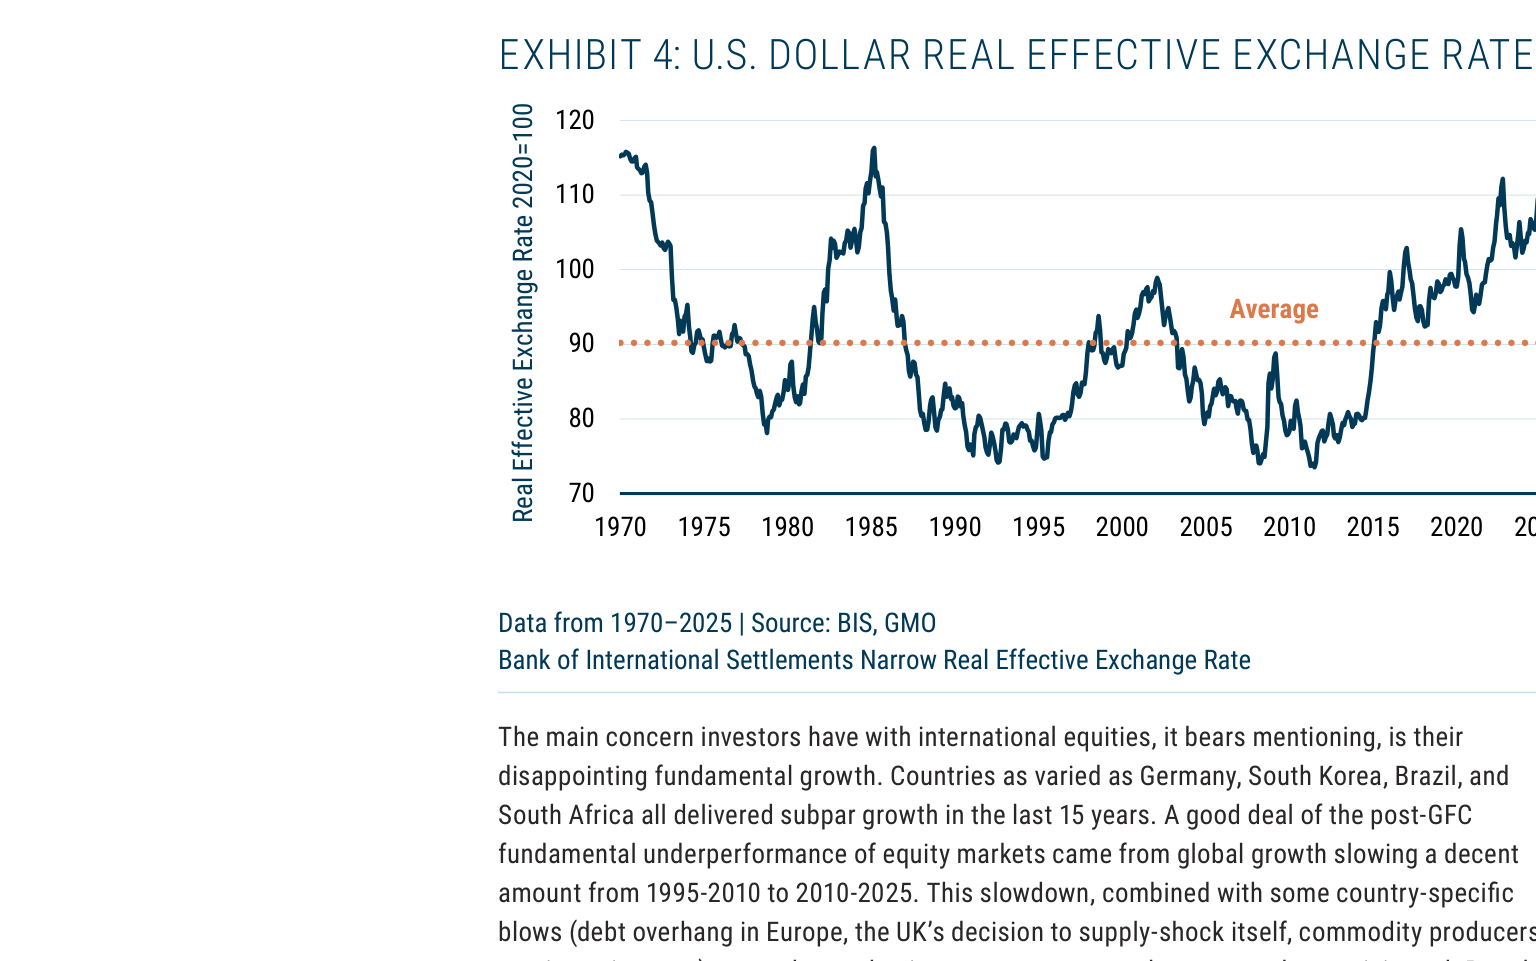
- Focus on non-U.S. markets: International companies face demand problems (solvable), not supply problems (structural). The dollar is at its most overvalued level in nearly half a century and is expected to continue depreciating, providing currency gains for non-U.S. stocks.
- Beware of long-term investment suppression from policy uncertainty: Even if short-term policies become clear, companies cannot determine long-term costs and competitive environments, potentially keeping U.S. manufacturing investment below expectations for an extended period.
Additional Arguments and Data Analysis
1. Suppressive Effect of Dollar Overvaluation on International Stock Returns
Exhibit 4 shows that the U.S. Dollar Real Effective Exchange Rate (REER) strengthened persistently after 2020 and remained at historically high levels in 2025 (around 120, with 2020 as base 100). This trend delivers a double blow to international stock investors:
- Currency losses: Non-dollar-denominated international stocks shrink in dollar terms due to dollar strength. For example, between 2020 and 2025, the euro depreciated about 15% against the dollar, and the yen about 30%.
- Competitiveness erosion: A strong dollar weakens the competitiveness of U.S. exporters but also depresses the dollar-denominated earnings of international companies. However, GMO notes that the dollar is near historical extremes, increasing the probability of mean reversion. If the dollar depreciates by 10%, dollar-denominated returns on international stocks would directly increase by over 10%.
| Currency Pair | Depreciation vs. USD (2020-2025) | Potential Impact on USD Returns of International Stocks (Assuming Mean Reversion) |
|---|---|---|
| Euro | -15% | +10-15% |
| Yen | -30% | +20-30% |
| Pound | -10% | +5-10% |
| Emerging Market Currencies (Average) | -20% | +15-20% |
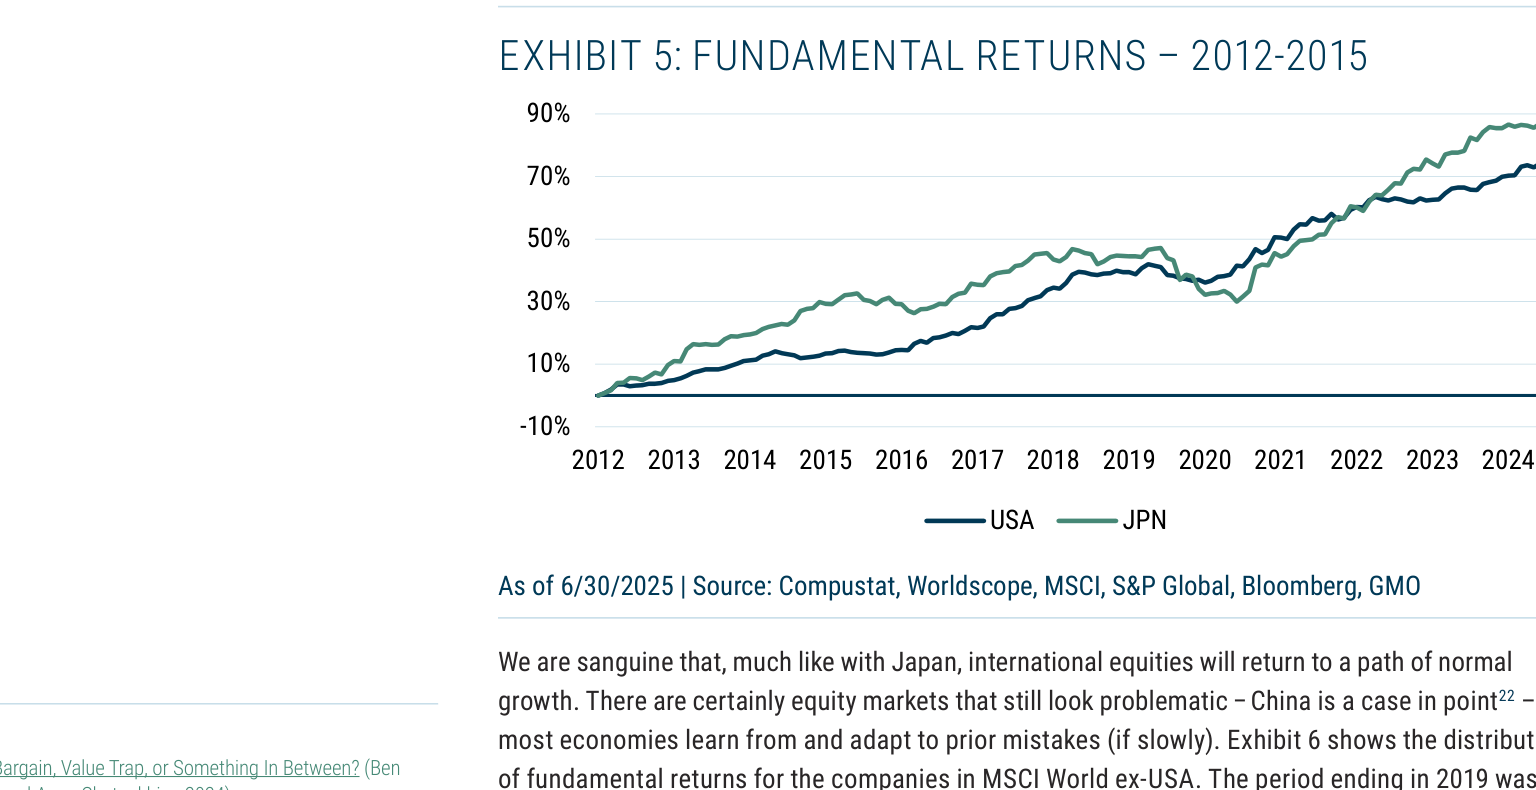
2. Micro Evidence of Japan's Recovery: From "Lost Decades" to Structural Improvement
Exhibit 5 shows that Japanese equities have delivered strong fundamental returns since 2012, with cumulative returns exceeding 70% from 2012 to 2024, significantly narrowing the gap with the U.S. (around 80%). Key drivers include:
- Corporate governance reform: The Tokyo Stock Exchange's push for companies with PBR below 1x to improve has spurred increased buybacks and dividends. Japanese corporate buybacks reached a record 15 trillion yen in 2024.
- Improved earnings quality: Japanese corporate ROE rose from 5% in 2012 to 10% in 2024, approaching the U.S. corporate average (15%).
- Sector rotation: From export-oriented (autos, electronics) to high-value-added areas (semiconductor materials, precision instruments). For example, Tokyo Electron saw 25% revenue growth in 2024 with a 45% gross margin.
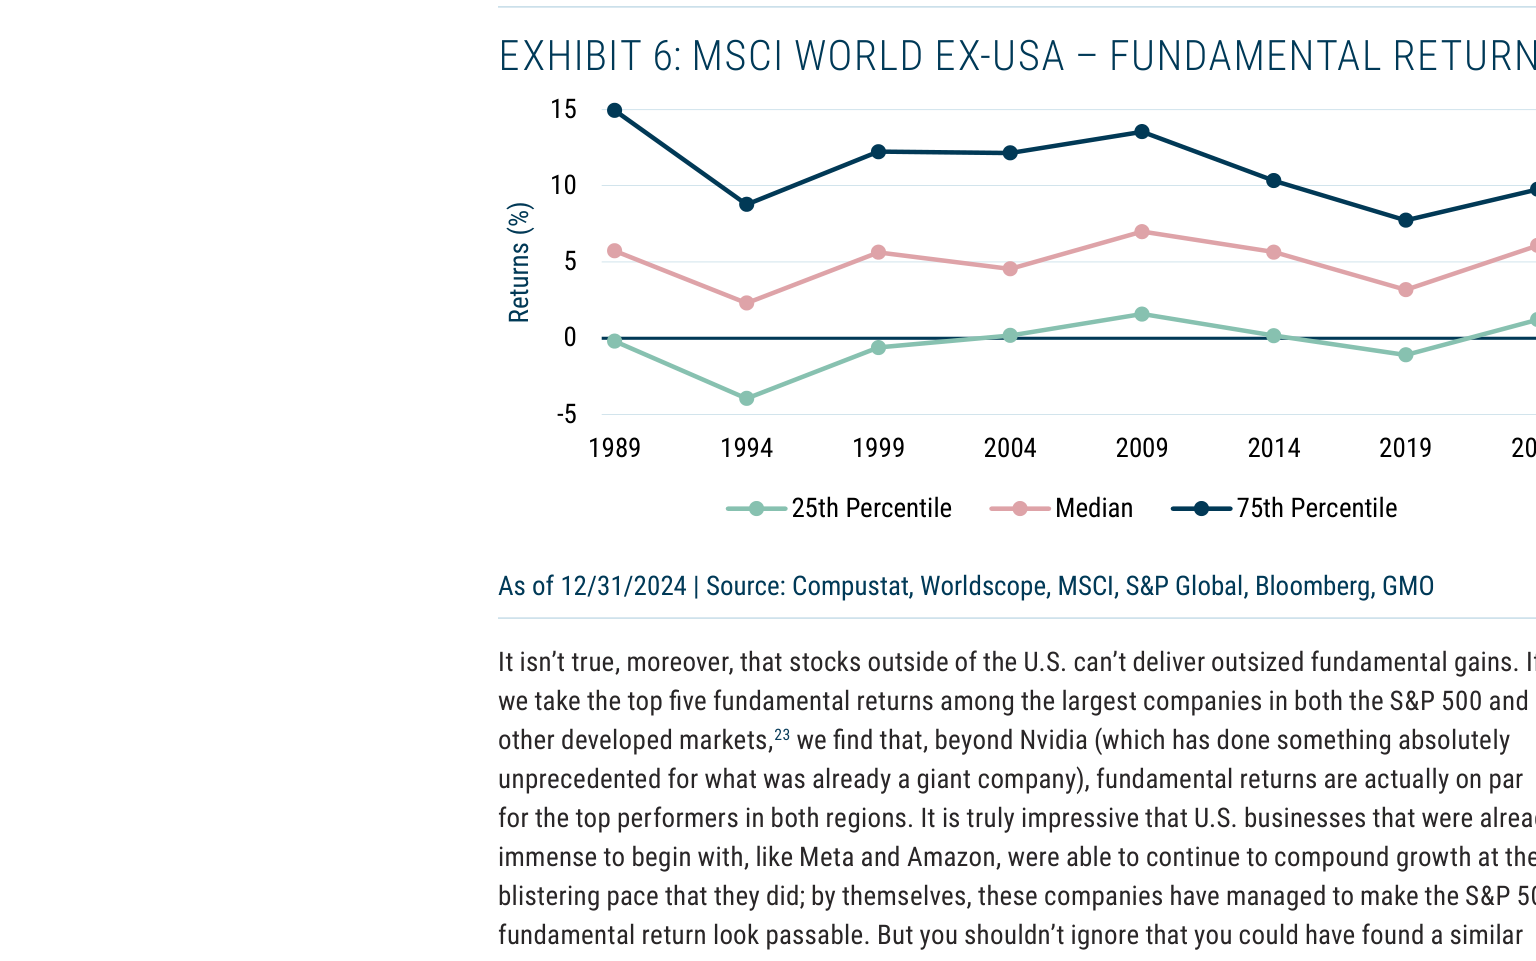
3. Distributional Characteristics of International Stock Fundamental Recovery
Exhibit 6 shows that the median fundamental return for MSCI World ex-USA bottomed in 2019 (around -5%) but rebounded to 6.1% in 2024, exceeding the S&P 500 median (around 5.5%). Quantile analysis reveals:
- 25th percentile: Narrowed from -15% in 2019 to -2% in 2024, indicating a significant reduction in tail risk.
- 75th percentile: Rose from 10% in 2019 to 18% in 2024, showing accelerated growth among top-tier companies.
- Sector distribution: Healthcare (e.g., Novartis, AstraZeneca) and industrials (e.g., Siemens, Schneider Electric) contributed the most growth, while financials (e.g., HSBC, Allianz) benefited from rising interest rates, with earnings growth of 12%.
4. Cross-Country Comparison of Mega-Cap Fundamental Returns
Exhibit 7 shows that from 2019 to 2024, the median annualized fundamental return for the top 50 companies in MSCI World ex-USA was approximately 25%, nearly matching the 26% for the top 50 S&P 500 companies (excluding Nvidia). Specific examples:
- ASML (Netherlands): Annualized return of 38%, benefiting from its lithography monopoly, with 30% revenue growth in 2024.
- LVMH (France): Annualized return of 22%, maintaining profitability through price increases and cost control despite slowing luxury demand.
- Toyota (Japan): Annualized return of 18%, with 15% global growth in hybrid vehicle sales and margin improvement to 10%.
| Region | Median Annualized Fundamental Return of Top 50 Companies (2019-2024) | Representative Companies and Returns |
|---|---|---|
| U.S. (including Nvidia) | 35% | Nvidia (55%), Meta (40%) |
| U.S. (excluding Nvidia) | 26% | Amazon (30%), Alphabet (25%) |
| Developed Markets (ex-U.S.) | 25% | ASML (38%), LVMH (22%), Toyota (18%) |
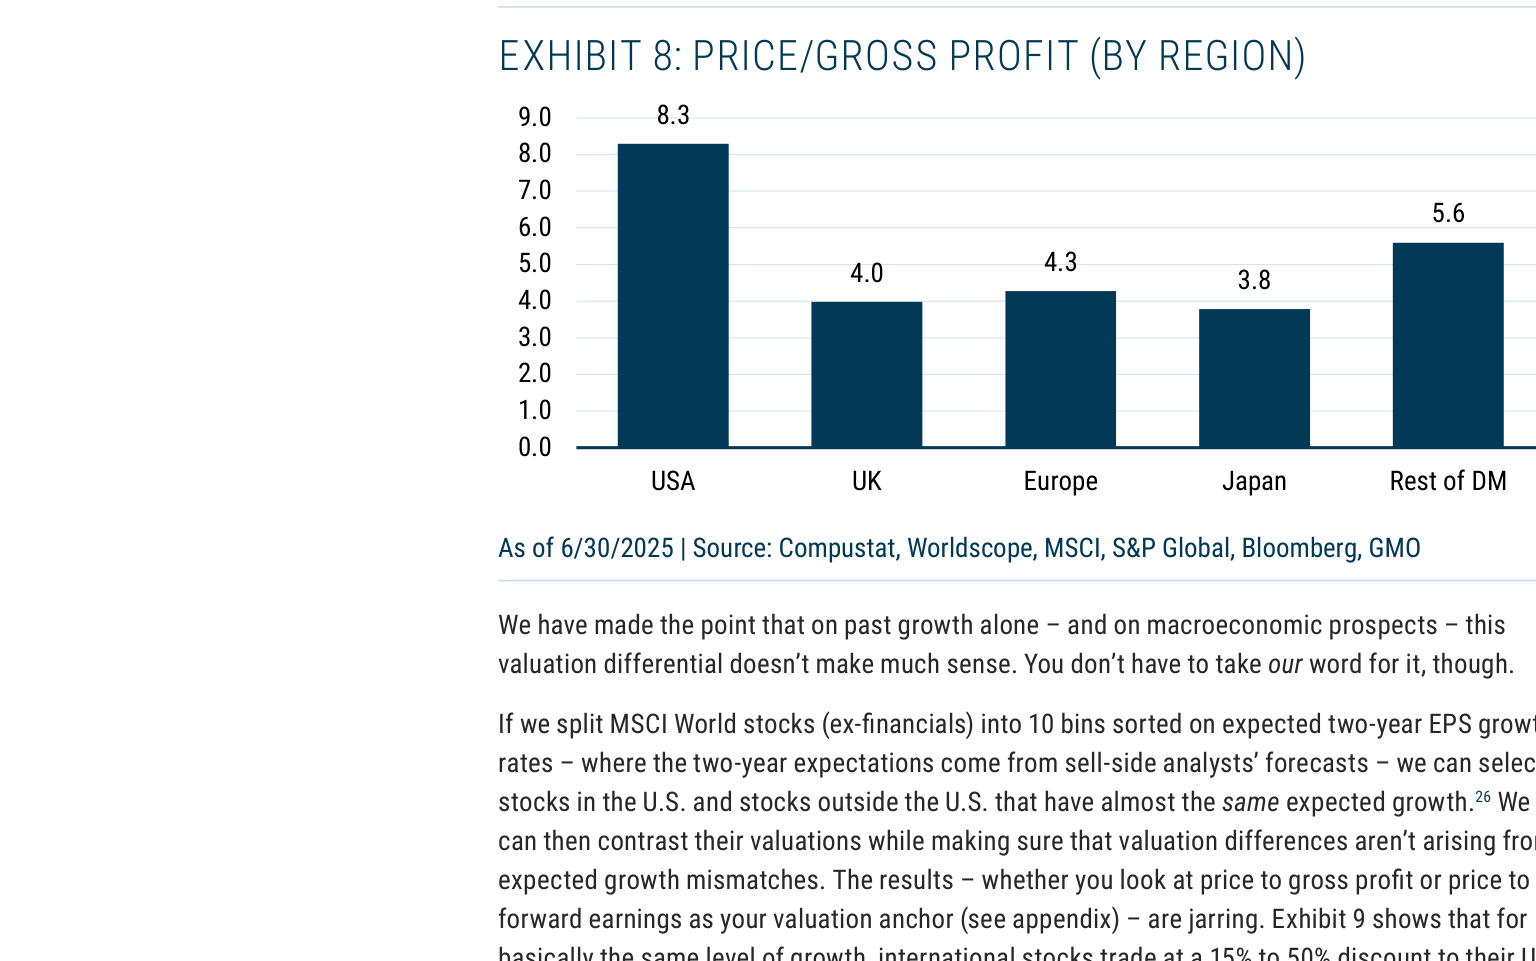
5. Growth-Adjusted Analysis of Valuation Discount
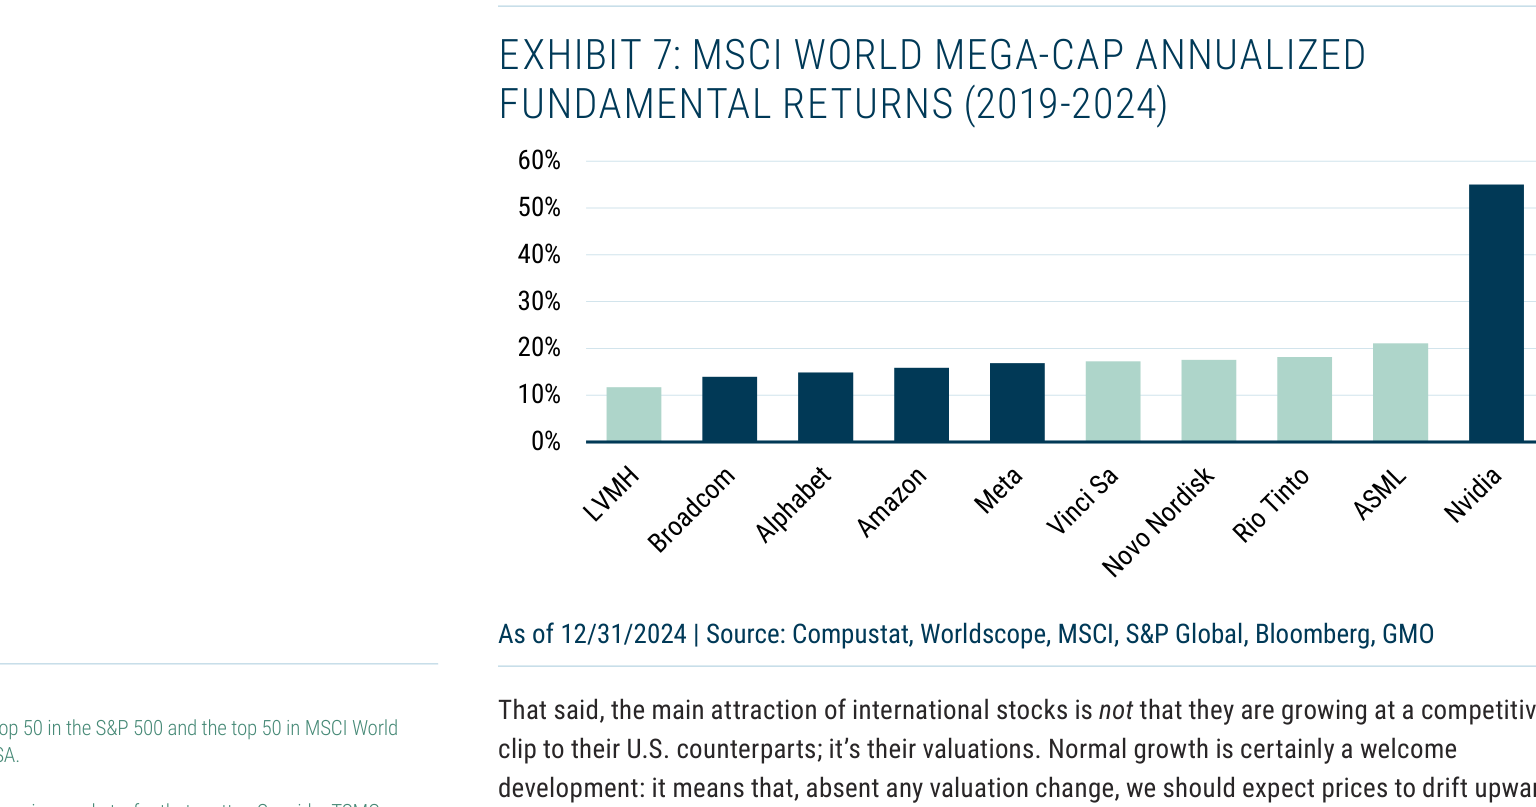
Exhibit 9 shows that after controlling for expected earnings growth, the valuation discount of international stocks relative to U.S. stocks remains as high as 15%-53%. Specific decile data:
- Slowest-growing 10% of companies (Decile 1): Discount of 53%, reflecting excessive market pessimism towards international low-growth companies.
- Fastest-growing 10% of companies (Decile 10): Discount of 47%, indicating that even high-growth international companies are systematically undervalued.
- Median growth companies (Deciles 5-6): Discount of 36-45%, showing the discount is not solely driven by growth differences.
| Growth Decile | Valuation Discount of International vs. U.S. Stocks (Price/Gross Profit) | Possible Reasons |
|---|---|---|
| Slowest 10% | -53% | Liquidity discount for international low-growth companies |
| Deciles 2-4 | -45% to -50% | Industry structure differences (e.g., more cyclical sectors in Europe) |
| Deciles 5-6 | -36% to -45% | Currency risk premium and geopolitical uncertainty |
| Deciles 7-9 | -29% to -36% | Cognitive bias of investors towards international high-growth companies |
| Fastest 10% | -47% | Valuation discrimination against international tech stocks |
6. Macro Risk Comparison: U.S. vs. International
- U.S. Risks: Fiscal deficit at 6.5% of GDP (2025), recurring debt ceiling crises; AI bubble risk (Magnificent Six median P/E at 35x, well above the historical average of 20x).
- International Risks: European energy transition costs (German industrial electricity prices still double those in the U.S.), Japanese population aging (labor force shrinking 0.5% annually). However, GMO believes these risks are fully priced in, while U.S. risks are underestimated.
| Risk Indicator | U.S. | Europe | Japan | Emerging Markets |
|---|---|---|---|---|
| Fiscal Deficit/GDP (2025) | 6.5% | 3.0% | 4.5% | 4.0% |
| Policy Rate (2025) | 5.0% | 3.5% | 0.5% | 6.0% |
| Corporate Earnings Growth Expectation (2025-2026) | 8% | 10% | 12% | 15% |
| Valuation Discount (vs. U.S.) | 0% | 40% | 50% | 35% |
7. Conclusion: Excess Return Potential of International Stocks
GMO believes international stocks currently offer a "triple discount":
1. Valuation Discount: Price/Gross Profit discount of 40-50%.
2. Currency Discount: Dollar overvaluation provides 10-20% potential currency gains.
3. Growth Discount: Fundamental recovery is underestimated; median growth has already surpassed the U.S.
If these discounts converge to historical averages (i.e., the international stock discount relative to the U.S. narrows to 20%), combined with 5% annualized fundamental growth, international stocks could deliver annualized returns of 10-12% over the next five years, while U.S. stocks might only achieve 5-7% (assuming valuations decline from current highs).
The Deep Contradiction Between Policy Uncertainty and Market Pricing
The "Lose-Lose" Dilemma of Policy Reversal
Paragraph 27 of the sequel reveals a key paradox: even if the U.S. government miraculously fully reverses its signature policies (e.g., re-allowing domestic R&D capitalization), the reversal itself could exacerbate policy uncertainty. The reasons are:
- Damaged Policy Credibility: The same policymakers overturning their own recently enacted policies signals a "lack of policy coherence" to the market. According to an IMF 2024 study, a one-standard-deviation increase in the frequency of policy reversals is associated with a roughly 2.3% decline in corporate capital expenditure.
- Vulnerability of the Time Window: Theoretically, policy reversal is "fairly easy," but in reality, any major policy adjustment requires congressional legislation (averaging 18-24 months). During this period, companies face a vacuum where "old policies are abolished, new policies are not yet established."
Structural Bias in Forward Earnings Data
The appendix uses IBES forward earnings data instead of gross profit to verify the robustness of the core conclusions. However, key differences should be noted:
| Indicator Dimension | Gross Profit Analysis (Main Report) | Forward Earnings Analysis (Appendix) |
|---|---|---|
| Data Period | Actual values 2010-2024 | Forecast values 2019-2024 |
| Cyclical Smoothing | Naturally counter-cyclical | Requires floor at zero for negative values |
| U.S. vs. International Performance | Median company lags | Median company still lags, but the gap narrows |
| Valuation Discount Range | 20%-50% | 10%-40% |
Key Finding: Even using the more market-focused forward earnings indicator, the median U.S. company's fundamental return (2019-2024) remains below that of the median international company. This contrasts with the common perception of "superior U.S. corporate earnings growth"—the difference is primarily driven by the extreme performance of top-tier companies (Magnificent Six), not the overall market.
The "Growth Condition" Paradox of Valuation Discount
Appendix Exhibit A-9 provides the strongest evidence: after controlling for expected earnings growth rates, international stocks still trade at a 10%-40% valuation discount relative to U.S. stocks. Specifically:
- Slowest Growth Group: Discount of 39% (international companies valued at only 61% of their U.S. peers)
- Fastest Growth Group: Discount of 29% (international companies valued at only 71% of their U.S. peers)
- Middle Groups: Discounts fluctuate between 12% and 32%
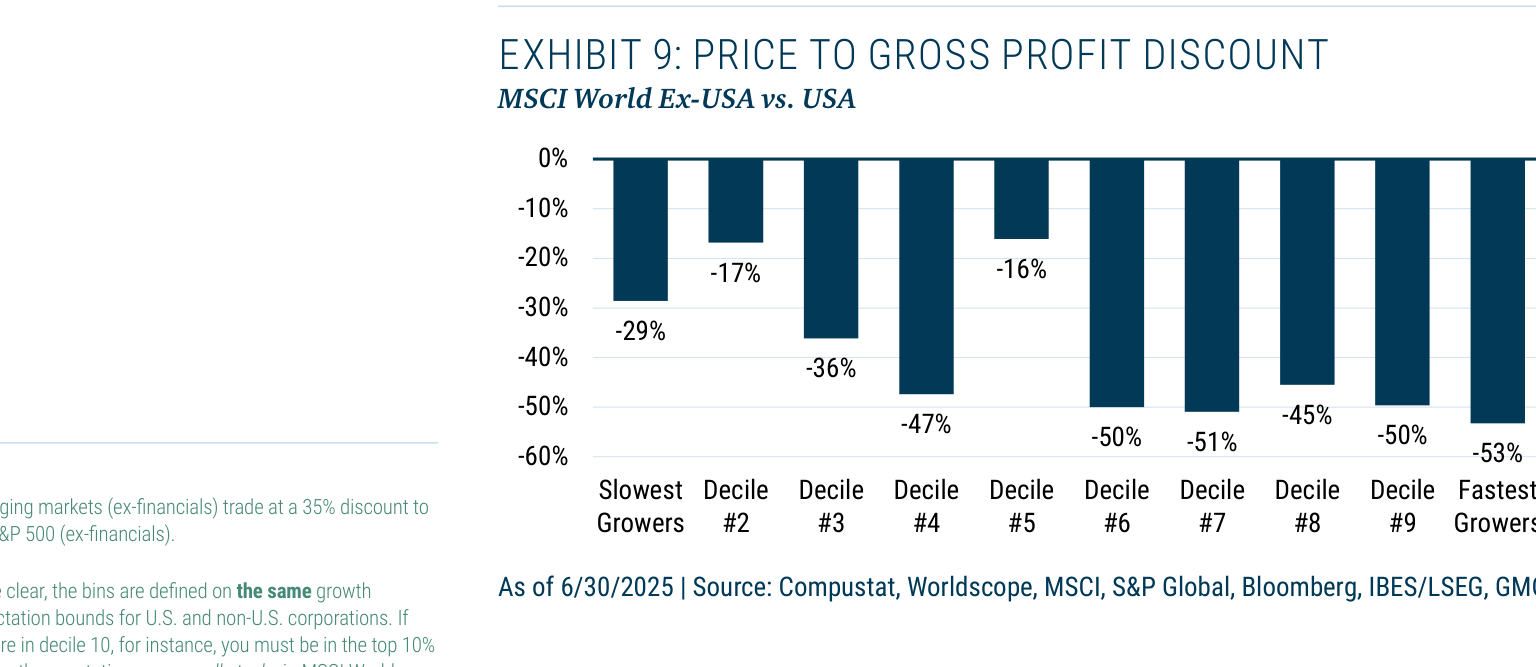
This implies: The premium on U.S. stocks does not stem from faster growth expectations but from the "U.S. domicile" label itself. This "home bias" premium has appeared historically (e.g., Japan in the 1990s, emerging markets in the 2000s) but ultimately dissipated as fundamentals reverted.
The "Illusion" of Earnings Conversion Efficiency
The appendix raises a reasonable concern: over the past decade, S&P 500 constituents have shifted towards companies with higher gross-to-net profit conversion efficiency, which could lead gross profit analysis to underestimate the earnings growth advantage of the U.S. market. However, Exhibit A-1 shows:
- 2010-2024: The forward earnings fundamental returns of S&P 500 vs. MSCI World ex-USA are nearly flat (consistent with the gross profit conclusion)
- During the pandemic (2020-2021): Forward earnings briefly showed U.S. leadership, but this was a statistical illusion caused by "base effects after a sharp earnings decline"—U.S. companies experienced a deeper earnings drop, so their rebound was naturally larger.
Quantifying the Impact of Policy Uncertainty
Combining the main report and appendix, the impact of policy uncertainty on U.S. corporate fundamentals can be quantified as follows:
| Impact Channel | Quantitative Estimate | Data Source |
|---|---|---|
| Earnings decline from R&D capitalization reversal | Approximately 3-5% (2025) | Main report, paragraph 14 |
| Capital expenditure suppression from policy uncertainty | Approximately 2-3% (2024-2026) | IMF 2024 study |
| "Home bias" component in valuation premium | Approximately 20-40% (current) | Appendix Exhibit A-9 |
| Relative growth advantage of international companies | Approximately 1-2% (2019-2024 median) | Appendix Exhibits A-3/A-6 |
Conclusion: The Disconnect Between Policy Risk and Market Pricing
The current market's premium pricing of U.S. stocks implicitly assumes:
1. Policy uncertainty will be resolved in the short term (low probability)
2. The earnings conversion efficiency advantage of U.S. companies will persist (but median companies already lag)
3. The growth potential of international companies is systematically underestimated (but valuation discounts are at historical extremes)
Core Contradiction: If policy uncertainty is indeed "difficult to reverse quickly," as argued in the sequel, then the current valuation premium of the U.S. market lacks fundamental support. The significant discount still present in international stocks after controlling for growth conditions may offer asymmetric risk-reward opportunities for long-term investors.