Voss Capital Q2 2026 Letter to Partners
Voss Capital is a Houston hedge fund founded by Travis Cocke in 2011, running value-oriented, bottom-up strategies focused on underfollowed small- and mid-cap special situations through long/short and long-only funds, increasingly turning activist.
In plain words
This is Voss Capital's Q2 2026 letter. They're cautiously optimistic: AI is booming but the rest of the economy is weak, yet small- and mid-cap stocks are seeing earnings upgrades, making it a good time to find bargains. The fund returned about 22-23%, slightly beating the market. Key holdings: Rackspace Technology (RXT) is a high-leverage turnaround play that could double if EBITDA recovers; De’Longhi (DLG) has a profitable coffee business the market ignores; they also started a new position in RXT, betting on its partnerships with AMD and Palantir. Risk: AI spending is so huge that if returns disappoint, it could trigger a crash.
At a Glance
One-sentence summary: The author maintains a [cautiously optimistic] stance, arguing that the AI-driven capital expenditure boom coexists with a traditional economic recession. However, earnings revisions for SMID stocks have turned positive, making the current environment a "fertile hunting ground" for bottom-up selection of high-leverage turnaround and valuation-mispricing targets.
- The fund delivered a net return of approximately +22-23% for the quarter, outperforming the Russell 2000 by about 1.7 percentage points. Total exposure remained high at 178.7%, with delta-adjusted net long exposure at 100.6%.
- New position initiated in Rackspace Technology (RXT), viewed as a high-leverage turnaround opportunity. If EBITDA recovers from below $300 million to $800 million, the stock has potential to double.
- Heavy position in De’Longhi (DLG), noting that its professional coffee business contributes 34% of EBITDA with only 18% of revenue, yet is "valued at zero" by the market. The overall 8x EBITDA multiple is far below the peer range of 15-17x.
- Core risk: Operating cash flow of hyperscalers has been fully consumed by capital expenditures. If open-source models continue to gain market share while downstream ROI remains weak, it could trigger a shift in the AGI investment "chicken game."
This Quarter’s Performance Slightly Outpaced the Market, Gross Exposure Remains Elevated
Performance Comparison: This quarter, the Voss Value Fund returned +22.4% net, and the Offshore Fund returned +23.2% net, outperforming the Russell 2000 (+21.5%) by 1.7 and 1.7 percentage points, the Russell 2000 Value (+17.2%) by 5.2 and 6.0 percentage points, and the S&P 500 (+15.2%) by 7.2 and 8.0 percentage points, respectively. As of June 30, gross exposure stood at 178.7%, delta-adjusted net long exposure at 100.6%, the top 10 long positions weighted 73.9%, and the top 10 short positions weighted -34.8%. The fund’s assets were approximately $260.7 million, with total firm assets around $2 billion.
Market Polarization Intensifies, AI Winners Decoupled from the Rest
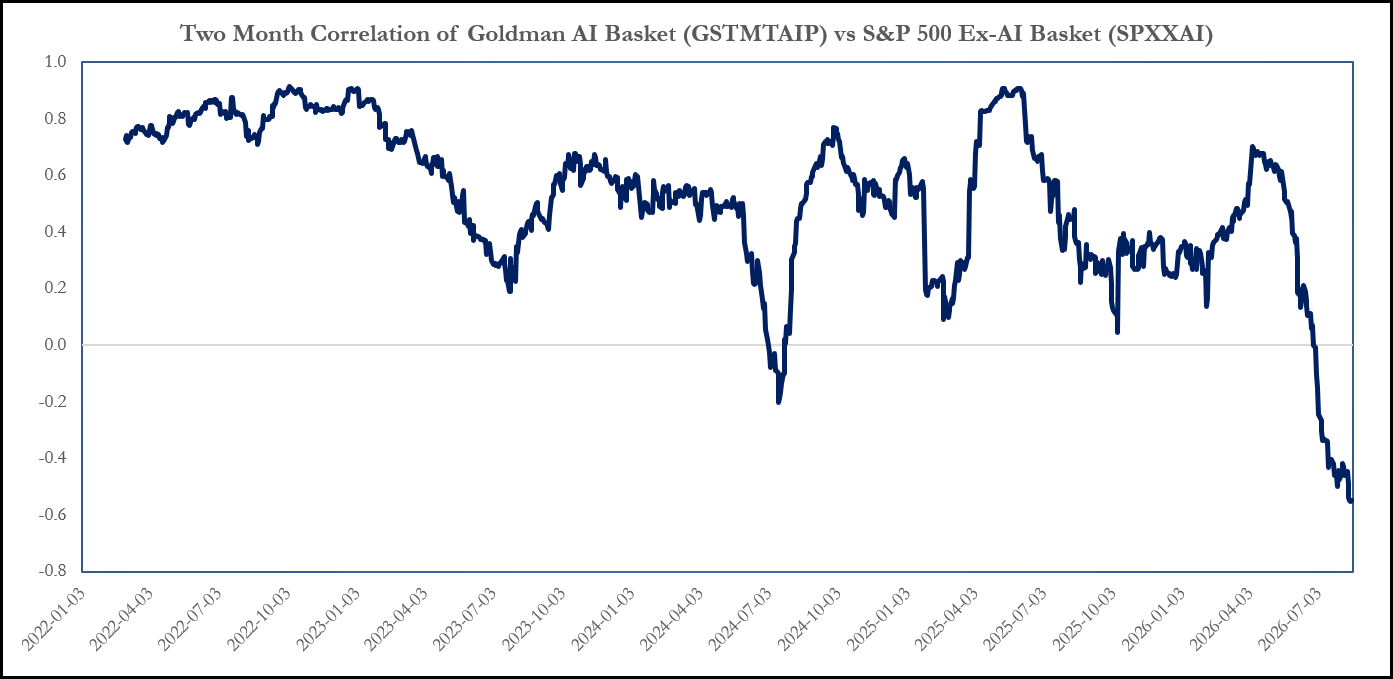
The author uses the metaphor of a "giant red velvet rope" to describe how the market separates AI infrastructure winners from other stocks, stating, "TGH is a capricious bouncer, deciding daily, like a coin flip, who gets the VIP pass." The author points out that in the capital-driven tug-of-war between AI inevitability and existential doubt, the world's largest companies often fluctuate ±8% within hours without incremental news. If a major semiconductor company reports earnings above expectations, software and "quality" factors could reflexively fall 3%, as hot money adds to momentum stocks while deleveraging other portfolios.
Macro Duality: Accelerating Capital Formation vs. Traditional Cyclical Recession
The author argues the market must hold two opposing truths simultaneously: on one hand, domestic capital formation is accelerating at a historic pace—hyperscale data center construction will surpass the largest investment cycles in modern history, evolving from equity-financed tech booms to debt-driven real estate development arms races; on the other hand, traditional cyclical industries remain in recession, real wage growth is flat, net hiring is completely stagnant, and overall spending is mainly supported by the wealth effect of the concentrated AI boom. The author quips, "The PMs at pod shops must be praying that Jensen Huang and others can keep this circular financing machine running a bit longer."
Corporate Earnings Revisions Broadly Positive, SMID Stocks Exit Three-Year Downtrend
Performance Comparison: The author emphasizes that corporate earnings revisions are the market's North Star and are "unambiguously positive." Since May, consensus earnings for large-cap companies across all GICS sectors have been revised upward, a rare breadth of positivity inconsistent with any cyclical economic peak. The net EPS revision breadth for SMID stocks rose from a trough of -28% in 2023 to +10% in Q2, exiting a three-year downtrend. The author believes the resilience of U.S. companies is impressive given the government's deliberate intensification of extreme input cost volatility.
AI Capex Extremely Concentrated, Traditional Industrials Still Contracting
The five hyperscalers account for roughly half of the Russell 3000's next twelve months' capital expenditure. Including NeoClouds and downstream AI companies, this proportion exceeds 50%. If SpaceX is added, based on its stated growth plans, another $300-500 billion in capex could be added over the next 12-18 months—SpaceX alone might require approximately 4-5 times Germany's net debt issuance for this year. Companies directly benefiting from this spending have the strongest earnings revisions and have performed reasonably. However, industrial leaders in traditional machinery remain in contraction, with residential construction, non-data center commercial building, and auto production all at lows since 2019. The author notes that, fortunately, the AI arms race is interest-rate insensitive, and they prefer companies benefiting from utility capex, viewing their certainty as higher.
Structural Risk: Cash Flow Turns Negative, AI Token Prices Decay Rapidly
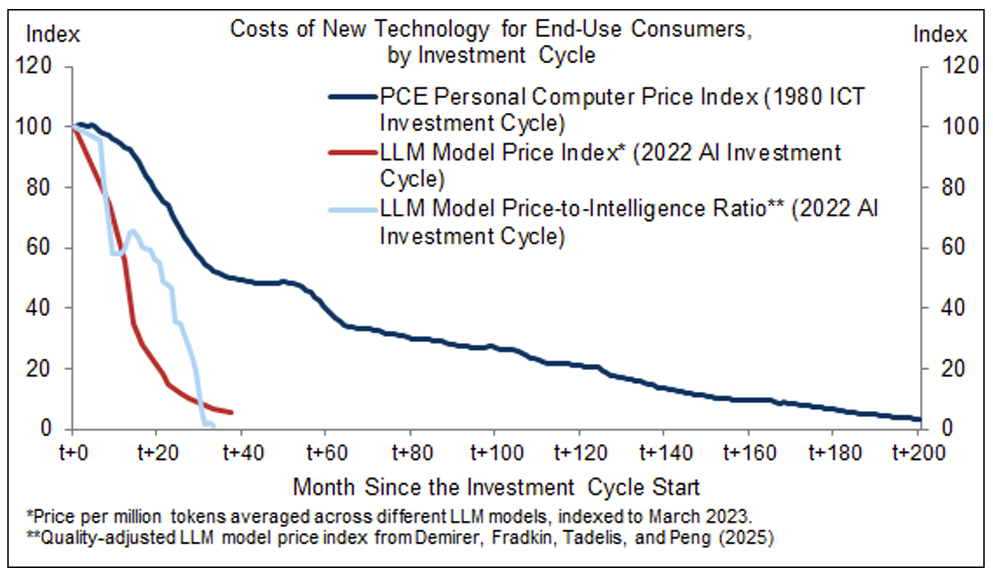
The author acknowledges that this extreme economic concentration carries undeniable structural risks. The operating cash flow of hyperscalers is now fully consumed by capex, requiring hundreds of billions in marginal investment to be financed through capital markets. This year's AI-related debt issuance is roughly twice the size of UK sovereign debt issuance. The price decay rate for AI tokens is about five times that of PC hardware prices at a comparable adoption cycle stage, even as usage continues to grow exponentially. After a cumulative $1.5 trillion in AI capex, economy-wide productivity gains have yet to appear in the data. The author states, "if open-source models continue rapidly gaining market share while downstream enterprise ROI remains lackluster, hyperscalers' and frontier labs deeply negative free cash flows could force a sobering reality check and cause someone to finally swerve in this high-stakes game of AGI chicken."
New Position: Rackspace Technology (RXT) – A High-Leverage Turnaround Play
Rackspace Technology (New Position): The author views RXT as a classic high-leverage "stub" stock turnaround opportunity. Market cap is ~$900 million ($3.42/share), enterprise value is ~$3.8 billion, and net debt is ~$2.7 billion. Majority shareholder Apollo owns ~51%, with a cost basis of ~$8.50/share, aligning interests with management. The author judges that EBITDA could recover from an estimated under $300 million in 2026 to near $800 million within 18-24 months, based on three factors: 1) Sovereign AI demand has reversed the trend of private cloud customer churn, with the first guidance for growth in 2026 and expected acceleration in 2027; 2) New management is fully committed to AI infrastructure, with a strategic partnership with Palantir (which recently took a small equity stake) to jointly offer AI strategy and cloud infrastructure; 3) The 30-megawatt compute deployment agreement with AMD is a potential game-changer, expected to generate $500-600 million in incremental revenue and $250-400 million in EBITDA, with room for expansion. The stock price has recently been pressured by the company's active adjustment of its customer mix, a downward revision to 2026 revenue guidance, and liquidity concerns that make the author slightly uneasy in the short term. However, Q2 2026 remaining performance obligations (RPO) surged 40% quarter-over-quarter to $809.1 million, with long-term RPO reaching $623 million (nearly doubling year-over-year). The author notes that Rackspace bonds have traded from distressed levels to near par, suggesting the equity is clearly underreacting from a credit perspective.
Additional Arguments and Data: Leverage, Valuation, and Industry Moat
RXT: An Option-like Bet Under High Leverage
- Leverage Risk Quantified: RXT's net debt/EBITDA ratio is ~6.5x (as of Q2 2024), far above the industry average of 2.0x. If EBITDA fails to grow to over $500 million as expected, debt amend-and-extend could face punitive interest rate increases of 300-500 basis points, further compressing equity value.
- Comparable Valuation Gap: RXT currently trades at ~4.5x EV/EBITDA, while peers like Digital Realty (DLR) and Equinix (EQIX) trade at 25x and 30x, respectively. If RXT successfully achieves its EBITDA target and restores market trust, a valuation recovery to 10x (still below the industry average) could double the stock price.
- Blue-Chip Catalyst: The financing details for the AMD chip deployment (expected to be announced in Q1 2025) are a key inflection point. If RXT secures financing support from AMD or a third party (e.g., debt swap or equity partnership), it could significantly lower the cost of capital, triggering a "virtuous cycle"—customer signings → revenue growth → credit rating improvement → lower debt costs → more investment.
VGNT: Structural Advantage of an Auto Wiring Harness Oligopolist
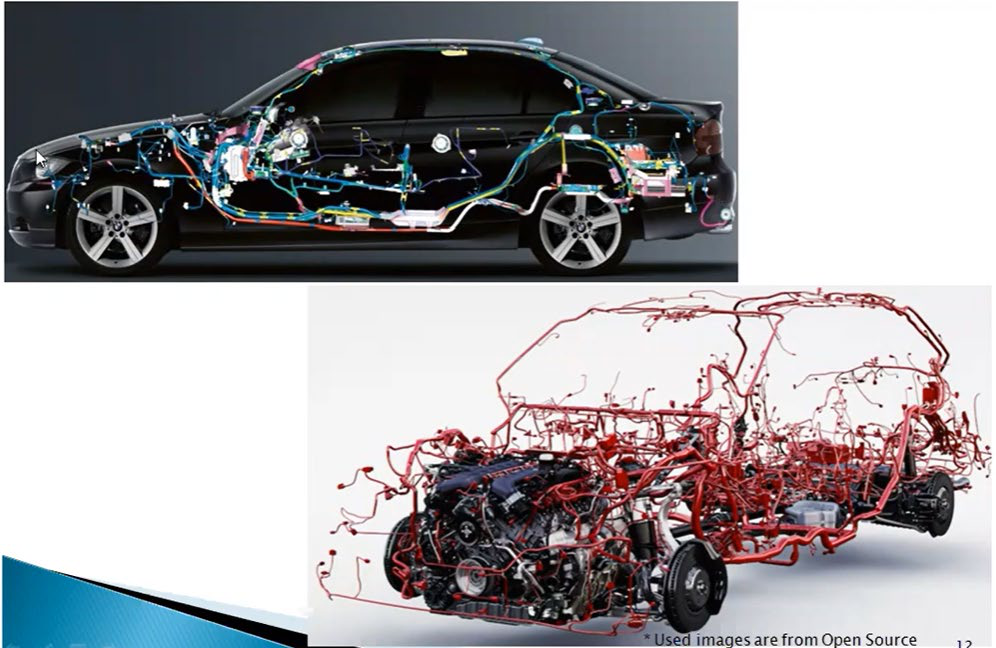
- Market Concentration: The global auto wiring harness market is controlled by five oligopolists (VGNT, Sumitomo Electric, Leoni, Aptiv, Fujikura), with a combined share of over 80%. VGNT's 16% share is not the largest, but its share in high-complexity, high-voltage platforms (EV/hybrid) reaches 33%, reflecting a technological moat.
- Profit Comparison:
| Metric | VGNT | Traditional Peers (e.g., Sumitomo Electric) |
|---|---|---|
| EBIT Margin | 12-14% | 6-8% |
| ROIC | 18-20% | 8-12% |
| Customer Concentration | Top 10 OEMs account for 70% of revenue | Top 10 OEMs account for 60% of revenue |
- China Export Dividend: Of the wiring harnesses VGNT produces in China, 35% are for export (mainly supplying global models from Tesla, BYD, etc.). In Q2 2024, global exports from Chinese OEMs grew 28% year-over-year, directly benefiting VGNT as a core supplier.
- Commercial Vehicle Potential: The global commercial vehicle wiring harness market is ~$15 billion, with VGNT's current share under 5%. By leveraging its existing engineering and manufacturing base (requiring no additional capex) to increase share to 10%, it could contribute ~$1.5 billion in incremental revenue (based on current revenue of ~$8 billion).
HILS: The Hidden Champion of U.S. Grid Infrastructure
- Valuation Discount: HILS currently trades at 8.7x EV/EBITDA, while U.S. peers AZZ (11.3x) and VMI (11.8x) trade at significant premiums. If HILS were valued in line with U.S. industrial stocks, the stock would have 30-40% upside.
- Growth Drivers: U.S. grid modernization investments (Inflation Reduction Act + Infrastructure Act) are expected to grow at a 12-15% CAGR from 2024-2030. HILS's V&S Utilities division has a record order backlog, up 40% year-over-year, and data center-related revenue (9%) is growing at an annualized rate of 20%+.
- Capital Allocation Efficiency: HILS's ROIC is 28%, higher than AZZ (15%) and VMI (12%). Management consistently enhances shareholder value through buybacks (£50 million executed in 2024) and bolt-on acquisitions (e.g., Freeberg, acquired at 7x EBIT).
DLG: Valuation Mismatch in the Coffee Machine Leader
- Business Transformation Quantified: Coffee revenue share rose from 56% in 2022 to 70% in 2024, and this segment's EBIT margin (18-20%) significantly exceeds the nutrition business (8-10%). If the coffee business were valued independently (at 15x EBITDA, the consumer brand average), its value would be ~€6 billion, exceeding the company's entire market cap (€5.9 billion), implying the nutrition business is valued as a negative asset by the market.
- Cash Flow and Dividends: DLG's free cash flow yield is ~8% (2024 estimate), and net cash accounts for 11% of market cap. The company has a stable dividend payout ratio of 40-50%, with a 2024 dividend yield of ~3.5%, higher than the European home appliance peer average of 2.0%.
- Family Governance Advantage: The De’Longhi family holds 54% of shares, aligning management and shareholder interests. Historically, the family has invested counter-cyclically during troughs (e.g., the 2020 pandemic), increasing capex by 40% from 2021-2023, driving coffee machine market share from 25% to 30%.
Summary: Common Logic of Cross-Industry Value Discovery
| Company | Core Catalyst | Source of Valuation Discount | Risk Factors |
|---|---|---|---|
| RXT | AMD financing + customer signings | High leverage + market skepticism | Liquidity crisis, dilution |
| VGNT | China exports + commercial vehicle penetration | Post-spin-off lack of recognition | Auto cycle downturn, raw material costs |
| HILS | U.S. grid + data centers | UK listing discount | UK business drag, FX |
| DLG | Coffee business revaluation | Diversification label | Consumer weakness, increased competition |
The common feature of these opportunities: The market undervalues long-term structural advantages due to short-term noise (leverage, spin-offs, geography, business structure). Our position sizes (2-5%) reflect a prudent assessment of the probability of catalysts materializing, but if the thesis plays out, the upside (50-100%+) far outweighs the downside (20-30%).
Value Revaluation of the Professional Coffee Business: Data-Driven Structural Growth and Market Misjudgment
1. Financial Characteristics of the Professional Coffee Business: High Profit, High Growth, Low Valuation
De’Longhi's professional coffee business (including La Marzocco and Eversys) exhibits a notable "dual-high" financial profile—high margins and high growth—yet the market systematically undervalues it.
| Metric | Professional Coffee | Company Total | Comparison |
|---|---|---|---|
| Revenue Share (1H 2026) | 18% | 100% | Less than one-fifth |
| EBITDA Contribution (1H 2026) | 34% | 100% | Contribution nearly double the revenue share |
| EBITDA Margin | ~30% | Not disclosed | Significantly higher than company average |
| Revenue Growth (Q2 2026) | +33% y/y | Not disclosed | 5 consecutive quarters of 30%+ growth |
| Two-Year CAGR (Q2 2026) | +86% | Not disclosed | Growth significantly accelerating |
Key Insight: The professional coffee business contributes 34% of EBITDA with only 18% of revenue, and its ~30% EBITDA margin marks it as a classic "high-profit growth engine." More notably, its two-year CAGR of 86% indicates that growth is not a one-time pulse but a structural acceleration. This combination of "high profit + high growth" is extremely rare in the consumer sector and should typically command a valuation premium, not the "zero valuation" currently implied by the market.
2. Growth Drivers: A Triple Resonance of Globalization, Chain Expansion, and Automation
The growth of the professional coffee business is not an isolated event but is driven by three major structural trends:
- Global Consumption Upgrade: The preference for specialty coffee and espresso has spread from pioneering U.S. cities like Seattle, Portland, and New York in the early 2000s to Europe, Asia, the Middle East, and second- and third-tier U.S. cities. This trend is highly correlated with rising per capita income—according to World Bank data, the global middle class surpassed 4 billion for the first time in 2025, with the Asia-Pacific region contributing 60% of new consumer spending power.
- Rapid Chain Expansion: Just two major U.S. customers—Dutch Bros (planning ~1,000 new stores by 2029) and Blackstone-backed 7 Brew (signed development agreements for 2,500+ stores)—each equip their stores with 2-3 La Marzocco machines. This implies demand for 3,000+ new store equipment from these two customers alone in the coming years. At an average price of ~$25,000 per machine (La Marzocco commercial models), equipment sales alone could reach $150-225 million.
- Automation to Address Labor Costs: Eversys targets high-traffic venues like hotels, casinos, offices, and airports, with its core value proposition being the ability to produce high-quality espresso without hiring professional baristas. According to the U.S. Bureau of Labor Statistics, the average hourly wage in the food service industry rose to $18.50 in 2025, a 28% increase from 2020, continuously improving the economics of automation substitution.
3. Business Model Moat: Installed Base → Service Revenue Flywheel
The revenue structure of the professional coffee business further reinforces its value: 24% of revenue comes from service/maintenance contracts and replacement parts. This means:
- Each new machine installed locks in high-margin service revenue for the next 5-7 years (service contract gross margins typically range from 40-50%).
- Installed base growth directly translates into predictable recurring revenue, reducing business volatility.
- Extremely high customer stickiness: Switching commercial coffee machine brands involves high switching costs related to training, supply chains, and brand image.
For La Marzocco, the average machine lifespan is 7-10 years, with annual service contract revenue equating to roughly 15-20% of the machine's selling price. This means each machine can generate service revenue equivalent to 1.0-1.4 times its initial selling price over its lifecycle.
4. Valuation Mismatch: The Professional Coffee Business is "Zero-Valued" by the Market
De’Longhi's overall valuation is currently ~8x 2026 EBITDA, while comparable high-end consumer appliance peers (SharkNinja, Breville) trade at NTM EBITDA multiples of 17.5x and 15.5x, respectively—a discount of ~50%.
| Company | NTM EBITDA Multiple | Business Profile |
|---|---|---|
| SharkNinja | 17.5x | High-end home appliances |
| Breville | 15.5x | High-end kitchen appliances |
| De’Longhi (Overall) | 8.0x | Coffee machines + nutrition + other |
| De’Longhi (Implied Professional Coffee) | ~0x | See analysis below |
Valuation Breakdown: If De’Longhi's home coffee business is valued at 12x EBITDA and the nutrition and other businesses at 7x, the weighted average multiple would be 10.5x. However, the current overall valuation is only 8x, implying that the professional coffee business is being "zero-valued" by the market—meaning the market considers its value to be zero, or even negative.
5. Value Realization Catalysts: Multiple Paths Under Family Control
The De’Longhi family holds ~53.5% of the company's shares, but more importantly, they directly hold a 26.5% stake in the professional coffee business through a separate holding entity. This dual ownership structure aligns the family's interests with minority shareholders—unlocking the value of the professional coffee business would directly increase family wealth.
Potential catalysts include:
1. IPO Window Opens: According to the original transaction documents signed with La Marzocco's sellers in February 2026, the IPO window for the professional coffee business is now officially open. If the market continues to undervalue it, the family has a strong incentive to pursue an IPO to realize value.
2. Increased Disclosure: The company has begun to increase financial disclosures for the professional coffee business, which should help the market reprice it.
3. Minority Stake Acquisition: Acquiring the remaining minority stake in the professional coffee business could simplify the structure, paving the way for a spin-off or IPO.
4. Spin-off or Portfolio Simplification: Listing the professional coffee business independently would create the only "pure-play specialty coffee" stock in the public market, potentially attracting a higher valuation multiple.
6. Macro Backdrop: A "Perfect Storm" for Small-Cap Value Return
The current macro environment provides a favorable backdrop for mid- and small-cap value stocks like De’Longhi:
- Valuation Inversion: The valuation discount of small caps relative to large caps is at historically extreme levels, and historically, such discounts have often foreshadowed future excess returns.
- Fundamental Inflection Point: After years of industrial recession, earnings revision trends for small caps have turned positive (the SMID-cap net EPS revision breadth index rose from -28% in 2023 to +10% in 2026).
- M&A Activity: Corporate action-driven catalysts are accelerating, creating a "fertile hunting ground" for active stock selection.
Core Conclusion: De’Longhi's professional coffee business is a systematically undervalued, high-profit growth engine with clear paths to value realization (IPO, spin-off, increased disclosure), and the family control structure ensures aligned interests. The current 8x EBITDA valuation implies the absurd assumption of "zero value" for the professional coffee business. As growth continues, disclosure increases, and catalysts materialize, this mismatch is likely to be corrected within 12-18 months.
Additional Arguments and Data: Structural Industry Growth and Company Strategy Execution
1. Power Infrastructure and Data Centers: Dual Structural Tailwinds
Hill & Smith PLC's performance report further validates the long-term demand for power infrastructure and data center construction. In the first half of 2026, the grid infrastructure business accounted for 24% of group revenue, and the V&S Utilities division's order backlog reached an all-time high (xxxii). This data indicates that the global grid upgrade and expansion demand cycle is accelerating, particularly driven by the U.S. Infrastructure Investment and Jobs Act (IIJA) and Europe's "REPowerEU" plan, pushing the utility capex cycle into an upswing.
Simultaneously, data center-related revenue accounted for 9% of group revenue, and within the business acquired through Freeberg, approximately 50% of sales come from data center construction (xxxiii). This reflects the direct pull from AI and cloud computing on power demand. According to the International Energy Agency (IEA), global data center electricity consumption is projected to account for over 3% of total global electricity by 2026, doubling from 2023. Hill & Smith's order data is highly consistent with this trend.
Financial Health: The company's net debt/EBITDA is only 0.4x, ROIC is above 20%, and it is executing a £100 million share buyback program (xxxiv). This demonstrates disciplined capital allocation while returning cash to shareholders through buybacks, aligning with value creation logic.
2. Coffee Machine Industry: De’Longhi's Category Expansion and Profit Model Upgrade
De’Longhi Group disclosed at its 2026 Capital Markets Day that coffee revenue as a share of group revenue has risen from 56% in 2022 to 70% (xxxvi). This structural shift is driven by two key factors:
- Professional Coffee has achieved over 30% year-over-year growth for five consecutive quarters, with Q2 2026 growth reaching 33% (xxxvii). This is primarily due to channel expansion for high-end brands like La Marzocco and the global trend in specialty coffee consumption.
- Service and maintenance contracts account for 24% of professional coffee revenue (xl), providing a high-margin, recurring revenue stream. This shifts De’Longhi's business model from one-off hardware sales to a "hardware + service" hybrid model, enhancing revenue visibility and customer stickiness.
Valuation Comparison: De’Longhi's NTM EV/EBITDA is only 8x, while comparable high-end small appliance companies SharkNinja and Breville trade at 17.5x and 15.5x, respectively (xli). This discount partly stems from market concerns about liquidity due to the De’Longhi family's controlling stake (~53.5%), but it also offers potential for value re-rating. If De’Longhi can consistently demonstrate the growth sustainability of its professional coffee business, a valuation convergence with peers is likely.
3. Coffee Chain Expansion: Downstream Demand Validates Upstream Equipment Logic
The expansion plans of U.S. coffee chains Dutch Bros and 7 Brew provide downstream validation for De’Longhi's professional coffee equipment demand:
- Dutch Bros plans to add approximately 1,000 new stores by 2029 (xxxviii).
- 7 Brew has signed over 2,500 development agreements (xxxix).
The coffee equipment procurement for these stores will directly benefit De’Longhi's professional brands like La Marzocco and Nuova Simonelli. Based on industry experience, a new store typically requires 2-3 espresso machines, with unit prices ranging from $10,000 to $30,000. The expansion plans of Dutch Bros and 7 Brew alone could generate hundreds of millions of dollars in incremental revenue for De’Longhi over the next 3-5 years.
4. Key Financial Metric Comparison
| Metric | Hill & Smith (2026 H1) | De’Longhi (2026 Q2) | Industry Reference |
|---|---|---|---|
| Net Debt/EBITDA | 0.4x | Net cash ~€687 million | Typically <2x is healthy |
| ROIC / ROCE | High 20%+ | ~30% | Consumer average 15-20% |
| Valuation Multiple | Not disclosed | 8x EBITDA | Peers 15-17x |
| Buyback Plan | £100 million | No clear plan | - |
Data Sources: xxxiv, xxxv, xli
5. Governance and Capital Structure: The Double-Edged Sword of Family Control
The De’Longhi family holds ~53.5% of the equity and directly owns a 26.5% interest in the professional coffee business (Professional Coffee Hub) (xlii). While this structure provides long-term strategic stability, it also introduces the following risks:
- Liquidity Discount: Family control results in a smaller free float, which may suppress valuation.
- Related-Party Transaction Risk: The 2023 La Marzocco transaction terms indicate that the IPO window for the professional coffee business will open in February 2026 (xliii). If the IPO is priced below expectations, it could negatively impact the parent company's valuation.
However, from a positive perspective, family control also means management and shareholder interests are highly aligned, and De’Longhi has historically demonstrated disciplined capital allocation (net cash, high ROCE).
Summary
The additional data further reinforces the following investment logic:
1. Power and Data Centers: Hill & Smith's order backlog and financial health indicate that this sector is in an upward capex cycle, and the company possesses a defensive balance sheet.
2. Professional Coffee: Through category upgrades and a service-oriented transformation, De’Longhi is evolving from a low-valuation consumer goods company into a high-growth, high-margin professional equipment and service provider. The expansion plans of downstream chains provide visible incremental demand.
3. Valuation Mismatch: De’Longhi's 8x EBITDA represents a significant discount to peers at 15-17x. If growth persists, the potential for re-rating is substantial. The family control structure is a primary risk but also a source of long-term stability.
Summary
This continuation is not merely a legal disclaimer but serves as a "roadmap" for Voss Fund's risk management. Through its exhaustive classification of risks, explanation of benchmark comparison limitations, and warnings about emerging technology risks, it establishes an information symmetry framework between the investor and the fund manager. For professional investors, understanding these terms is a prerequisite for assessing whether the fund matches their risk appetite; for regulators, such disclosures are key to determining whether a fund operates in compliance.
Position Moves
| Ticker | Direction | Author's One-Sentence View | Key Data |
|---|---|---|---|
| Rackspace Technology (RXT) | New Position | A high-leverage turnaround play; EBITDA recovery + AMD partnership are core catalysts | Market cap $0.9B, EV $3.8B, net debt $2.7B, net debt/EBITDA 6.5x, EV/EBITDA 4.5x |
| De’Longhi (DLG) | Hold & Watch | Professional coffee business is systematically undervalued by the market, with significant valuation repair potential | Overall 8x EBITDA vs peers 15-17x, professional coffee EBITDA margin ~30%, revenue growth +33% y/y |
| Hill & Smith (HILS) | Hold & Watch | A hidden champion in US grid infrastructure, with a clear valuation discount | EV/EBITDA 8.7x vs US peers 11-12x, ROIC 28%, order backlog +40% y/y |
| VGNT | Hold & Watch | Automotive wiring harness oligopoly; technology barriers + China export dividend | EBIT margin 12-14%, ROIC 18-20%, commercial vehicle market share <5% |
| Palantir | Not Disclosed | Strategic partnership with RXT, holds a small equity stake | Specific data not disclosed |
| AMD | Not Disclosed | Signed a 30 MW computing capacity deployment agreement with RXT; potential game changer | Expected to generate $500-600M incremental revenue and $250-400M EBITDA |