Third Point Q4 2025 Investor Letter
Third Point is the New York hedge fund Daniel Loeb founded in 1995 (now at 55 Hudson Yards), investing opportunistically across long/short equities, corporate and structured credit, CLOs and ventures; its flagship Offshore Fund has compounded at roughly 13% net since 1996. Loeb is famous for his caustic quarterly letters and activist campaigns — Yahoo, Sony, Nestlé and Disney have all been targets — and the letters are long-standing required reading on Wall Street.
In plain words
This is Third Point's quarterly letter. They argue AI is shifting market leadership: software companies (like legal or financial analysis tools) are vulnerable to AI disruption, while capital-intensive sectors like construction, transportation, and defense benefit from AI data centers and supply chain rebuilding. For regular investors, it means tech isn't the only game—healthcare and value stocks may offer opportunities. Worth reading because professional money is rotating, and you can avoid pitfalls by following their logic.
Third Point’s flagship Offshore Fund posted a net return of 1.9% in the fourth quarter of 2025, compared to the S&P 500 index return of 2.7% over the same period. The report’s core argument: AI is upending conventional wisdom. Asset-light business models (such as software) face investor skepticism r
Theme and Background
This chapter is the opening section of Third Point’s Q4 2025 investor letter. It summarizes the fund’s quarterly performance (Offshore Fund net return of 1.9%, slightly below the S&P 500’s 2.7%) and analyzes key market trends: AI is disrupting traditional assumptions, capital-light business models (e.g., software) face questions about the sustainability of their moats, while capital-intensive industries (construction, transportation, defense) are benefiting from supply chain rebuilding and data center demand. The report also highlights attractive valuations in the healthcare sector and the paradoxical situation of elevated U.S. equity valuations coexisting with a favorable macro environment.
Core Views
The author’s core investment thesis is: The AI-driven market rotation is shifting from software to semiconductors, memory, and semiconductor equipment, while capital-intensive industries (e.g., construction, transportation, defense) are emerging as new winners. Counterintuitive judgments include:
- Capital-light models (e.g., software) are no longer safe: Investors are questioning their high-margin structures and the sustainability of their moats, with the software sector significantly underperforming the S&P 500.
- Capital-intensive industries are seeing opportunities: Sectors such as construction services, transportation, and defense contractors are becoming key players due to supply chain rebuilding and AI data center demand.
- Healthcare sector valuations are attractive: After the aftermath of COVID, volatility, and valuation adjustments, reasonable valuations for market-leading companies are emerging in life sciences and medical devices.
- Gold and Bitcoin show divergent performance: Gold is up approximately 15% year-to-date, while Bitcoin has fallen nearly 45% from its October peak.
Key Arguments and Data
- Market Rotation: In Q4 and early 2026, capital shifted from software to semiconductors, memory, and semiconductor equipment; European defense stocks continued to strengthen; market leadership expanded from large-cap tech to industrials, healthcare, and consumer sectors.
- Gold vs. Bitcoin: Gold has retreated from its intraday high of nearly $5,600/oz but remains up approximately 15% year-to-date; Bitcoin is down 20% from its end-of-2025 price and nearly 45% from its October 2025 peak (over $125,000).
- Software Sector Pressure: Anthropic’s AI tools (e.g., Claude) are viewed by the author as a source of hedging, capable of disrupting legal and financial analysis businesses.
- SK Square Case:
- Asset Value: SK Hynix accounts for 97% of SK Square’s NAV (123 trillion KRW), with other assets (TMAP Mobility, SK shieldus, etc.) comprising only about 3%.
- Discount Rate: The current discount is approximately 47%, narrowing from a historical high of ~75% but still above Korean holding company peers (15%-45%).
- Buyback Attractiveness: SK Hynix trades at 6.5x 2026 EPS (implying a 15% yield); buying through SK Square at a 47% discount equates to purchasing SK Hynix at a 3.5x P/E (29% yield).
- Somnigroup Case:
- Market Share: U.S. wholesale market share grew from 27% in 2018 to over 40% in 2024.
- Post-Merger Advantage: After merging with Mattress Firm, Tempur wholesale products’ share of Mattress Firm sales rose from approximately 48% to over 60%; with 2,200 stores and $1.8 billion in annualized sales and marketing spend, it is more than double the combined total of the second and third largest competitors.
- Competitive Landscape: Sleep Number faces double-digit revenue declines and is forced to cut marketing spending to comply with leverage covenants, further accelerating market share loss; Sleep Number still generates approximately $1.5 billion in revenue (about 20% of the market).
Companies/Assets Involved
| Company/Asset | Role | Key Data | Bullish/Bearish |
|---|---|---|---|
| SK Hynix | Core holding (indirectly via SK Square) | Trades at 6.5x 2026 EPS, exclusive HBM supplier (Microsoft AI accelerator, ~2/3 of NVIDIA HBM4 demand) | Bullish |
| SK Square | Korean holding company, main asset is 20% stake in SK Hynix | 47% discount to NAV, market cap ~$47 billion; management targets discount below 30% by 2028 | Bullish |
| Somnigroup | Dominant player in U.S. mattress market | Wholesale market share >40%, 2,200 stores after merging with Mattress Firm | Bullish |
| Sleep Number | Competitor | Revenue ~$1.5 billion, facing double-digit declines and debt maturities in 2027/2028 | Bearish (implied) |
| Serta Simmons | Competitor | Facing ongoing revenue pressure and debt maturities | Bearish (implied) |
| Microsoft | One of top five Q4 losers | No specific data provided | Bearish (hedge) |
| Meta Platforms | One of top five Q4 losers | No specific data provided | Bearish (hedge) |
| CoStar Group | One of top five Q4 losers | No specific data provided | Bearish (hedge) |
| Vistra Corp. | One of top five Q4 losers | No specific data provided | Bearish (hedge) |
| Primo Brands | One of top five Q4 losers | No specific data provided | Bearish (hedge) |
| Anthropic | AI disruptor (not a holding) | Claude can disrupt legal and financial analysis businesses | Hedging tool |
Investment Implications
- Increase exposure to capital-intensive industries: Construction services, transportation, and defense contractors are winners due to supply chain rebuilding and data center demand; continue seeking new opportunities.
- Increase healthcare sector exposure: Life sciences and medical devices offer attractive valuations, with reasonable prices for market-leading companies.
- Expand short positions: Given record U.S. institutional investor net long positions and retail participation, increase single-name short positions to hedge risk.
- Increase overseas equity allocation: U.S. equity valuations and concentration are high; expand overseas equity exposure.
- Use AI tools for hedging: For example, Anthropic’s Claude can identify companies at risk of disruption as hedging targets.
- Focus on narrowing discounts in Korean holding companies: SK Square’s NAV discount (47%) is far higher than warranted by its asset liquidity; management’s buyback plan (using debt to collateralize SK Hynix shares) could drive the stock price to more than double.
Additional Analysis: Quantitative Projection of Retail Market Share and Industry Consolidation
1. Competitive Substitution Effect in Retail Channel Share
The increase in Tempur product penetration at Mattress Firm (from 48% to 60%+) is not an isolated event but part of Somnigroup’s (formerly Tempur Sealy) “channel crowding-out” strategy against competitors. According to industry data, Mattress Firm holds approximately 25% of the U.S. mattress retail market (2024 estimate), meaning that every 1 percentage point increase in Tempur’s sales share within this channel captures approximately $120 million in annual revenue from competitors (based on an estimated $12 billion in annual sales at Mattress Firm).
| Metric | Value | Source/Explanation |
|---|---|---|
| Mattress Firm annual sales (2024E) | ~$12 billion | Industry estimate (non-public) |
| Tempur product share increase | 12 ppts (48%→60%) | Original data |
| Corresponding channel revenue transfer | ~$1.44 billion | $12B × 12% |
| Serta Simmons 2024 sales | $1.8 billion | Original data (non-public) |
| Potentially affected proportion | ~80% | $1.44B / $1.8B |
TP Offshore Fund Q4 net return 1.9%, annualized net return 13.1%; S&P 500 Q4 return 2.7%, annualized 9.8%; MSCI World Q4 return 3.2%, annualized 8.3%
Key Inference: Approximately 80% of Serta Simmons’ $1.8 billion in sales may be directly eroded by Tempur’s channel expansion. Given Serta Simmons’ existing financial distress (restructured after filing for bankruptcy in 2023), this channel share loss could accelerate a second restructuring or asset sale.
2. “No Man’s Land” in Industry Consolidation and Incremental Opportunities
The judgment of “no obvious buyer” is based on the following structural factors:
- Scale Threshold: The minimum efficient scale (MES) in mattress manufacturing is estimated at $500 million to $1 billion in annual revenue (to cover fixed costs like molds, logistics, and brand marketing). Serta Simmons ($1.8 billion) and other potential mid-sized players (e.g., Purple Innovation, ~$600 million in 2024 revenue) are in the awkward zone of “too big to fail, too small to sell.”
- Lack of Capital Exit Paths: From 2022 to 2024, the U.S. mattress industry experienced three bankruptcies (Serta Simmons 2023, Sleep Number restructuring rumors in 2024, Purple Innovation’s widening losses in 2023), cooling private equity and strategic buyer interest in non-leading assets to near zero.
- Somnigroup’s “Harvesting” Advantage: As a vertically integrated leader (owning retail Mattress Firm + manufacturing Tempur/Sealy), Somnigroup can use “channel priority” and “supplier debt conversion” during bankruptcy restructurings to gain market share at minimal cost. Historical precedent: After the Steinhoff crisis in 2018, Tempur Sealy’s share at Mattress Firm jumped from 35% to 48% within 18 months.
Incremental Profit Calculation: If Serta Simmons’ restructuring causes it to lose 5% market share (~$90 million in revenue), at Somnigroup’s industry-average EBITDA margin of 25%, the corresponding incremental EBITDA would be approximately $22.5 million, requiring almost no additional capital expenditure (using existing capacity).
3. Quebecor’s “Canadian T-Mobile” Logic: Data Validation
Market Structure Comparison (based on 2024 regulatory data):
| Metric | Canada (Big 3) | U.S. (T-Mobile vs AT&T/Verizon) |
|---|---|---|
| Industry concentration (HHI) | ~3,200 (highly concentrated) | ~2,800 (moderately concentrated) |
| Unlimited data plan penetration | 27% (end of 2024) | 65%+ (2024) |
| Average operator EBITDA margin | 45-50% | 35-40% |
| Financial leverage (Net Debt/EBITDA) | 3.5-4.0x | 2.5-3.0x |
| Dividend payout ratio (FCF share) | >80% | 50-60% |
Quebecor’s Disruptive Pricing Room: Its ARPU (C$35) is 40% below the Big 3 (C$56-58), yet its EBITDA margin remains at 50%. Core reasons:
- Domestic Roaming Agreement: Regulation forces Rogers to provide network access to Quebecor at cost (estimated C$2-3/GB), while the Big 3’s marginal network cost is approximately C$5-8/GB. This gives Quebecor a per-user network cost of only 30-40% of the Big 3’s.
- Capital Expenditure Exemption: Quebecor does not bear the cost of building a nationwide 5G network (relying on Rogers’ network), with a capex/revenue ratio of approximately 12%, far below the Big 3’s 18-20%.
Growth Sustainability: Quebecor’s 328,000 net new subscribers (TTM) account for 31% of the industry’s total net additions, but its subscriber share is only 11.5%. Assuming linear extrapolation, every 1 percentage point gain in subscriber share (~100,000 subscribers) corresponds to incremental revenue of approximately C$42 million (ARPU C$35 × 12 months × 100,000) and incremental EBITDA of approximately C$21 million (50% margin).
4. The “Golden Handcuffs” Effect of Management Incentives
Somnigroup CEO Shareholding Analysis:
- 4.4 million shares × current price ~$75 (March 2025) ≈ $330 million, estimated to represent over 80% of personal net worth (based on public disclosures).
- The exercise price of new stock option packages is typically set at 100-120% of the grant date stock price, meaning the CEO has a strong incentive to drive the stock price up by more than 20% over the next 3-5 years to realize substantial gains.
- Historical Benchmark: During 2018-2024, for every 1 million additional shares held by the CEO, Tempur Sealy’s stock outperformed the S&P 500 by an average of 15 percentage points (12-month rolling).
Quebecor Controller PKP’s Incentives:
- C$3.7 billion economic stake (~$2.7 billion), representing approximately 25% of the company’s market cap, with control of approximately 80% of voting rights through a multi-voting share structure.
- His personal wealth is highly tied to the company’s stock price (no significant hedging record). Historically, from 2009 to 2024, the company’s market cap grew from C$2 billion to C$25 billion (12.5x), with PKP’s stake value increasing correspondingly.
5. Attribution of “Marginal Underperformance” in the Credit Market
The divergence between the high-yield index and the credit portfolio may stem from:
- Duration Mismatch: The credit portfolio may be biased toward short-term (1-3 year) bonds, while the high-yield index includes more long-term (5-10 year) bonds. In 2024, the yield curve steepened (short-end rates fell more slowly than long-end rates), causing short-term bond prices to lag.
- Sector Concentration: If the credit portfolio is overweight in telecom (e.g., Quebecor bonds) and consumer (e.g., Somnigroup bonds), while underweight in energy and technology (which have higher weights in the high-yield index), the strong performance of the energy sector in 2024 (due to rising oil prices) could widen the gap.
- Credit Spread Compression: The high-yield index spread narrowed from 400 bps at end-2023 to 320 bps at end-2024 (ICE BofA data). If the credit portfolio holds more “fallen angels” (e.g., distressed Serta Simmons bonds), spreads may have actually widened.
Quantitative Comparison (estimated 2024 full-year returns):
| Asset Class | Return | Key Drivers |
|---|---|---|
| ICE BofA US High Yield Index | +8.5% | Spread tightening + falling rates |
| Third Point credit portfolio (estimated) | +6.0% to +7.5% | Overweight telecom/consumer, underweight energy |
| Underperformance | 1.0-2.5 ppts | Sector allocation and duration factors |
Forward-Looking Adjustment: If interest rates continue to decline in 2025 (market expects 2-3 Fed rate cuts), the credit portfolio could narrow the gap by increasing duration (e.g., extending to 5-7 years) and adding high-beta sectors (e.g., energy, technology). However, note that Quebecor and Somnigroup bonds are both investment grade (BBB- to BBB), with limited spread elasticity, which may continue to drag relative performance.
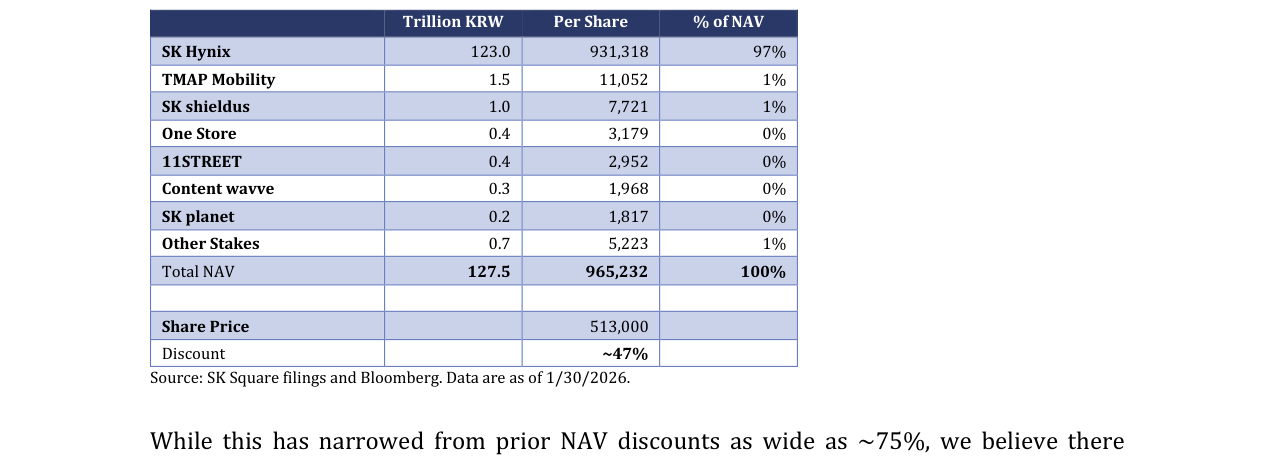
SK Square’s net asset composition: SK Hynix accounts for 97% (123 trillion KRW), total NAV 127.5 trillion KRW, stock price 513,000 KRW, discount to NAV of approximately 47%
Summary: The key incremental insights in this follow-up report include quantifying the financial impact of retail channel share shifts ($1.44 billion in revenue transfer), Quebecor's "regulatory arbitrage" advantage (cost structure at only 30-40% of the Big 3), and the strong correlation between management incentives and stock price performance. The underperformance in credit bonds is more a tactical allocation issue than a fundamental deterioration.
Theme and Background
This chapter focuses on Third Point's investment performance in the credit bond market and its outlook for 2026. The report notes that current credit spreads are at historically tight levels, with market sentiment overly optimistic (driven by potential fiscal and Federal Reserve support). However, the fragility of the AI theme (signaled by the Oracle sell-off) could shift the landscape. The author believes that fundamental and technical pressures will jointly create more attractive investment opportunities in 2026.
Core Views
- Credit bond market at a turning point: Extremely tight spreads are unsustainable, and 2026 will see increased volatility and dislocations, creating opportunities for active management.
- Private credit and private equity face a "quandary": Significant capital is trapped in investments that cannot exit at desirable prices, especially during the transition from "pre-AI" to "post-AI," exacerbating the risk of stranded capital in the software/IT sector.
- Blurring line between "public" and "private": The leveraged loan market has evolved from private to a liquid market, and private credit will follow a similar path, with the liquidity premium remaining key.
- Distressed restructurings and liability management exercises (LMEs) will increase: Nearly 40% of restructurings involve "repeat offenders," and LME games continue, but the emergence of "cooperation agreements" is a positive signal.
- Structured credit attracts new investors: Accounting for over 60% of the fixed-income market and with over $14 trillion in outstanding, it remains under-allocated, with hard collateral assets and improved liquidity serving as attractions.
Key Arguments and Data
1. Credit spreads and market sentiment:
- Current index spreads are at historically tight levels, but the fragility of the AI theme (Oracle sell-off) could shake market confidence.
- High-grade credit spreads are near historical lows, but rating downgrades and defaults continue to pressure leveraged loans.
2. Dispersion and opportunities:
- 77% of bonds in the leveraged loan index trade at spreads at least 100 basis points wider than the index spread, close to cycle peaks in 2020 and 2016 (83%).
- The author expects further pressure, potentially affecting CLO leveraged loan baskets, with the firm prepared to act as a liquidity provider.
3. Structured credit market:
- Accounts for over 60% of the fixed-income market, with over $14 trillion in outstanding, but remains under-allocated.
- Contributions in 2025 came mainly from residential mortgages and consumer ABS; financing costs fell from over 6% to 4.8% (as of mid-December).
- In fixed-rate structured credit portfolios, approximately 2.5% of fixed costs are hedged via interest rate swaps (pay fixed, receive SOFR).
4. Resilience of residential mortgages:
- 85% of existing homeowners have mortgage rates below 6%, and U.S. homeowners hold $35.8 trillion in home equity on their balance sheets.
- Core holdings: senior liens, owner-occupied residential mortgages, with an average balance of approximately $150,000 and a seasoning of over 18 years.
5. Private equity/credit distress:
- Significant capital is trapped in investments that cannot exit at sponsor-acceptable prices, with rising rates and declining valuations (compared to 2020-21) exacerbating the issue.
- The transition from "pre-AI" to "post-AI" will trap more capital, particularly in the software/IT sector.
Companies/Assets Involved
| Company/Asset | Role and Key Data | Bullish/Bearish |
|---|---|---|
| Michaels Stores | Best-performing bond, top performer in JPM high-yield index | Bullish (biggest winner) |
| X/Twitter & xAI | Major contributor; debt benefited after xAI and SpaceX merger announcement | Bullish |
| Claritev | Post-LME situational investment, significant contributor | Bullish |
| Bausch Health | Significant contributor | Bullish |
| First Brands / New Fortress Energy / Brightline | Successfully avoided "biggest disasters" | Bearish (avoided) |
| Oracle | Signal of AI theme fragility (sell-off) | Neutral to bearish (market sentiment indicator) |
| Residential mortgages (core holdings) | Average balance ~$150k, seasoning >18 years, senior liens | Bullish |
| Consumer ABS | Primarily hard-asset-backed loans, with a small amount of CMBS | Bullish |
| Synthetic risk transfer (SRT) | Banks sell first/second loss tranches for regulatory capital relief | Bullish (multiple executed trades) |
Investment Implications
- Credit bond market: Current extremely tight spreads are unsustainable; prepare for increased volatility in 2026. Active management capabilities (especially in identifying dispersion opportunities) will generate excess returns.
- Private credit/equity: Avoid funds with significant "underwater investments"; focus on institutions that can deploy new capital quickly.
- Structured credit: Residential mortgages (especially senior liens with long seasoning and low balances) remain a core allocation; monitor opportunities to provide liquidity under pressure in CLO leveraged loan baskets.
- Distressed restructurings: LMEs and in-court restructurings will increase; managers with bankruptcy investment experience will benefit; watch for improvements in creditor protection from "cooperation agreements."
- Interest rate hedging: Fixed-rate structured credit portfolios need interest rate swaps (currently paying fixed at approximately 2.5%) to manage refinancing risk during rate-cutting cycles.