4Q25 Small-Cap Fund Commentary
Southeastern Asset Management is a Memphis-based deep-value firm founded in 1975 by O. Mason Hawkins to exploit the bargains left by the 1973-74 bear market. Its flagship Longleaf Partners Funds (launched 1987) invest employees' own money alongside clients'. Following Graham's discipline and its "Business, People, Price" framework, it runs concentrated books of 15-25 undervalued stocks held for the long term — famously closing funds to new investors when opportunities were scarce. CEO and Head of Research Ross Glotzbach now leads the firm, which publishes quarterly Longleaf fund commentaries and Research Perspectives notes.
In plain words
This fund commentary explains why the small-cap fund trailed the Russell 2000 in 2025 but claims its holdings are better quality. Most of the index's gains came from low-quality, unprofitable companies—a bubble similar to 1999, the manager argues. The fund keeps 15.8% cash to deploy when the hype fades. Only 10% of its stocks fell over 20%, versus 15–20% of the index dropping 40–50%. It highlights specific bets like Becle (tequila brand), GCI (Alaska telecom monopoly), and Mattel. For ordinary investors, the lesson: don't confuse a good company with a good stock price.
Southeastern (Longleaf Partners) Small-Cap Fund 2025 Annual Review The fund delivered a full-year return of 7.56%, underperforming the Russell 2000's 12.81% and the Russell 2000 Value's 12.59%. However, the fund's price-to-value (P/V) ratio stands in the low 60% range, with cash at 15.8% and a portf
Theme and Background
This section is the introductory part of the Longleaf Partners Small-Cap Fund's 2025 Annual Commentary, primarily discussing the fund's performance in 2025 versus the market environment. The report notes that although the fund's full-year return of 7.56% lagged behind the Russell 2000's 12.81% and the Russell 2000 Value's 12.59%, the intrinsic development of the fund's holdings outperformed the stock price performance. The main reason is that over 35% of stocks in the Russell 2000 rose by more than 70%, while only 15% of the fund's holdings averaged a 30% gain, with low-quality, unprofitable companies continuing to lead.
Core Thesis
The author's core investment argument is that the current market environment resembles 1999, where the rebound in low-quality stocks is unsustainable. The financial resilience of the fund's holdings (with leverage ratios far below those of 2007 and 2021) will provide an advantage when the market turns. Counterintuitive judgments include: 75% of the fund's holdings are concentrated in the -20% to +20% return range, with average performance exceeding the index's 0% return; only 10% of holdings fell more than 20%, with an average loss of 30%, far below the index's 15-20% of holdings and 40-50% decline, and no permanent capital losses occurred.
Key Arguments and Data
1. Market Structure Comparison: Over 35% of stocks in the Russell 2000 averaged a gain of 70%+, while only 15% of the fund's holdings averaged a 30% gain. In the fourth quarter, unprofitable companies outperformed profitable ones by an average of over 500 basis points.
2. Portfolio Concentration: 75% of the fund's holdings are in the -20% to +20% return range, compared to just over 40% for the index; the fund's average performance in this range exceeds the index's 0% return.
3. Downside Protection: Only 10% of the fund's holdings fell more than 20%, with an average loss of 30%, compared to 15-20% of the index's holdings and a 40-50% decline.
4. Leverage Level Comparison: The spread between the bond and debt yields of the fund's current holdings relative to the 10-year U.S. Treasury yield is approximately half the level seen in 2007 and 2021.
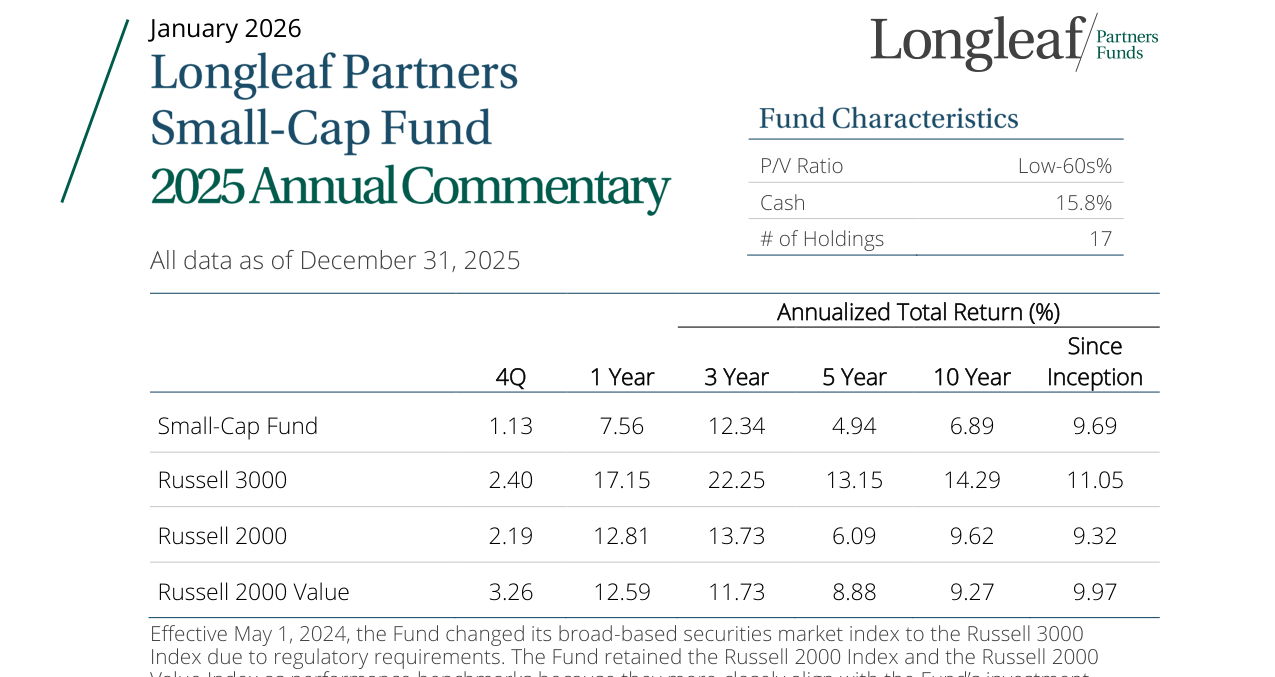
The Small-Cap Fund returned 1.13% in Q4 2025, 7.56% over the past year, 12.34% annualized over three years, and 9.69% annualized since inception, underperforming the Russell 3000's 17.15% and 11.05% over the same periods.
| Metric | Fund Holdings | Russell 2000 |
|---|---|---|
| Holdings with Gain >20% | 15% | >35% |
| Average Gain for Holdings with Gain >20% | 30% | 70%+ |
| Holdings with Decline >20% | 10% | 15-20% |
| Average Decline for Holdings with Decline >20% | 30% | 40-50% |
| Holdings in -20% to +20% Range | 75% | Just over 40% |
| Average Return in this Range | Better than 0% | 0% |
5. Rule Adjustment: The holding limit was raised from 6.5% to 8%, citing reasons including no significant historical performance difference in the research team, increased participation, and improved tax efficiency.
6. Cash and Kodak: Kodak convertible preferred shares were sold at fair value in the fourth quarter; cash represents 15.8% of the portfolio, having a minimal impact on the full year but providing ammunition for 2026.
Companies/Assets Involved
- White Mountains: A key offensive holding within the -20% to +20% range, with positive developments.
- CNX: A key offensive holding, same as above.
- Rayonier and PotlatchDeltic: Holdings involved in an upcoming merger, same as above.
- Kodak: Convertible preferred shares were sold at fair value in the fourth quarter; the author states no similar investments will be made in the future.
- Anywhere Real Estate: A leverage-related holding that contributed positive returns to the market this year, but the author believes the leverage rule should have been implemented earlier.
Investment Implications
1. Unsustainable Low-Quality Rebound: The current rally in low-quality, unprofitable companies could reverse rapidly. The financial resilience of the fund's holdings (leverage spread only half of 2007/2021 levels) will generate excess returns when the market turns.

2. Focus on Portfolio Concentration: 75% of the fund's holdings are concentrated in a narrow fluctuation range, and their average performance exceeds the index, suggesting the intrinsic value of core holdings is being underestimated by the market.
3. Significantly Reduced Leverage Risk: The debt yield spread of the fund's current holdings is far below historical highs. Bond market signals validate the portfolio's resilience, providing downside protection for the future.
4. Value of Cash Reserves: The 15.8% cash allocation provides flexibility in the high-valuation market environment of 2025. The author believes cash will be more valuable in 2026 when market multiples are higher.
5. Rule Optimization: Raising the holding limit from 6.5% to 8% enhances participation and tax efficiency, but attention must be paid to whether it leads to excessive concentration risk.
Additional Arguments, Data, and Perspectives
1. Becle: Value Capture Amid Tariff Uncertainty and Industry Headwinds
- Key Event: Becle experienced a price dislocation in Q1 due to U.S.-Mexico tariff uncertainty, which the fund capitalized on to establish a position. Although the company is listed in Mexico, most of its value comes from the U.S. market, a geographic mismatch that heightened market caution.
- Data Support: The company owns brands with over 200 years of history, controls approximately 30% of the global tequila market, and trades at a free cash flow (FCF) multiple below 10x. In contrast, the broader industry is under pressure from weak alcohol consumption (e.g., declining sales of Boston Beer's Twisted Tea), but Becle's pricing power and brand moat provide long-term advantages.
- Comparison Data:
| Metric | Becle | Industry Average (Alcoholic Beverages) |
|---|---|---|
| Free Cash Flow Multiple | ≤10x | 15-20x |
| Market Share (Tequila) | ~30% | Fragmented |
| Brand History | 200+ years | Most <50 years |

2. GCI Liberty: Alaska Communications Monopoly and John Malone Endorsement
- Unique Asset: GCI possesses irreplicable communication infrastructure in Alaska (geographic, climate, and terrain barriers) while holding the #1 position in consumer and business broadband and #2 in wireless.
- Financial Highlights: Post-spin-off tax advantages, a recently completed $300 million rights offering (fully supported by John Malone), and insider buying signal confidence. Despite the stock price rising post-spin-off, its valuation remains below that of telecom assets in the contiguous 48 states, yet its competitive position is superior.
- Comparison Data:
| Metric | GCI Liberty | Contiguous 48 States Telecom Peers |
|---|---|---|
| Competitive Position | #1/#2 in Alaska | Multi-regional competition |
| Valuation Discount | Significant discount | Benchmark |
| Insider Support | John Malone bought + fully supported rights offering | Most lack similar endorsement |
3. Graham Holdings (GHC): Diversification and M&A Opportunities
- Education Segment Recovery: Kaplan's education business has resumed growth after years of restructuring, with multiple sub-segments improving simultaneously. Increased M&A activity in broadcast television provides value realization opportunities for GHC.
- Financial Health: A net cash balance sheet and excess pension reserves put the company in an offensive position. A podcast interview with CEO Tim O’Shaughnessy (earlier this year) provided further details.
- Comparison Data:
| Metric | GHC | Diversified Peer Average |
|---|---|---|
| Net Cash / Market Cap Ratio | High (specific value undisclosed) | Most are net debt |
| Pension Funding Status | Overfunded | Most are underfunded |
| M&A Activity (Broadcast TV) | Increasing | Industry downturn |

4. Mattel: IP-Driven Growth and Buybacks
- Brand Value: Over 80% of value comes from growth brands like Hot Wheels, Barbie, and UNO. The company repurchased $600 million in 2025 and is expected to continue buying back shares at low prices in 2026.
- Financial Performance: Gross margins are stable at 50%, with continued growth in the toy business. The IP pipeline for 2026 is strong, including Masters of the Universe and Hot Wheels movies, as well as two video games.
- Comparison Data:
| Metric | Mattel | Toy Industry Average |
|---|---|---|
| Gross Margin | 50% | 30-40% |
| Brand Concentration (Top 3 Brands) | >80% | Fragmented |
| Buyback Scale (2025) | $600 million | Most have no buybacks |
5. Oscar Health: Exit Timing and Policy Risk
- Exit Rationale: The fund exited in Q3 as the P/V gap narrowed and industry risks emerged. Subsequent controversy over ACA subsidy expiration highlighted policy uncertainty.
- Success Factors: Management executed well in a turbulent environment, with membership growth exceeding the market average and sustained expense discipline.
6. Boston Beer: Innovation and Valuation Appeal
- Challenges: Twisted Tea sales declined due to high pricing, but the company is actively correcting this; Truly remains difficult to revive but now represents a smaller portion of the business.
- Highlights: New product Sun Cruiser (vodka-based) is rolling out nationally, and founder Jim Koch has returned as CEO. The company is net cash and one of the largest repurchasers, trading at 1x revenue, making it a potential industry consolidation target.
- Comparison Data:

| Metric | Boston Beer | Alcoholic Beverage Peer Average |
|---|---|---|
| Price-to-Sales Ratio | 1x | 2-3x |
| Net Cash / Market Cap Ratio | High | Most are net debt |
| Buyback Intensity | One of the largest | Moderate |
7. Clearwater Paper: Cyclical Bottom and Tariff Benefits
- Challenges: The SBS paperboard market is depressed due to capacity additions (competitor conversions), operating below mid-cycle levels. However, the company is achieving synergy targets from acquisitions, and management has a good capital allocation track record.
- Catalysts: Capacity closures, tariffs on European competitive capacity, and a weaker U.S. dollar will alleviate supply pressure. The company trades at low single-digit multiples (based on mid-cycle FCF).
- Comparison Data:
| Metric | Clearwater Paper | Packaging Industry Average |
|---|---|---|
| Valuation (FCF Multiple) | Low single-digits | 10-15x |
| Impact of Capacity Additions | Severe | Moderate |
| Tariff Benefit | Tariffs on European capacity | No direct benefit |
8. ESRT and Alexander’s: Dislocation Opportunity in New York Real Estate
- Dynamics: ESRT was reduced in Q4 2024 (P/V gap closed) but declined in 2025 due to deteriorating sentiment toward New York real estate. The fund added to its position at lower prices.
- Fundamentals vs. Market: Leasing trends significantly outperform stock price performance. The market worries about Mayor Mamdani's business policies, but history shows New York real estate can withstand crises (1970s bankruptcy, 9/11, COVID). Current valuations are below the de Blasio era, and both companies are in an offensive position (asset sales, value growth).
- Comparison Data:

| Metric | ESRT & Alexander’s | New York Real Estate Peers |
|---|---|---|
| Valuation vs. History | Below de Blasio era | Benchmark |
| Leasing Trends | Stronger than stock price | Mostly in sync |
| Willingness for Asset Sales | High | Low |
9. Park Hotels & Resorts: Macro Concerns and Asset Dispositions
- Pressure: The Hilton Hawaiian Village was impacted by the 2024 strike and yen depreciation (fewer Japanese tourists). The company continues to sell non-core hotels and has achieved attractive prices.
- Comparison Data:
| Metric | Park Hotels | Hotel REIT Peers |
|---|---|---|
| Asset Sale Prices | Attractive | Mostly at discounts |
| Impact of Japanese Inbound Tourism | Significant | Moderate |
| Macro Sensitivity | High (leisure focus) | Medium |
Summary
- Common Theme: Most holdings create long-term value through unique assets (GCI), brand moats (Becle, Mattel), management execution (Oscar, Clearwater), or valuation dislocations (ESRT, Boston Beer) amid industry headwinds or low market sentiment.
- Risk Factors: Policy uncertainty (Oscar), industry cycles (Clearwater, Park), and consumer trends (Boston Beer) remain key challenges.