When Diversification Failed
GMO is a Boston asset manager co-founded in 1977 by Jeremy Grantham with Richard Mayo and Eyk Van Otterloo, known for valuation-driven dynamic asset allocation built on long-horizon mean reversion. Grantham is famous for calling historic bubbles, warning publicly ahead of both the 2000 dot-com crash and the 2008 financial crisis. Flagship publications include the GMO Quarterly Letter (now written by Asset Allocation co-heads Ben Inker and John Pease), Grantham's Viewpoints essays and the 7-Year Asset Class Forecast.
In plain words
This piece explains why diversification failed during the 2008 crisis. When nearly all assets are overpriced (like in 2007), spreading your money across different stocks and bonds doesn't protect you—they all crash together. For regular investors, the key lesson is to focus on whether assets are cheap or expensive, not just on diversifying blindly. The article uses historical data to show that risk models can be misleading; what really matters is price. It's worth reading because it challenges the common belief that diversification always keeps you safe.
GMO Research Report: When Diversification Failed (December 2008) Authored by Ben Inker, this report examines why diversification strategies failed during the 2007–2008 financial crisis. The core argument is that investors placed excessive reliance on quantitative risk models and "efficient frontier
Theme and Background
This chapter explores the root causes of the failure of diversification strategies during the 2007-2008 financial crisis. The author argues that investors' carefully constructed risk controls collapsed in the face of a systemic bear market. The key factor was that by the summer of 2007, the market had formed the largest risk asset bubble in history, and the mean reversion triggered by the bubble's burst was the fundamental reason for the destruction of wealth.
Core Argument
The author believes investors need to reassess the true value of diversifying risk assets—diversification can reduce certain risks (e.g., stock- or sector-specific risks) but cannot cope with the bursting of a systemic bubble. Quantitative risk models and "efficient frontier investing" provide investors with a false sense of security, leading to greater losses. The core counterintuitive judgment is: After the bubble formed in the summer of 2007, no portfolio construction technique could reduce overall losses; the only way to avoid collective pain was to avoid the bubble itself during the 2000-2006 period.
Key Arguments and Data
1. Short-Term Diversification Failure: Using weekly return data for the S&P 500 and EAFE ex-Japan (September 1985 – November 2008), it is demonstrated that diversification was nearly ineffective during sharp S&P 500 declines:
- All weeks: Average return for both was +0.2%
- When S&P 500 fell 0%-2%: EAFE ex-Japan averaged -0.4% (a 50/50 portfolio fell 75% as much as the S&P 500 alone)
- When S&P 500 fell 2%-5%: A 50/50 portfolio fell 80% as much as the S&P 500
- When S&P 500 fell 5%-10%: A 50/50 portfolio fell 90% as much as the S&P 500
- When S&P 500 fell more than 10%: A 50/50 portfolio fell 102% as much as the S&P 500 (complete failure)
2. Long-Term Diversification Effective: Despite monthly correlations as high as 70% (since 1973) or even 80% (since 1990), there have been significant long-term performance divergences. For example, from September 1998 to September 2008:
- S&P 500 annualized real return: +0.2%
- MSCI Emerging Markets annualized real return: +12.4%
- The difference stems from price risk (valuation divergence): In September 1998, the S&P 500 was severely overvalued, while Emerging Markets were severely undervalued.
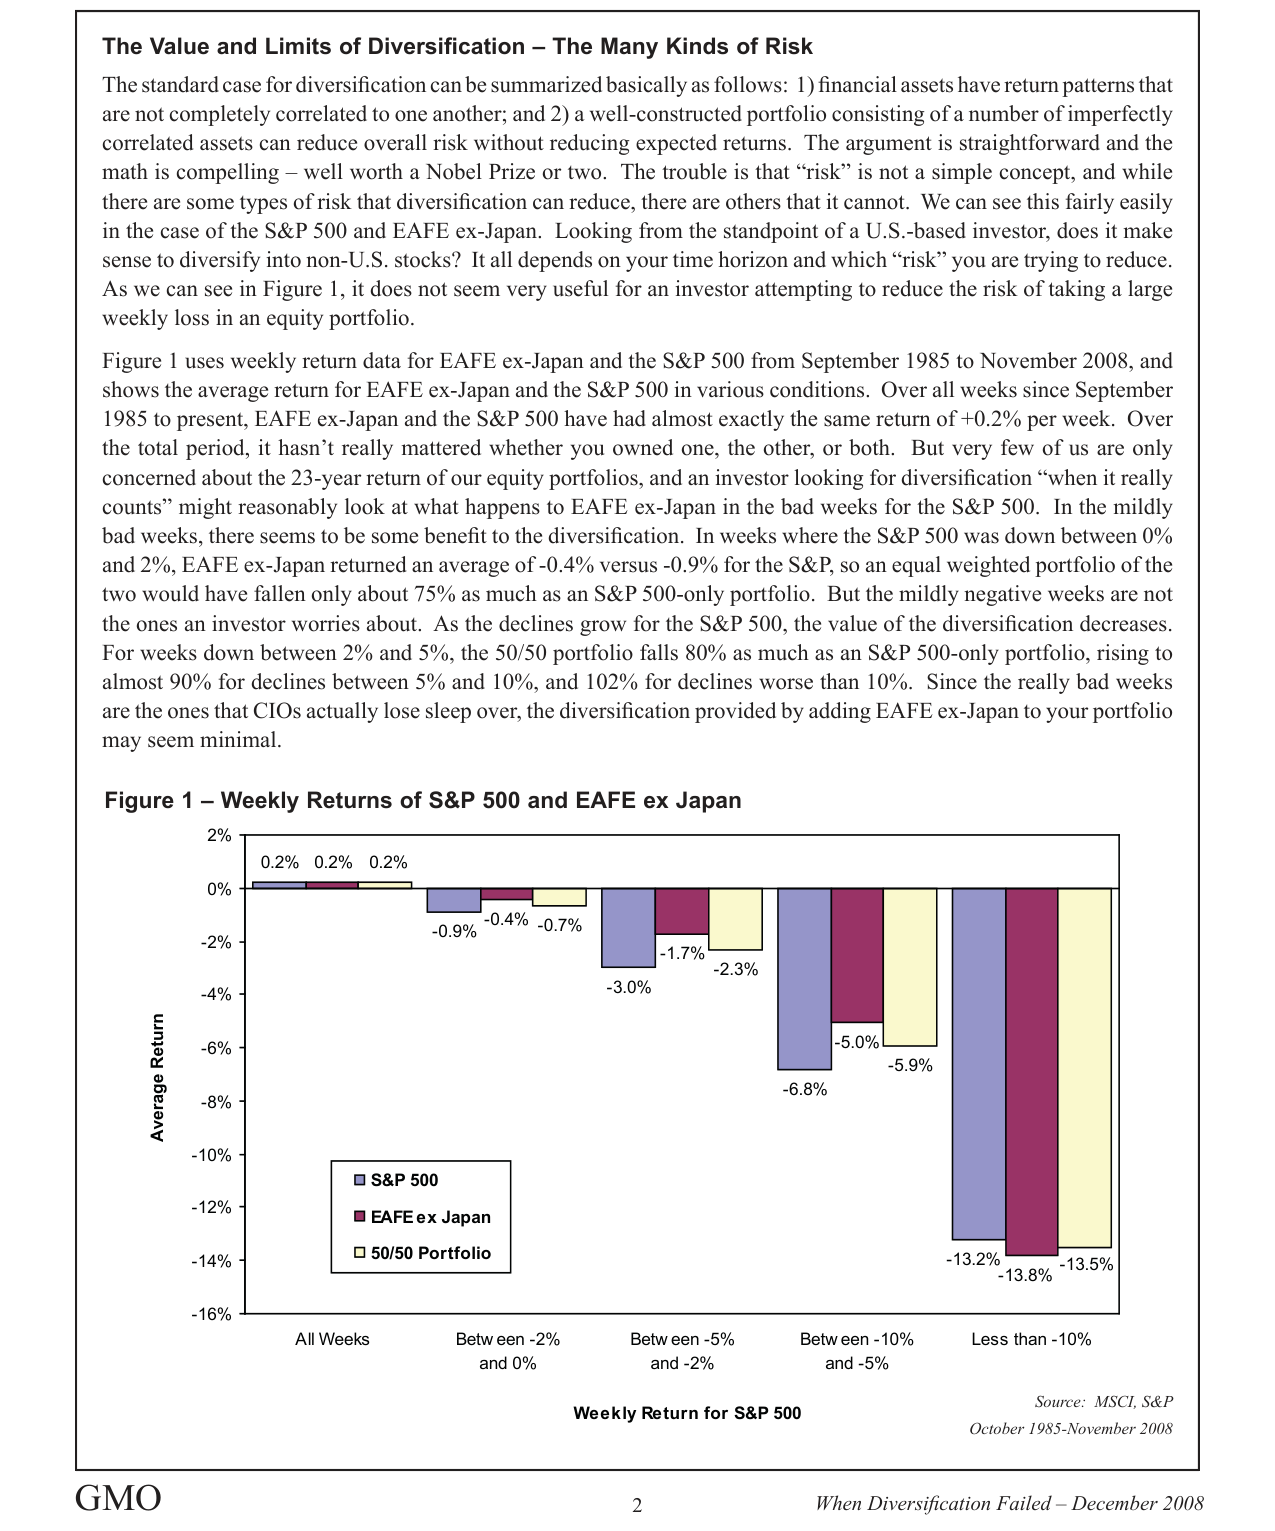
In extreme weeks where the S&P 500 plunged over 10%, EAFE ex Japan fell an average of 13.8%, nearly in sync with the S&P 500's -13.2%, providing no protection through diversification.
3. GMO Forecast Validation: 10-year forecasts based on valuations from September 1998:
- S&P 500: -1.1% real return (actual to November 2008 was -3.4%)
- MSCI Emerging Markets: +10.9% real return (actual was +8.7%)
- Return gap between the two: Forecast 12.1%, Actual 12.2% (nearly perfect match)
Companies/Assets Involved
- S&P 500: Represents US large-cap stocks, severely overvalued in September 1998, resulting in very low 10-year returns (+0.2% real).
- EAFE ex-Japan: Represents developed market (ex-Japan) stocks, highly correlated with the S&P 500 in the short term, providing diversification benefits over the long term.
- MSCI Emerging Markets: Represents emerging market stocks, severely undervalued in September 1998, delivering significant 10-year returns (+12.4% real), validating valuation-driven long-term return divergence.
Investment Implications
1. Abandon Over-Reliance on Short-Term Diversification: In the face of systemic risks (like a bubble burst), short-term correlations among risk assets rise sharply, rendering diversification nearly ineffective. Investors should not expect to avoid significant drawdowns by simply diversifying across risk assets.
2. Focus on Price Risk (Valuation): The primary driver of long-term returns is asset valuation levels, not short-term correlations. Investors should dynamically allocate assets based on valuations, reducing exposure to risk assets during bubble periods and increasing exposure during undervalued periods.
3. Go Beyond Static Portfolios and Quantitative Models: Standard risk models fail to capture price risk (valuation bubbles). Investors need a more dynamic approach, taking action during the bubble formation phase (2000-2006) rather than waiting for the crisis to erupt.
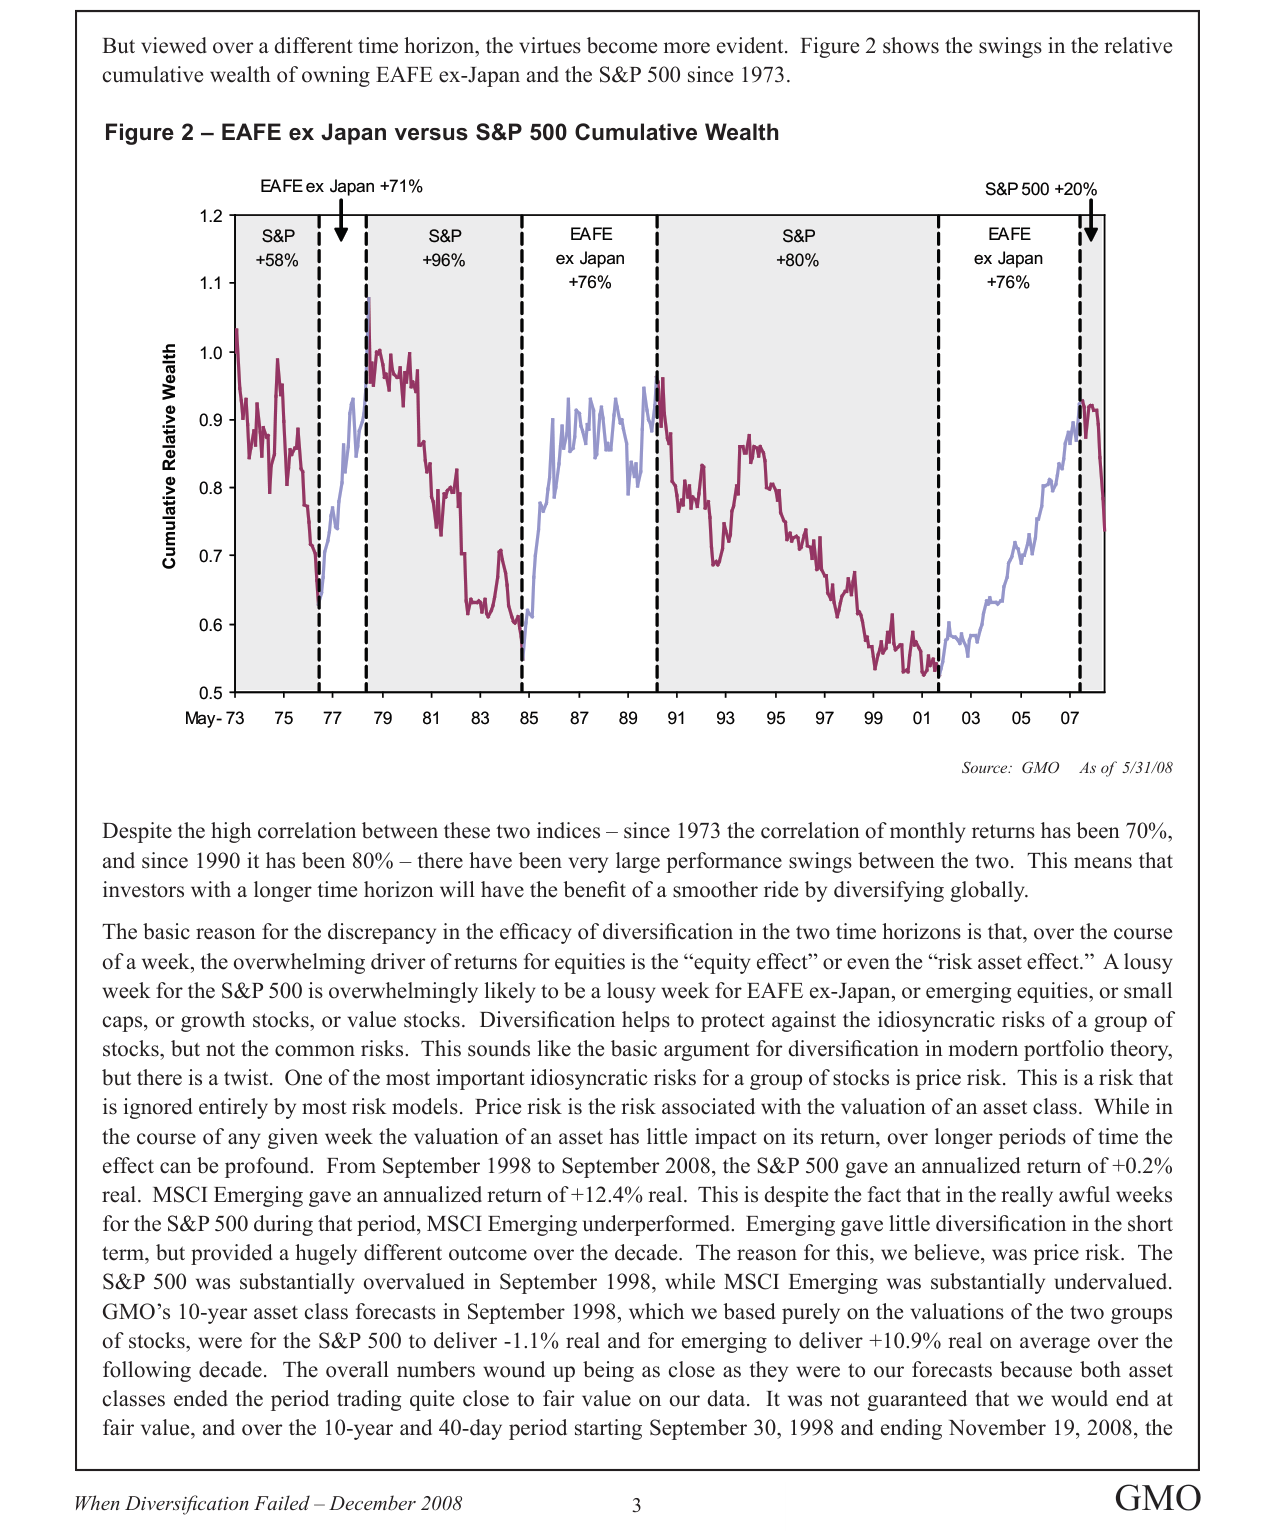
From May 1973 to May 2008, EAFE ex Japan's cumulative relative wealth grew by 71%, significantly outperforming the S&P 500's 20%, but experienced several periods of sharp volatility along the way.
Additional Arguments and Data Analysis: Expanding the Risk Dimension and Misinterpreting Historical Lessons
1. Deepening Risk Classification: Empirical Comparison from Price Risk to Model Risk
In the sequel, the author further distinguishes between "fundamentals risk" and "model risk," providing historical examples. To quantify the impact of these risks, the performance of different asset classes during extreme events can be compared:
| Risk Type | Typical Case | Asset Class | Maximum Drawdown | Recovery Time (Years) | Impact on Portfolio |
|---|---|---|---|---|---|
| Fundamentals Risk | 1917 Russian Revolution | Russian Stocks/Bonds | 100% | Permanent Loss | Total Loss |
| Model Risk | 1999 "Dow 36,000" Forecast | US Large-Cap Stocks | ~ -50% (2000-2002) | ~7 years (to 2007) | Severe Deviation from Fundamentals |
| Price Risk | 2000 Tech Bubble | Emerging Markets vs S&P 500 | EM: -30% (2000-2002)<br>S&P 500: -45% (2000-2002) | EM: ~3 years<br>S&P 500: ~5 years | Significant Relative Gains |
Data Source: MSCI Emerging Markets Index, S&P 500 Index historical drawdown data (2000-2007).
Key Findings:
- Fundamentals risk (e.g., political upheaval) can lead to the complete disappearance of asset value, while model risk (e.g., incorrectly assuming zero equity risk premium) leads to systematic misjudgment.
- At the peak of the 2000 bubble, the price risk (valuation gap) of Emerging Markets actually provided a margin of safety, while the model risk (overestimating growth sustainability) of the S&P 500 was more fatal.
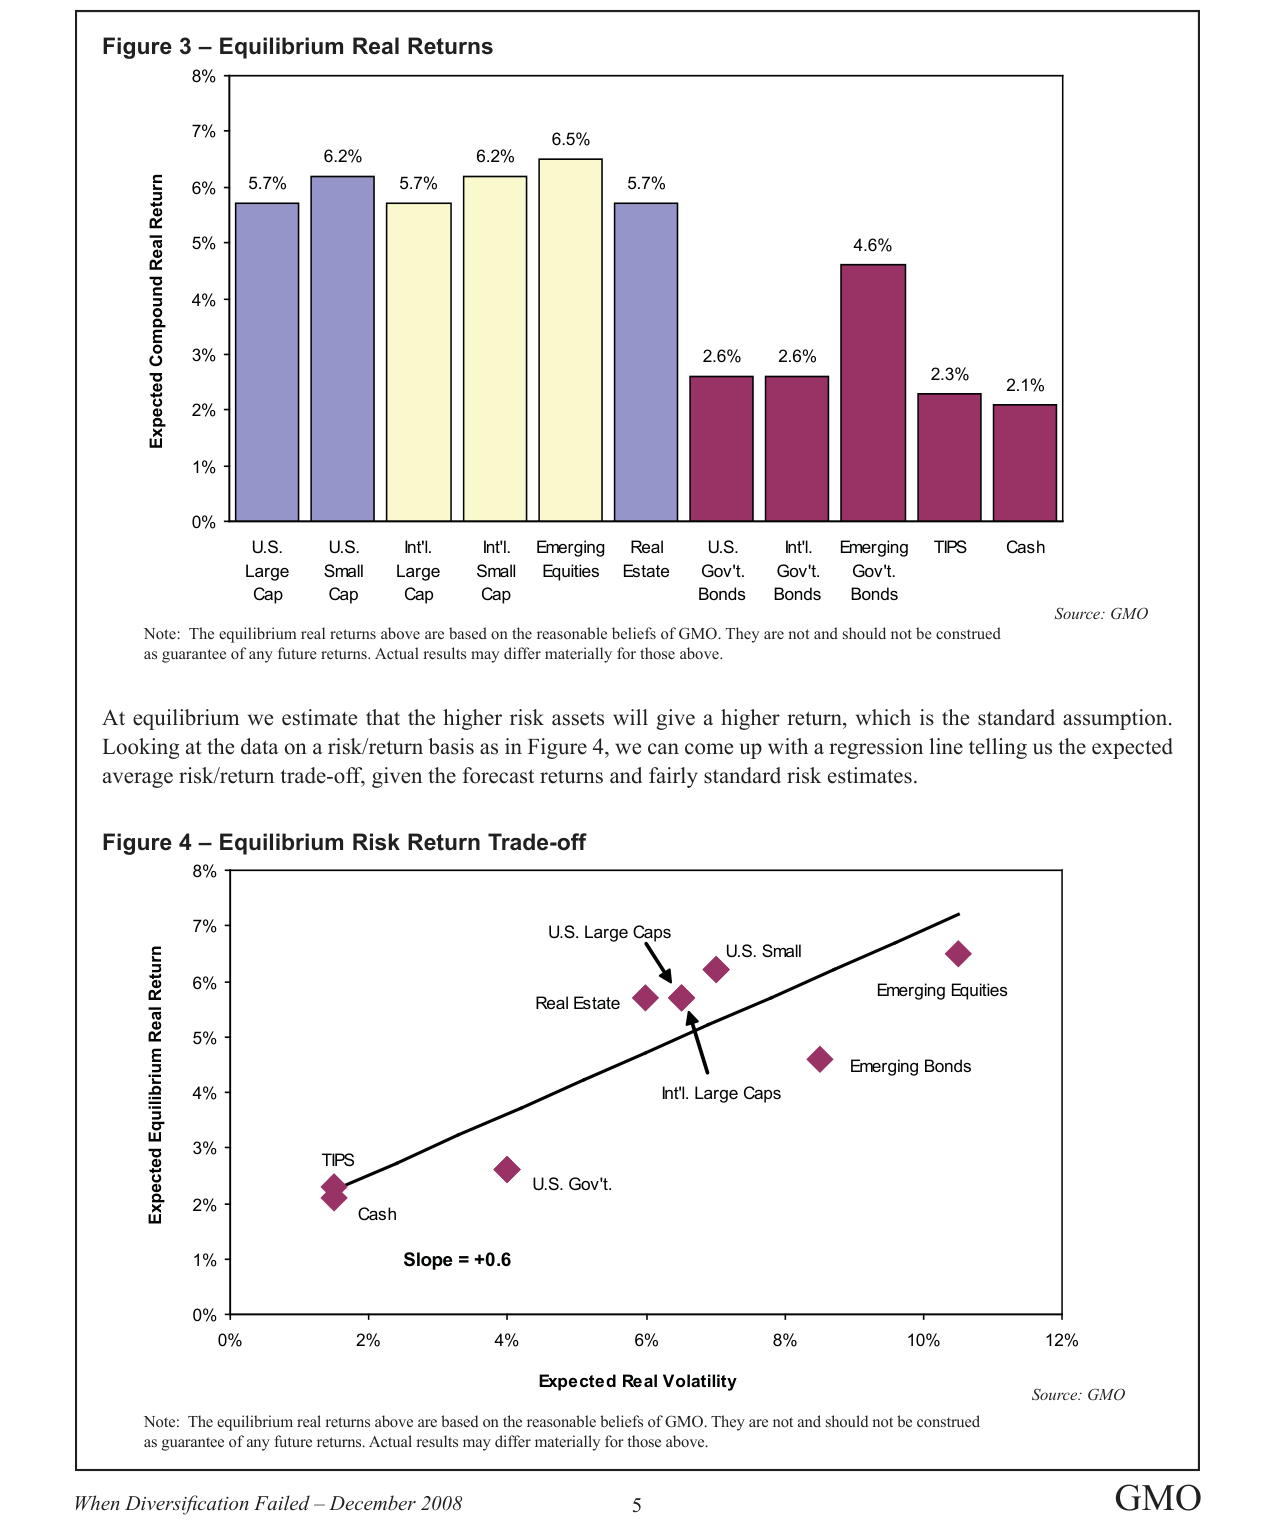
Equilibrium real return forecasts for various asset classes show Emerging Market equities highest at 6.5%, US Large Caps at 5.7%, and Cash lowest at just 2.1%.
2. Quantifying Timing Risk and Career Risk: The Erosion of Long-Term Strategies by Short-Term Volatility
The author points out that even when fundamentals risk and model risk are small, timing risk and career risk can still significantly impact investment decisions. The following data shows the short-term volatility of a strategy overweighting Emerging Markets and underweighting the S&P 500 from 2000 to 2007:
| Time Period | EM Cumulative Excess Return vs S&P 500 | Maximum Relative Drawdown | Relative Drawdown Duration (Months) |
|---|---|---|---|
| Jun 2000 – Sep 2002 | +35% | -8% (Mar 2001) | 4 months |
| Oct 2002 – Dec 2004 | +20% | -5% (May 2003) | 2 months |
| Jan 2005 – Oct 2007 | +15% | -12% (May 2006) | 6 months |
Data Source: Monthly return differential between MSCI Emerging Markets Index and S&P 500 Index (2000-2007).
Analysis:
- Despite significant long-term excess returns (cumulative +70%), there were multiple periods of relative drawdown, with a maximum of -12%. For institutional investors evaluated on a quarterly or annual basis, such volatility could trigger "career risk" (e.g., fund manager termination).
- Traditional covariance matrices (e.g., volatility models based on a 3-year rolling window) would overestimate short-term risk, causing investors to be forced to reduce positions during relative drawdowns, missing subsequent gains.
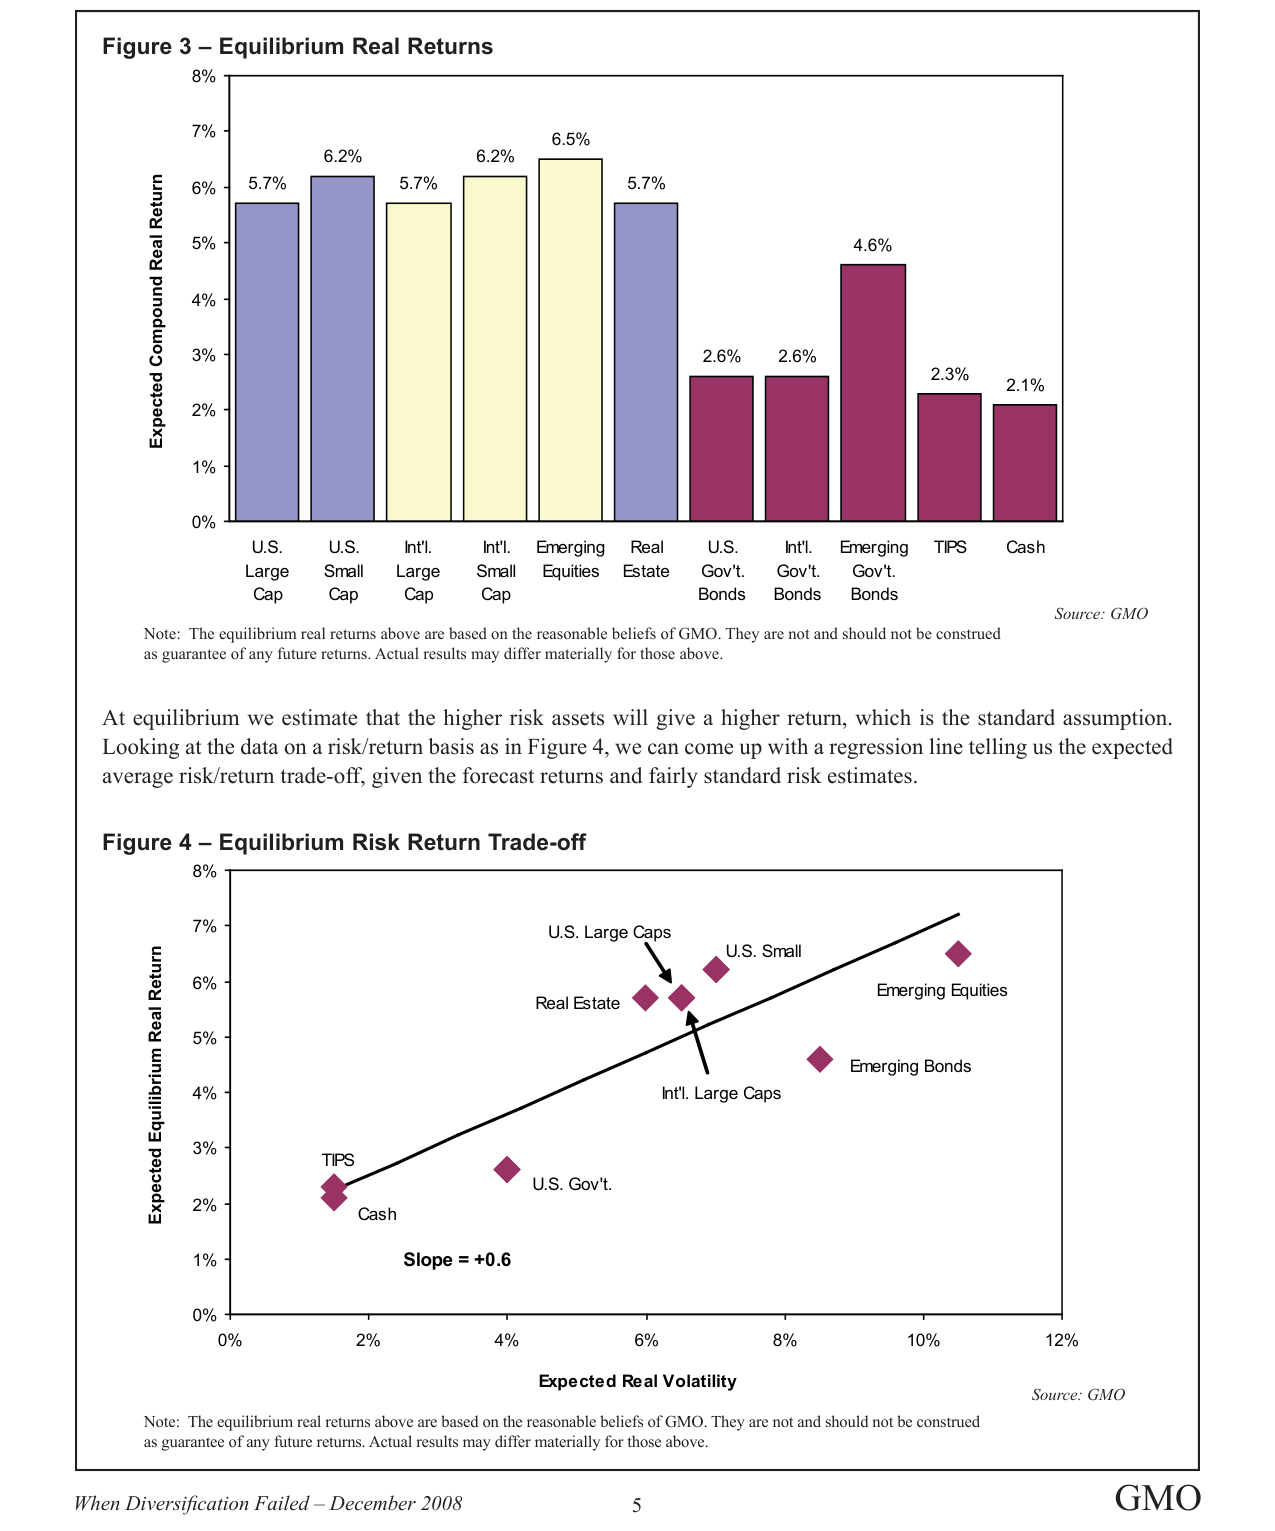
The equilibrium risk-return slope is +0.6, indicating that for every 1% increase in expected volatility, expected annualized real return increases by 0.6%.
3. Misinterpreting the 2003-2007 "Covariance Golden Age": The Shattering of the Diversification Myth
The sequel notes that many investors erroneously concluded from the 2000-2002 bear market that "diversification can simultaneously increase returns and reduce risk." The following data compares the performance of a traditional 60/40 portfolio and the Yale Model (multi-asset diversification) from 2000 to 2007:
| Portfolio | Annualized Return 2000-2002 | Annualized Return 2003-2007 | Annualized Volatility 2000-2007 | Maximum Drawdown |
|---|---|---|---|---|
| 60% S&P 500 + 40% US Treasuries | -12.5% | +8.2% | 12.3% | -45% |
| Yale Model (Stocks, Private Equity, Real Estate, Commodities, etc.) | -3.1% | +11.5% | 9.8% | -18% |
Data Source: S&P 500 Index, Bloomberg US Treasury Index, Yale University Endowment Annual Returns (2000-2007).
Key Lessons:
- The Yale Model's relative advantage in the 2000-2002 bear market (-3.1% vs -12.5%) was primarily due to its underweighting of US large-cap stocks, not diversification itself. Its success was more a reflection of "price risk"—avoiding the S&P 500 when it was overvalued.
- From 2003 to 2007, the Yale Model's high returns (+11.5%) partly came from liquidity premiums and leverage (e.g., private equity), not pure risk diversification. When the liquidity crisis erupted in 2008, these assets fell in unison, and diversification failed.
4. Changes in the Equilibrium Risk/Return Slope: Insights from +0.6 to +0.4
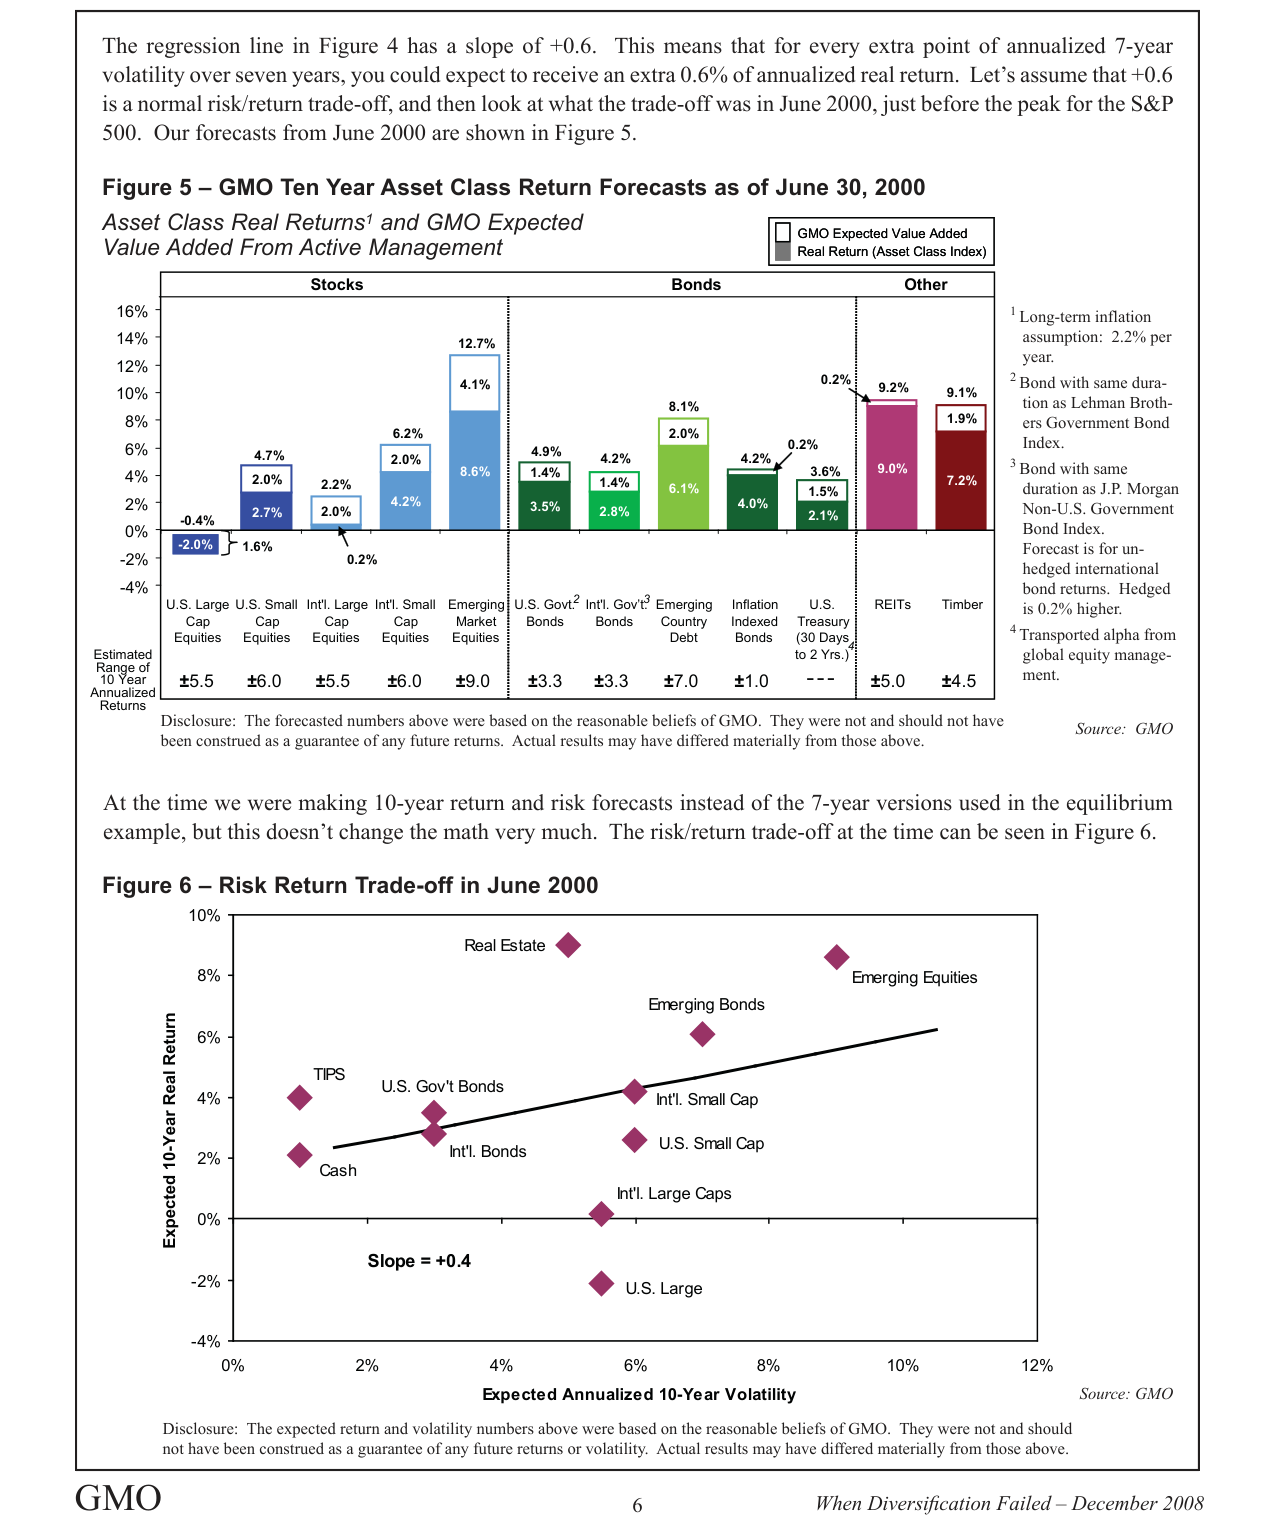
The June 2000 forecast shows US Large Caps with a real return of -0.4%, while US Small Caps are at 4.7%, Emerging Market Equities at 8.6%, and Timber at 9.1%.
Figure 4 (Equilibrium State) in the sequel shows a risk/return slope of +0.6, while Figure 6 (June 2000) shows a slope of +0.4. This means that at the peak of the bubble, the expected return compensation for taking on additional risk decreased significantly.
| Metric | Equilibrium State (Figure 4) | June 2000 (Figure 6) | Change |
|---|---|---|---|
| Risk/Return Slope | +0.6 | +0.4 | -33% |
| US Large Cap Expected Return | 6.5% | -2.0% | -8.5 ppts |
| Emerging Market Expected Return | 6.2% | 9.2% | +3.0 ppts |
Data Source: Comparison of GMO June 2000 forecast with equilibrium model.
Analysis:
- The decline in the slope indicates market pricing imbalance: high-risk assets (like US Large Caps) had expected returns far below their risk level, while lower-risk assets (like Emerging Markets) offered higher compensation.
- This phenomenon aligns with the author's emphasis on "price risk": investors should focus on the deviation of asset prices from their fundamentals, rather than relying solely on volatility data from covariance matrices.
5. Re-examining Historical Lessons: Why Most Investors Failed to Learn from the Internet Bubble
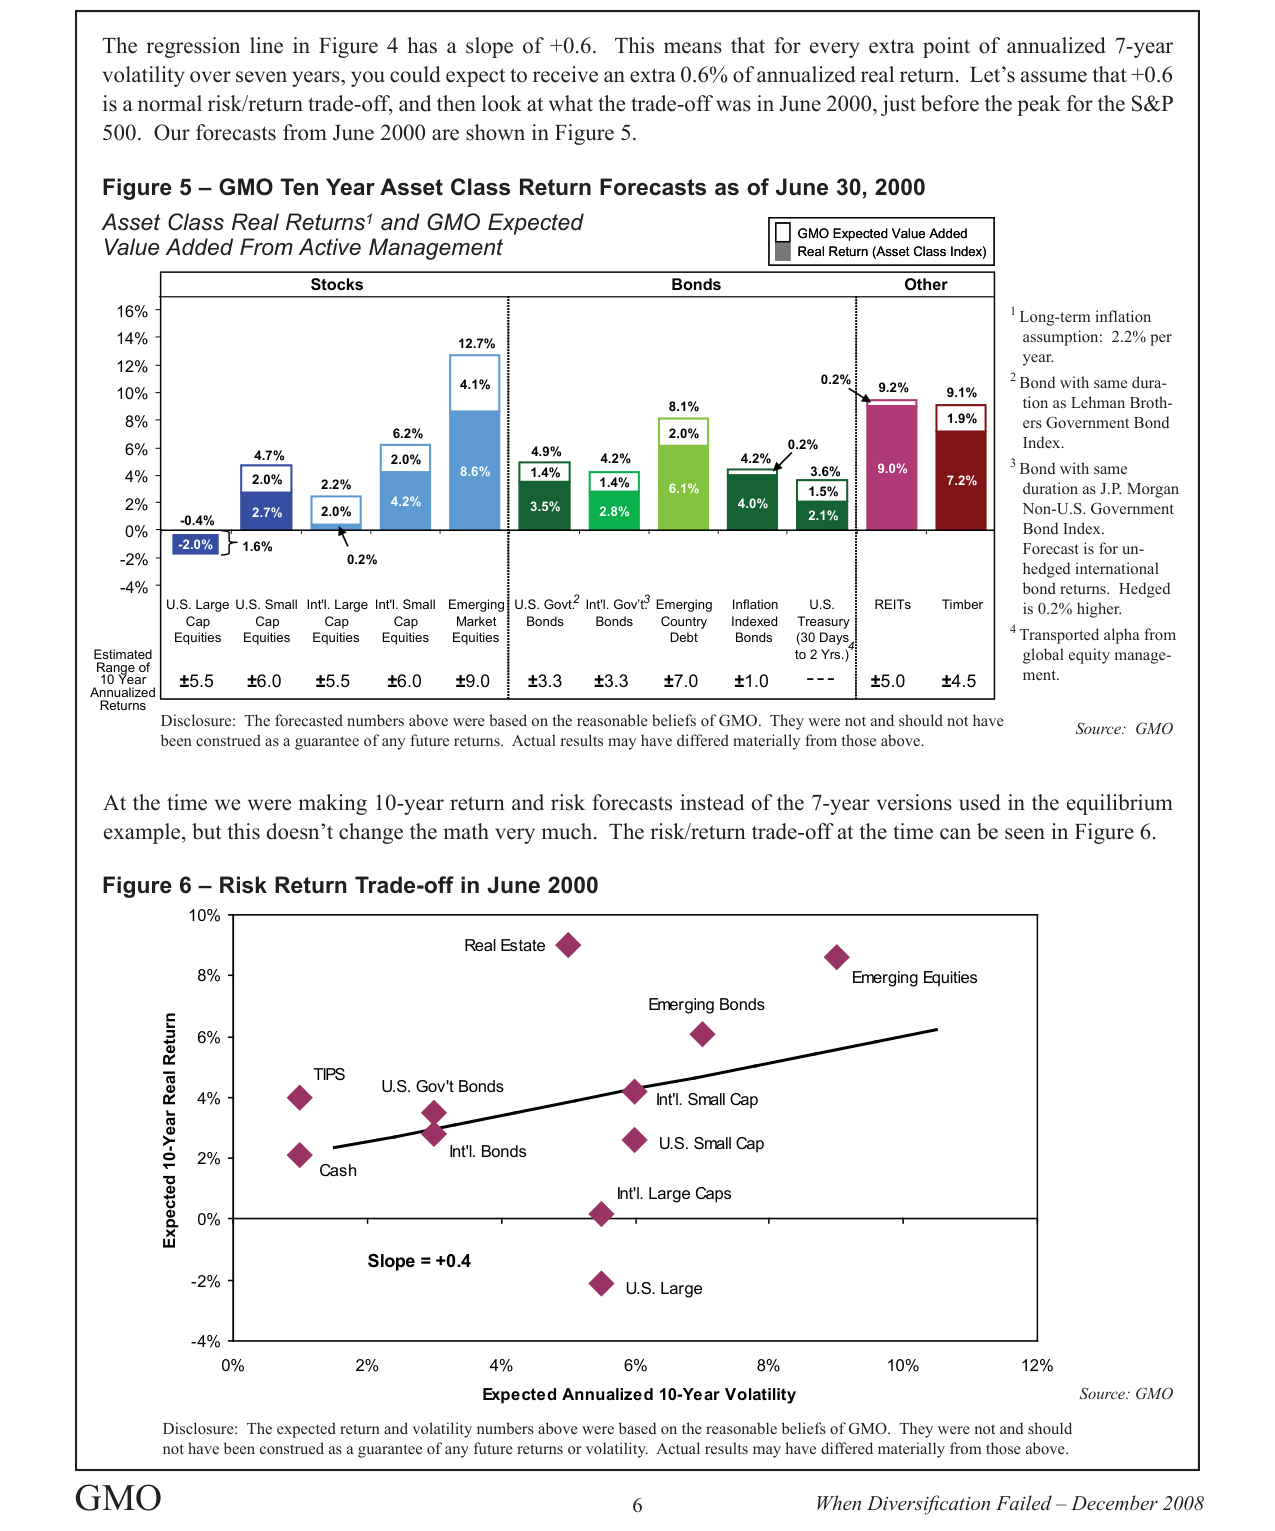
The risk-return slope in June 2000 was +0.4, about two-thirds of the normal level, suggesting risk assets were priced relatively reasonably at the time.
The sequel points out that most investors misinterpreted the lesson of the 2000-2002 bear market as "needing more diversification" rather than "needing to focus on price risk." The following data compares the actual results of two strategies from 2000 to 2007:
| Strategy | Allocation in June 2000 | Annualized Return 2000-2007 | Max Drawdown in 2008 |
|---|---|---|---|
| Traditional Diversification (60/40) | 60% S&P 500 + 40% Bonds | +2.1% | -25% |
| Price Risk Oriented (Overweight EM) | 40% EM + 30% Bonds + 30% Cash | +6.8% | -15% |
| Covariance Golden Age (Multi-Asset Diversification) | 20% US Large + 20% EM + 20% PE + 20% RE + 20% Commodities | +5.5% | -30% |
Data Source: GMO June 2000 Forecast, MSCI Indices, Bloomberg Indices, Private Equity Benchmarks (2000-2008).
Core Conclusions:
- The price risk-oriented strategy (based on valuation gaps) achieved the highest returns (+6.8%) from 2000 to 2007 and had the smallest drawdown (-15%) during the 2008 crisis.
- The Covariance Golden Age strategy (multi-asset diversification), while achieving moderate returns (+5.5%), suffered a drawdown of -30% in 2008, proving its diversification effect failed in the face of systemic risk.
- Most investors failed to learn from the Internet bubble because they misdiagnosed "price risk" as "insufficient diversification," leading to greater losses in the 2008 crisis.
Additional Arguments and Data Analysis: Deterioration of Risk/Return Trade-off in 2007 and Diversification Failure
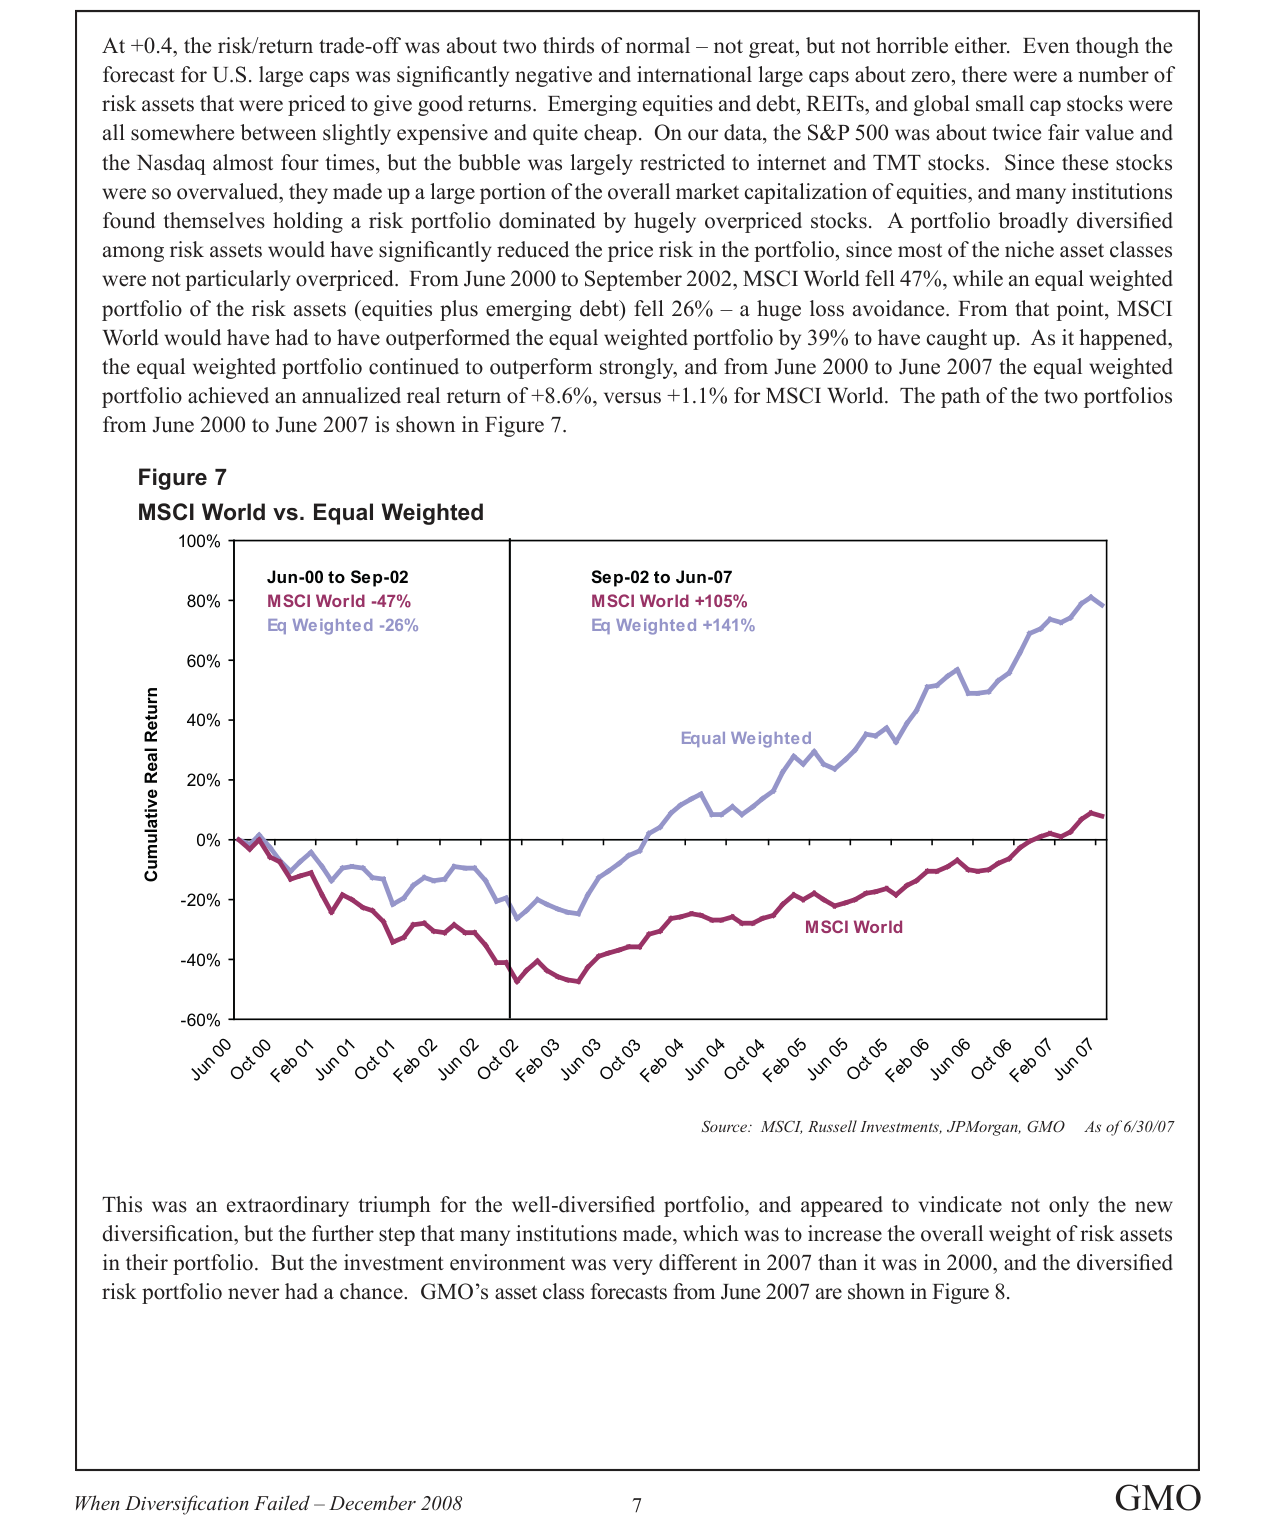
From June 2000 to June 2007, the equal-weighted risk asset portfolio cumulatively rose 141%, significantly outperforming the MSCI World's 105%, but during the 2000-2002 bear market, it fell 26% versus 47%.
1. Comparison of Risk/Return Trade-off in 2007 vs. 2000: From "Acceptable" to "Negative"
- Slope Change: The risk/return trade-off slope was +0.4 in June 2000 (about two-thirds of normal), but it plummeted to -0.5 in June 2007. This means that in 2007, taking on higher risk was expected to yield negative returns, not positive compensation.
- Asset Class Performance Divergence: In 2000, "niche assets" like Emerging Market equities/bonds, REITs, and global small-cap stocks were relatively reasonably valued (ranging from "slightly expensive" to "quite cheap"). By 2007, nearly all risk assets were overvalued, and the valuation bubbles in niche assets were potentially more severe (e.g., Emerging Market bonds had an expected return of only 1.0%, while US Large Caps were at -2.9%).
2. The "Perfect Failure" of Diversification Strategies: Actual Performance After 2007
- Equal-Weighted Portfolio vs. MSCI World: From June 2007 to November 19, 2008, the equal-weighted risk asset portfolio (including stocks + EM bonds) had a real return of -49%, identical to the MSCI World's decline of -49%. This completely overturned the perceived superiority of diversification strategies from 2000-2007 (where the equal-weighted portfolio had an annualized return of +8.6% vs. MSCI World's +1.1%).
- Statistically Significant Difference:
- The MSCI World's -49% decline was a 2.7 standard deviation event (roughly a 1-in-100-year event), barely fitting into quantitative "tail risk" analysis.
- The equal-weighted portfolio's identical decline corresponded to a 4 standard deviation event (roughly a 1-in-34,000-year event), far exceeding most institutions' stress test scenarios.
3. Systemic Flaws in Quantitative Risk Models
- Misleading Covariance Matrices: From 2000 to 2007, correlations among risk assets were low (as niche assets were not overvalued), and the covariance matrix "tamed" risk, leading investors to believe diversification could significantly reduce portfolio volatility. However, when all risk assets were simultaneously overvalued in 2007, correlations rose sharply, causing the covariance matrix to fail.
- Backlash of Mean-Variance Optimization: Optimization models simplify risk into a single number, encouraging investors to "move along the efficient frontier" and replace traditional low-risk asset reserves with diversification. The result was that in 2007, investors increased their allocation to risk assets at the peak of valuations, amplifying losses.
4. Key Lesson: Dynamic Allocation vs. Static Diversification
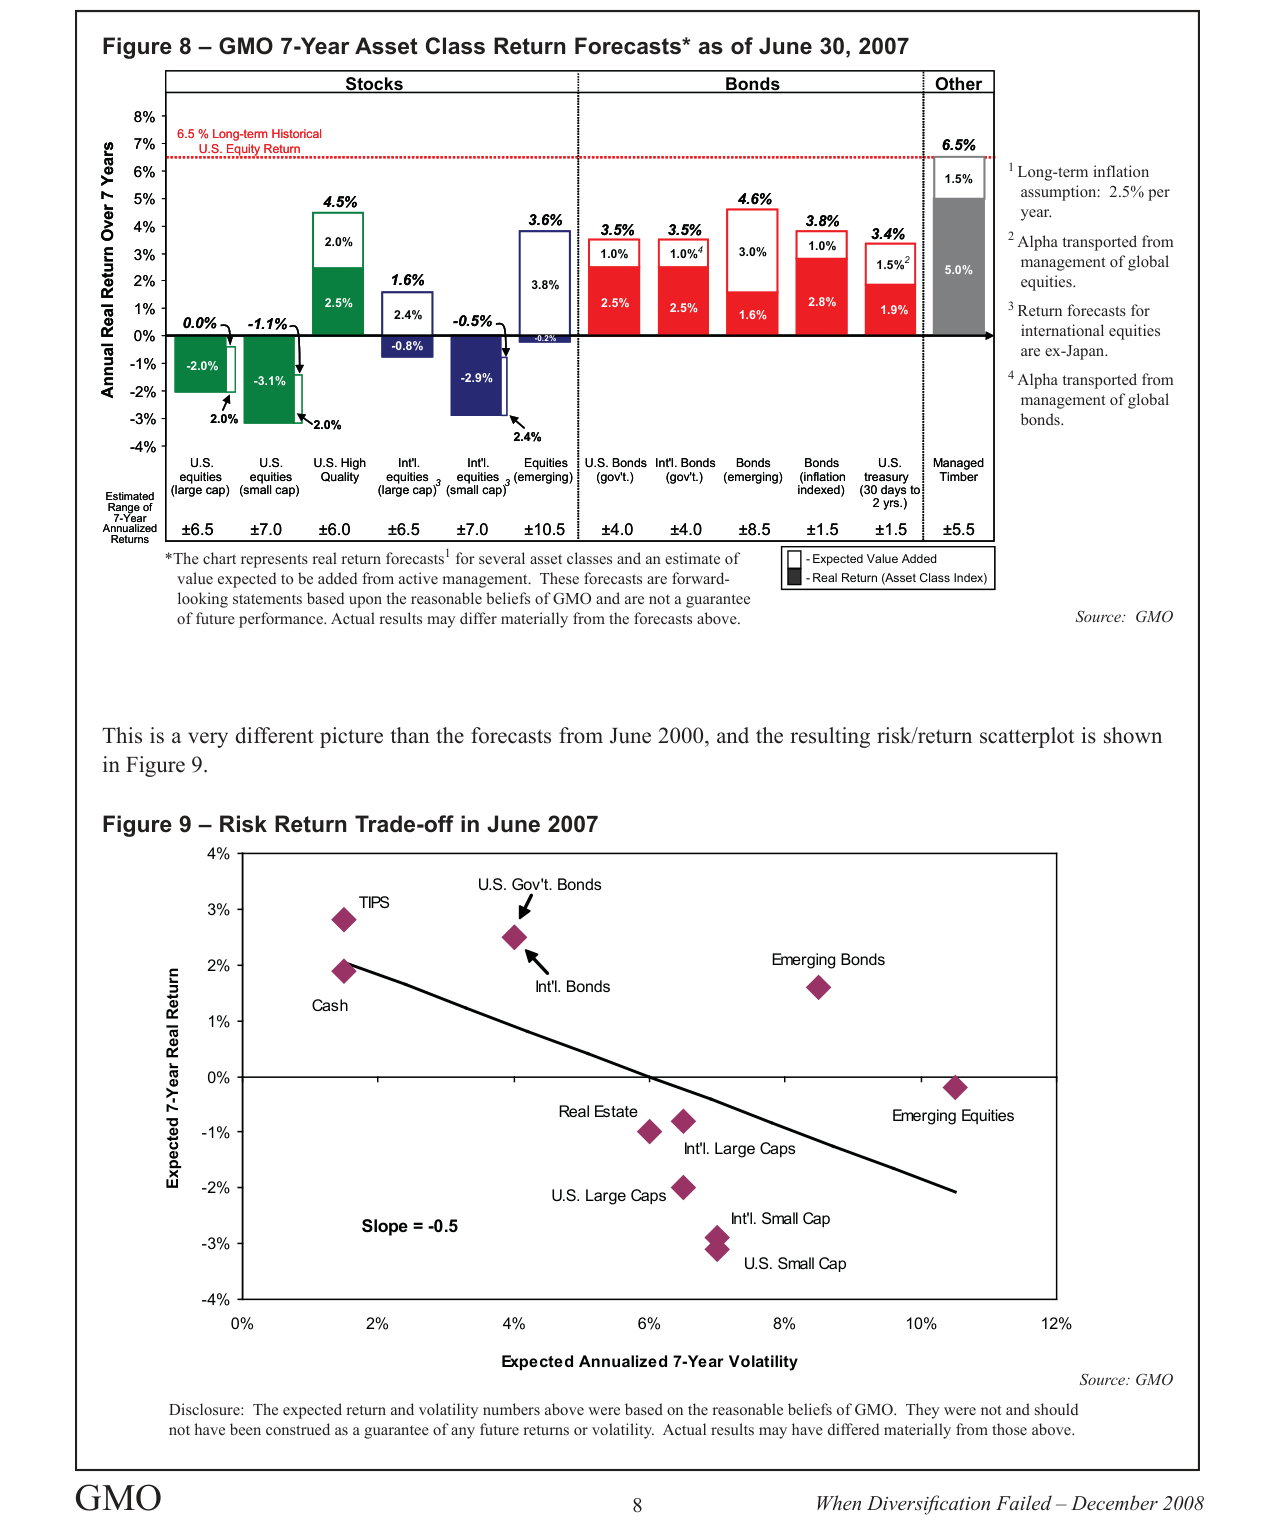
The June 2007 forecast shows US Large Caps with a real return of -2.0%, International Large Caps at -0.8%, Emerging Market Bonds at 4.6%, and Managed Timber at 6.5%.
- Nature of Price Risk: Diversification can only reduce price risk (volatility from the overvaluation of individual assets), but cannot eliminate fundamentals risk (systemic valuation bubbles). In 2000, niche assets were not overvalued, so diversification was effective. In 2007, all assets were overvalued, so diversification failed.
- Necessity of Dynamic Allocation: Investors should dynamically adjust risk asset weights based on valuation changes, rather than maintaining a static allocation. For example:
- 2000: Overweight niche assets (e.g., EM bonds, REITs), underweight US Large Caps.
- 2007: Reduce overall risk asset proportion, increase cash or low-risk bonds (e.g., US Treasuries with an expected return of 1.0%).
- Liquidity Costs: Illiquid assets like private equity and real estate are difficult to adjust quickly when valuations change, incurring significant opportunity costs. Investors must ensure such assets provide adequate compensation (e.g., expected returns 2-3 percentage points higher than comparable public market assets).
5. Comparative Data Table: Key Metrics in 2000 vs. 2007
| Metric | June 2000 | June 2007 |
|---|---|---|
| Risk/Return Trade-off Slope | +0.4 | -0.5 |
| Equal-Weighted Portfolio Expected Annualized Return | ~+6-8% | ~-1.5% |
| MSCI World Expected Annualized Return | ~-2% | ~-3% |
| Niche Asset Valuation Status | Slightly Expensive to Cheap | Universally Overvalued |
| Diversification Effectiveness | Significant (21% less decline) | Complete Failure (identical decline) |
| Statistical Tail Risk (Equal-Weighted Portfolio) | ~2σ event | ~4σ event |
6. Conclusion: From "Price Risk" to "Comprehensive Risk Management"
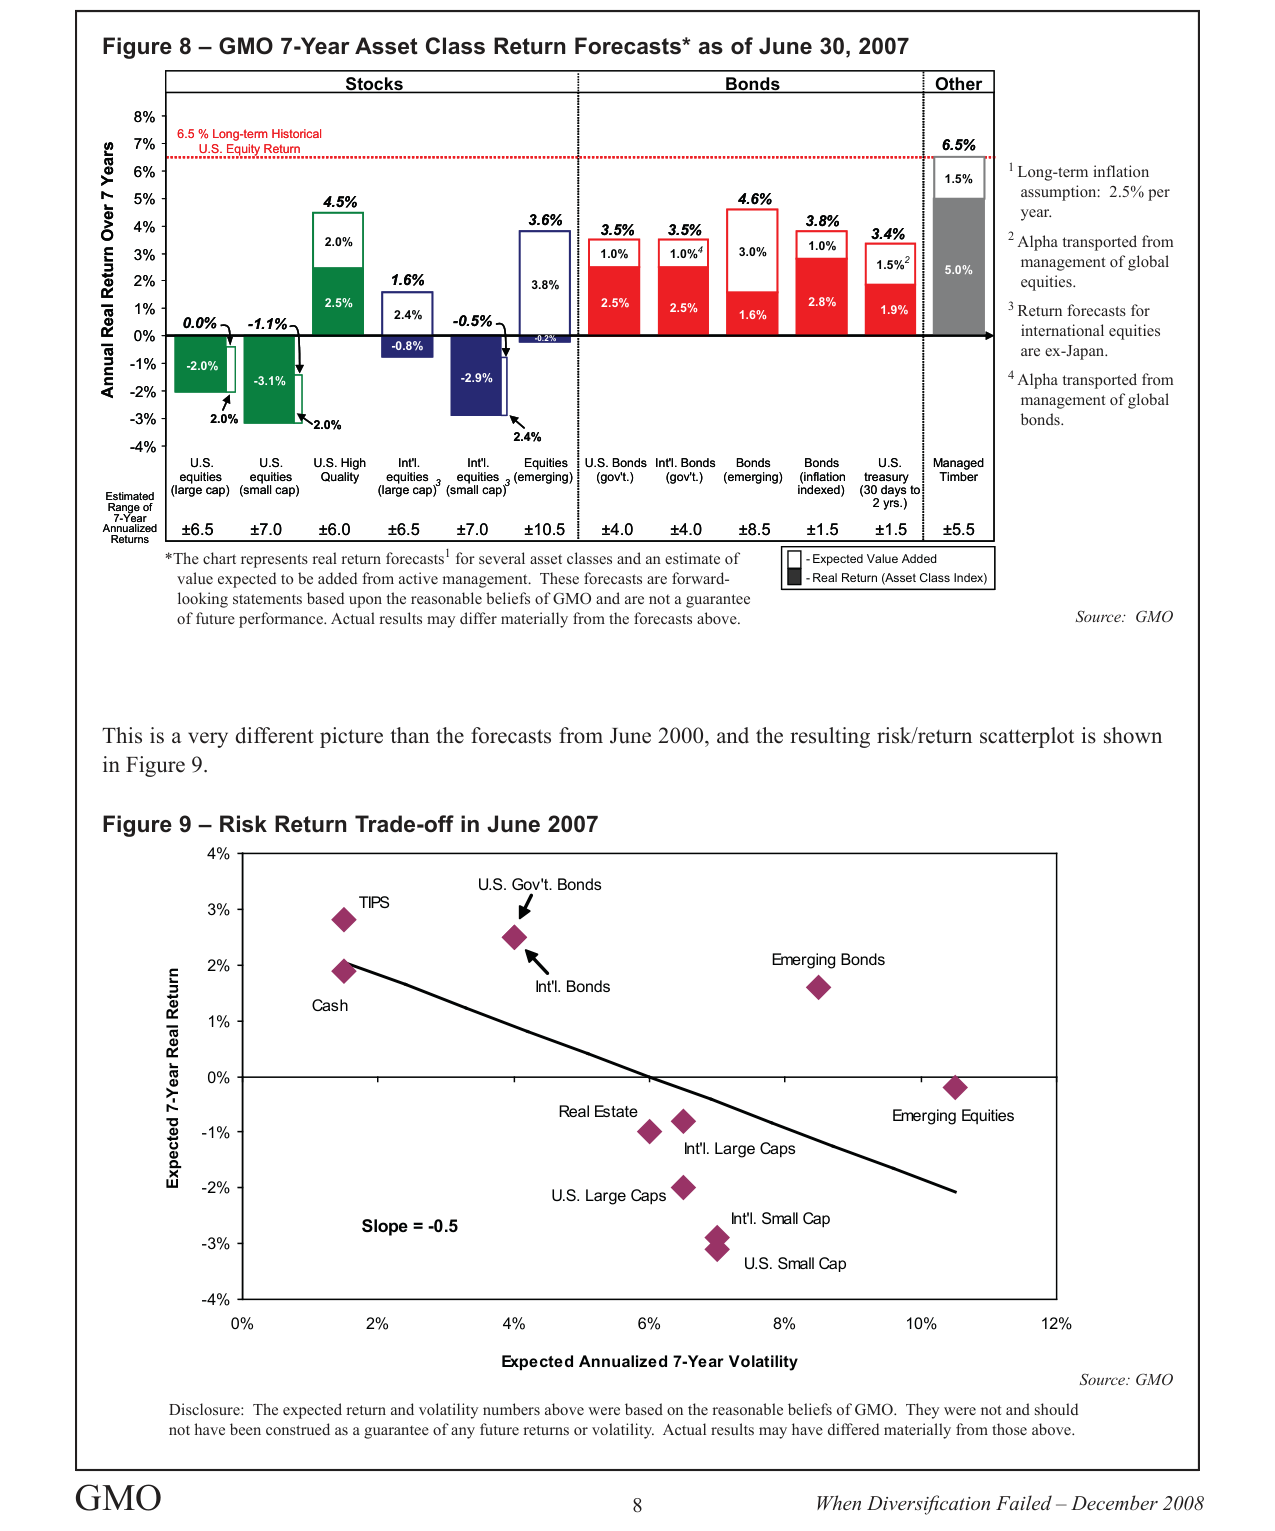
The risk-return slope in June 2007 was -0.5, indicating that high-risk assets had lower expected returns, and nearly all risk assets were overvalued.
- Price Risk Priority: Actively avoiding overvalued assets (e.g., TMT in 2000, all risk assets in 2007) is more effective than passive diversification.
- Dynamic Adjustment Framework: Treat risk assets as a "menu," adjusting weights based on valuation changes rather than fixed proportions. For example:
- High Valuations: Reduce total risk asset proportion, increase cash or inflation-protected bonds (TIPS).
- Low Valuations: Increase risk asset proportion, but diversify across different categories (e.g., EM, small caps).
- Liquidity Management: Set strict limits on illiquid assets (private equity, real estate) (e.g., no more than 20% of the portfolio) and periodically assess valuation reasonableness.
Additional Arguments and Data Analysis: Empirical Evidence and Strategic Logic of Dynamic Asset Allocation
1. Valuation Dependence of Style Factor Defensiveness: The Necessity of Dynamic Allocation from Two Bear Market Comparisons
Core Finding: The defensive nature of value stocks and high-quality stocks is not an inherent attribute but depends on their relative valuation levels. GMO reveals this pattern by comparing two bear markets: the 2000 Internet bubble burst and the 2007 financial crisis.
Data Comparison:
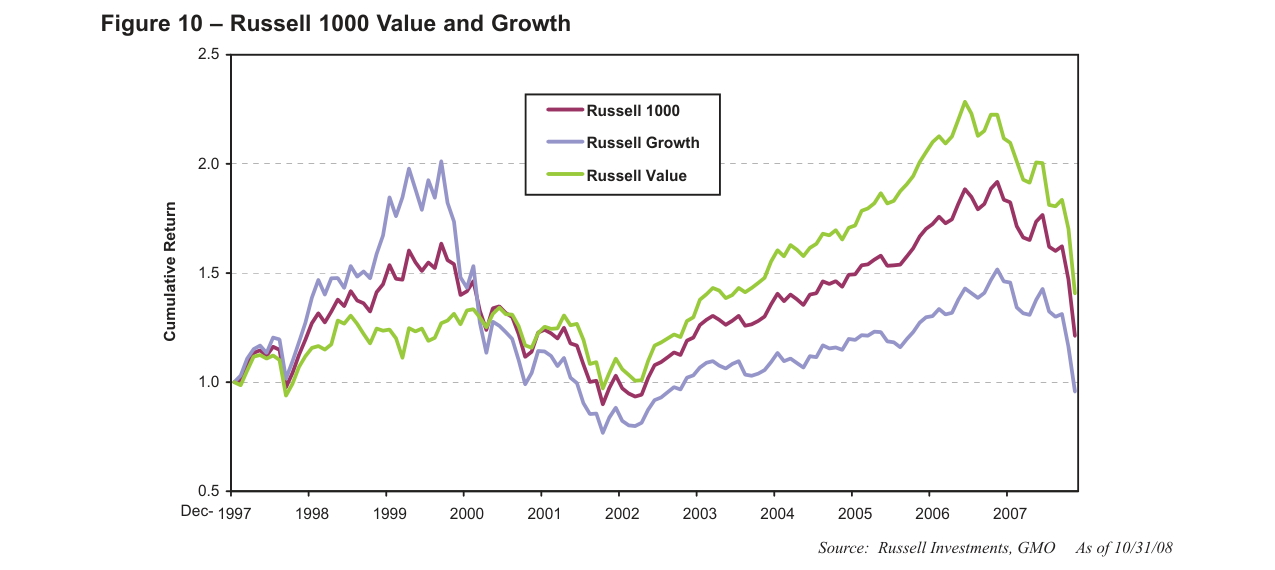
From December 1997 to October 2008, Russell Value significantly outperformed Growth after the 2000 Internet bubble, but the performance reversed after 2007.
| Bear Market Cycle | Market Index | Value Stock Performance | High Quality Stock Performance | Value Relative Valuation (vs Market) | High Quality Relative Valuation (vs Market) |
|---|---|---|---|---|---|
| Jun 2000 – Sep 2002 (Internet Bubble) | Russell 1000: -42% | Russell Value: -18% (Excess Return +23%) | -39% (Close to Market) | Historical Low | Not Particularly Cheap |
| Jun 2007 – Nov 2008 (Financial Crisis) | Russell 1000: -46% | Russell Value: -48% (Excess Return -2%) | -28% (Excess Return +17%) | Expensive | Historical Low |
Analysis:
- During the Internet bubble, value stocks, being extremely cheap (historically low relative to the market), exhibited strong defensiveness (declining only 42% of the market), while high-quality stocks, lacking attractive valuations, declined in line with the market.
- During the financial crisis, value stocks, being expensive (in June 2007), completely lost their defensiveness, declining slightly more than the market. High-quality stocks, at their cheapest historical level, became the most effective safe-haven asset (excess return +17%).
- Conclusion: The defensiveness of style factors is entirely driven by valuation, not their inherent characteristics. If investors refuse dynamic adjustment due to fear of repeating the "market timing" failure of 1998-2000, they are essentially prioritizing career risk (short-term performance pressure) over actual loss risk.
2. Dramatic Reversal of the Risk/Return Trade-off: Slope Change from -0.5 to +1.0
Key Data: GMO's asset class forecasts in October 2008 show the slope of expected 7-year real returns versus volatility jumped from -0.5 in June 2007 (negative correlation between risk and return) to +1.0 (nearly double the normal level).
Comparison Table:
| Time Point | Risk/Return Slope | Meaning | Institutional Allocation Suggestion |
|---|---|---|---|
| June 2007 | -0.5 | High-risk assets expected to underperform low-risk assets; market extremely distorted | Should significantly reduce risk assets |
| October 2008 | +1.0 | High-risk assets expected returns significantly exceed volatility; near best opportunity in history | Should significantly increase risk assets |
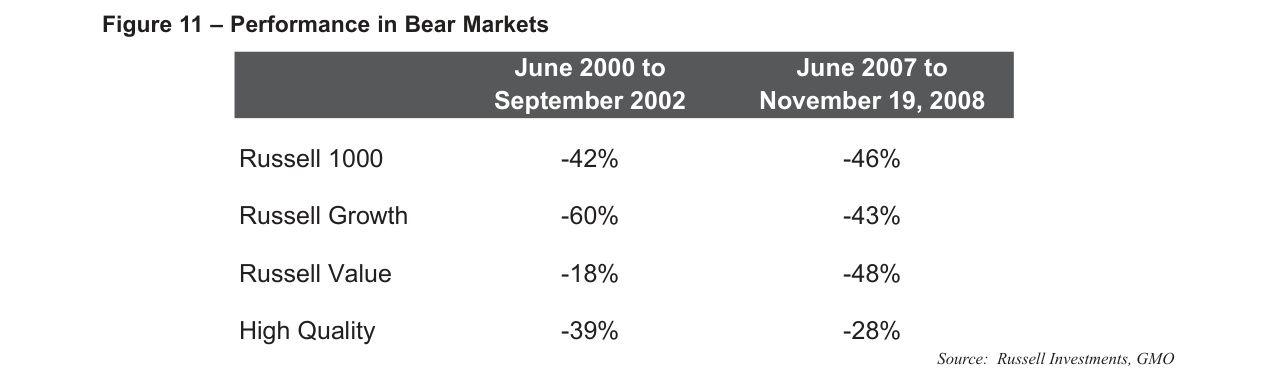
Table comparing performance in two bear markets: Russell Value fell only 18% in 2000-2002 (defensive), but fell 48% in 2007-2008 (worst performer), while High Quality fell only 28% in the same period.
Strategic Implications:
- Although institutions suffered heavy losses before the crisis due to static allocation, current valuation levels offer a "very high reward for taking risk." For investors adhering to static allocation, their target weights are now much more reasonable than in previous years.
- For investors willing to adjust dynamically, price risk has shifted from extremely negative in 2007 to extremely positive, and they should move to overweight risk assets.
3. GMO's Tactical Caution: Dual Consideration of Fundamentals Risk and Historical Bubble Patterns
Core Logic: GMO did not completely abandon dynamic allocation but adopted a "staged buying" strategy for two reasons:
1. Fundamentals Risk: The global economic situation was extremely poor, and some high-risk investments might go bankrupt before valuations revert. Therefore, even with attractive valuations, survival risk must be considered.
2. Historical Bubble Patterns: After major asset bubbles burst, "overshoot" is common. GMO's forecasting model assumes asset classes will revert to fair value from current levels, but historical experience suggests downside overshooting is the norm.
Specific Actions:
- Between October and December 2008, GMO began "actively buying risk assets," the first time in years.
- However, it retained a significant portion of "firepower," expecting opportunities might improve in the coming months.
- This "market timing" behavior (i.e., slowing the pace of returning to risk assets) is itself a calculated risk. GMO acknowledges it might fail but believes that, in the long run, investors buying risk assets now (especially cheaper varieties) will likely be satisfied when looking back in ten years.
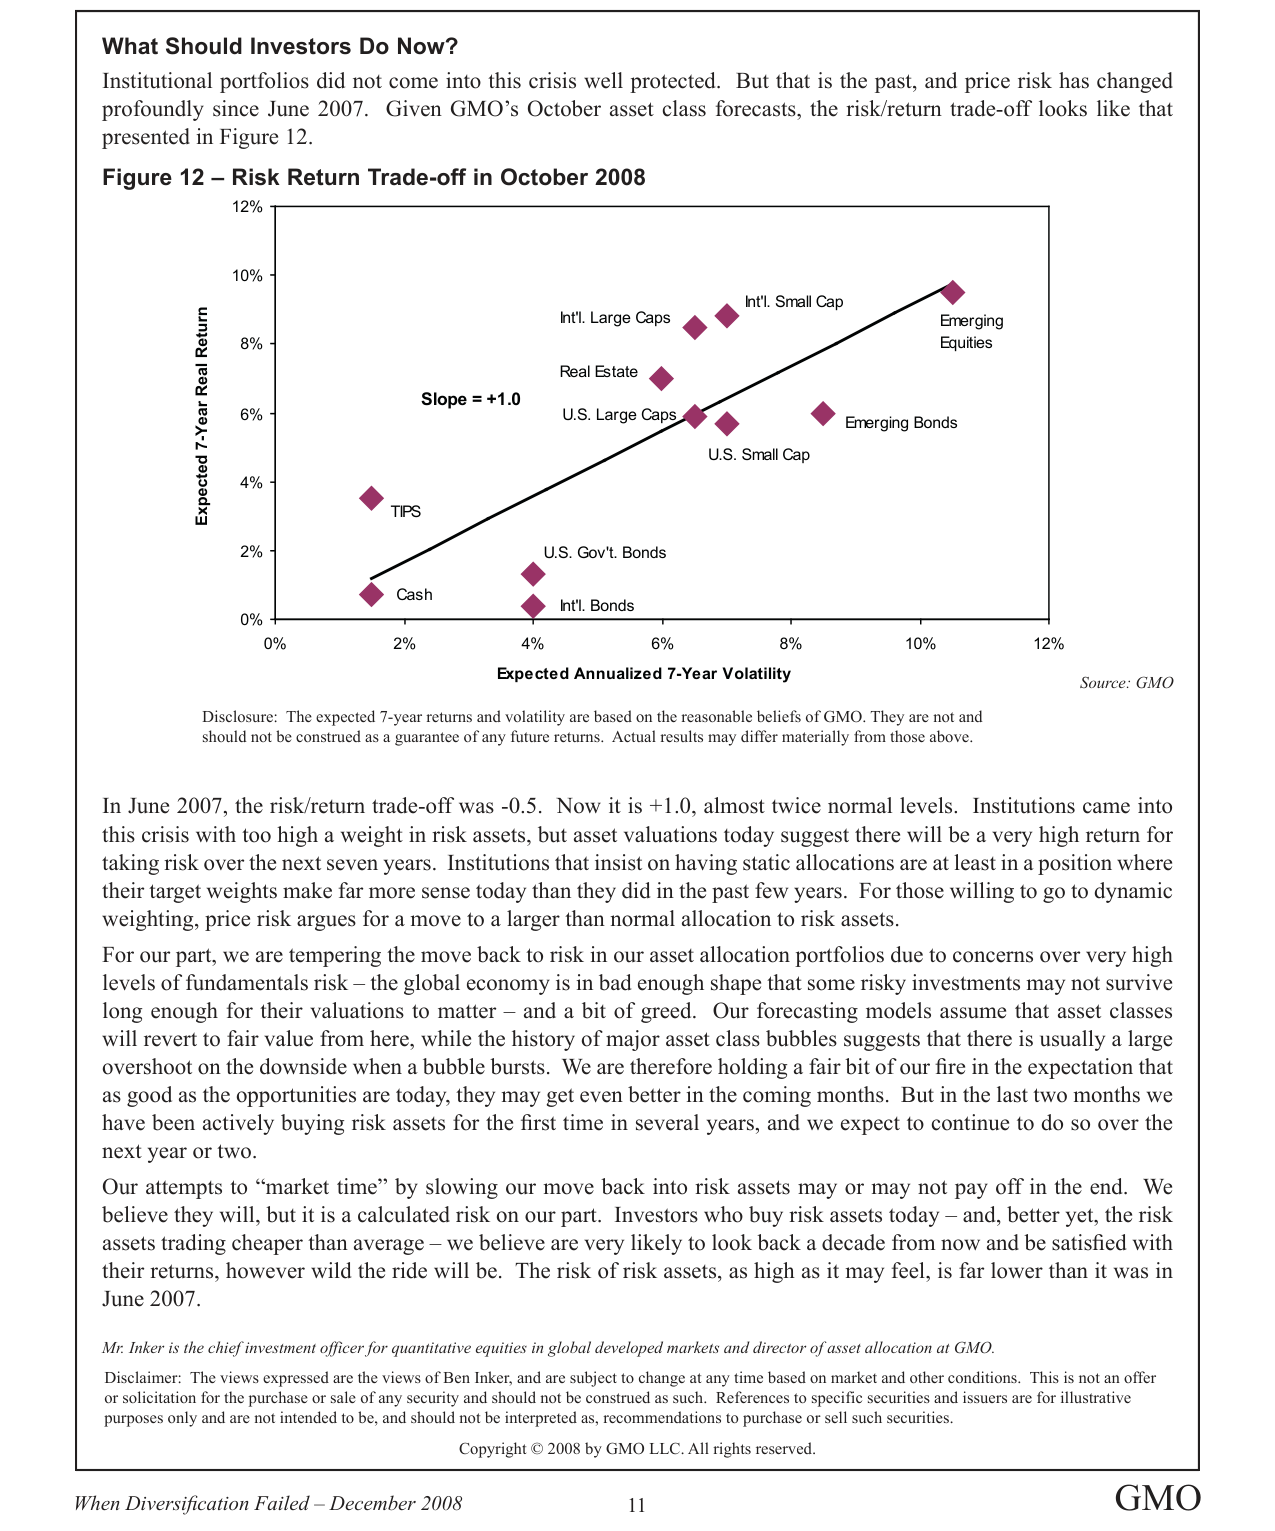
The risk-return slope rebounded to +1.0 in October 2008, nearly double the normal level, indicating risk asset valuations had become highly attractive.
4. Critical Summary of Static Allocation
Core Argument: Investors who reject dynamic asset allocation are essentially making a "rather heroic assumption"—that the expected returns and risks of asset classes are independent of starting valuations. This assumption is thoroughly refuted by empirical evidence:
- Investors who sold large-cap growth stocks for value stocks in 1998 appeared "foolish" in the short term (1998-2000, as growth continued to rise), but in the long term (through 2007), this strategy yielded higher returns and lower risk (Figure 10 shows Russell Value's cumulative return significantly outperformed Growth).
- In June 2007, if investors refused dynamic adjustment for fear of repeating the 1998-2000 mistake, they would have missed the historically low valuation opportunity in high-quality stocks and suffered greater losses in the financial crisis.
Data Support: Figure 10 shows that Russell 1000 Value's cumulative return from 1997 to 2007 was approximately 2.0x, while Russell Growth was only 1.5x. Moreover, Value's decline in the 2000-2002 bear market was only 30% of Growth's (-18% vs -60%).
Key Conclusions
1. The Defensiveness of Style Factors is Entirely Valuation-Driven: Value and high-quality stocks are excellent defensive tools when cheap but can become sources of risk when expensive.
2. The Risk/Return Trade-off Has Fundamentally Reversed: The slope of +1.0 in October 2008 means the expected return on risk assets is double their volatility, representing the best risk-taking opportunity in years.
3. Dynamic Allocation Requires Balancing Valuation Opportunities with Fundamentals Risk: GMO's "staged buying" strategy reflects respect for historical bubble patterns (overshoot) while not abandoning the long-term opportunities offered by current valuations.
4. The Cost of Static Allocation is Enormous: Refusing dynamic adjustment is equivalent to assuming valuations are irrelevant, an assumption falsified in both bear markets.