The Curious Incident of the Elevated Profit Margins
GMO is a Boston asset manager co-founded in 1977 by Jeremy Grantham with Richard Mayo and Eyk Van Otterloo, known for valuation-driven dynamic asset allocation built on long-horizon mean reversion. Grantham is famous for calling historic bubbles, warning publicly ahead of both the 2000 dot-com crash and the 2008 financial crisis. Flagship publications include the GMO Quarterly Letter (now written by Asset Allocation co-heads Ben Inker and John Pease), Grantham's Viewpoints essays and the 7-Year Asset Class Forecast.
In plain words
This report explains why U.S. corporate profit margins have stayed high for a decade and what it means for regular investors. The author admits his 2012 prediction that margins would fall was wrong. The real reason: the U.S. government ran much bigger deficits (borrowing more), which boosted profits. Even if margins stay high, U.S. stocks are overpriced—valuations (like price-to-earnings ratios) are near record highs, so future returns may be poor. In contrast, emerging markets (like China and India) are much cheaper, with P/E ratios about one-third of the U.S., offering better value. Worth reading to avoid putting all your money in expensive U.S. stocks.
In a May 2023 white paper, GMO analyst James Montier reflected on his erroneous 2012 prediction that U.S. profit margins would revert to historical averages. He noted that U.S. profit margins have remained persistently high over the past decade, averaging 9.5% from 2012 to 2022, far exceeding the lo
Theme and Background
This chapter is the first in a series of white papers by GMO analyst James Montier. Its core task is to explain why U.S. profit margins have remained persistently high over the past decade and to reflect on the significant error of his 2012 prediction that margins would revert to their historical mean. From a macroeconomic perspective, the author re-examines the fundamental factors driving changes in profit margins using the Kalecki profit equation framework.
Core Thesis
The author explicitly acknowledges that his 2012 prediction was entirely wrong and points out that the substantial expansion of the fiscal deficit is the fundamental reason for persistently high profit margins. Even assuming that "permanently high deficits" become the new normal, the overall valuation of the U.S. stock market remains too high and lacks a margin of safety. The author argues that current U.S. market pricing has surpassed "perfect" levels, implying bleak long-term return prospects.
Key Arguments and Data
1. Prediction Error and Profit Margin Reality:
- In 2012, the author predicted U.S. profit margins would revert to "normal," but the average profit margin for the decade 2012-2022 was 9.5%, far exceeding the long-term average of 6.3% from 1950-2012.
- Although profit margins declined briefly, they never reverted to the historical mean.
2. Fiscal Deficit as the Core Driver:
- From 1950-2011, the average U.S. fiscal deficit was less than 3% of GNP; from 2012-2022, this ratio doubled to 6.6%.
- This pattern holds even when excluding the COVID-19 years. The primary sources of the increased deficit are healthcare and social security spending.
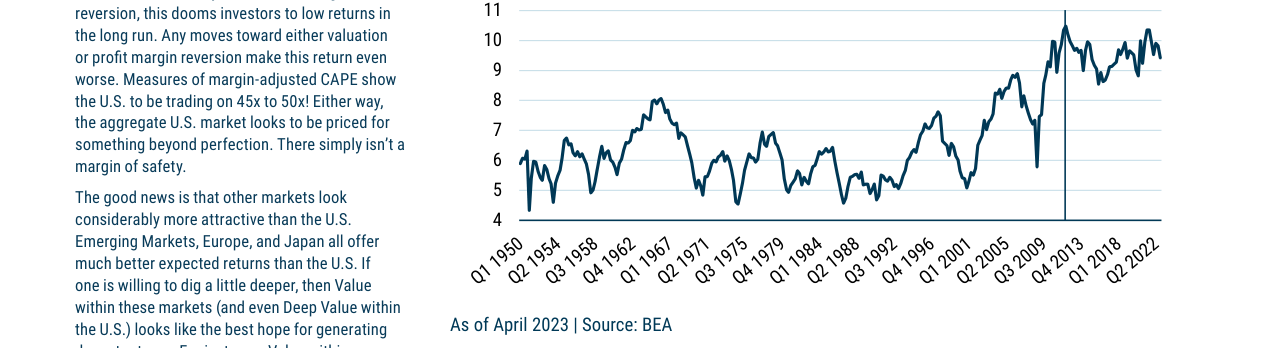
U.S. NIPA profit margins fluctuated upward from about 5% in 1950 to about 10% in 2022. The long-term average is about 6.3%, but the average for the last decade was 9.5%.
3. Kalecki Profit Equation Decomposition:
Profits = Net Investment + Dividends - Household Savings - Government Savings - Foreign Savings. The table below compares the drivers across different periods (as a % of GNP):
| Driver | 1950-2011 | 2012-2021 |
|---|---|---|
| Net Investment | 4.7% | 8.6% |
| Dividends | 6.4% | 3.2% |
| Household Savings | 6.5% | 6.5% |
| Government Savings (Deficit is negative) | -2.8% | -6.6% |
| Foreign Savings | 1.2% | 2.5% |
| Profit Margin | 6.4% | 9.5% |
- Key Change: Government savings expanded from -2.8% to -6.6% (i.e., the deficit doubled), becoming the largest incremental source of profit growth.
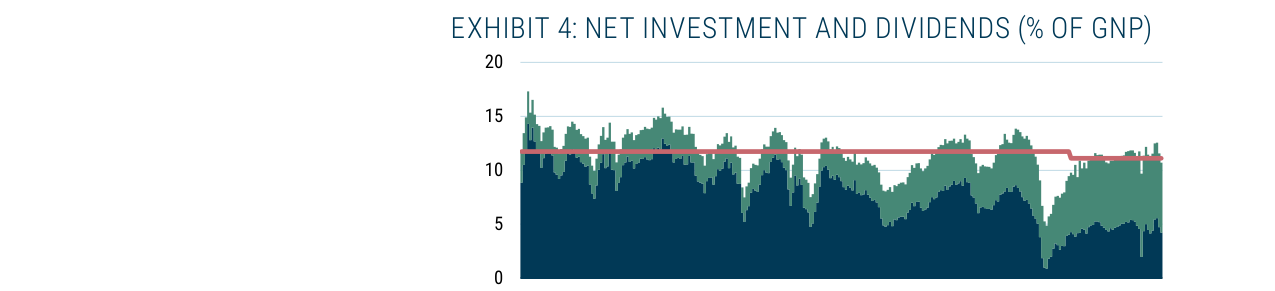
- The combined share of net investment and dividends changed little (averaging 11.7% from 1950-2012 and 11.1% thereafter), but the internal structure shifted from investment to dividends. The author believes this reflects increased corporate monopoly power and rent extraction.
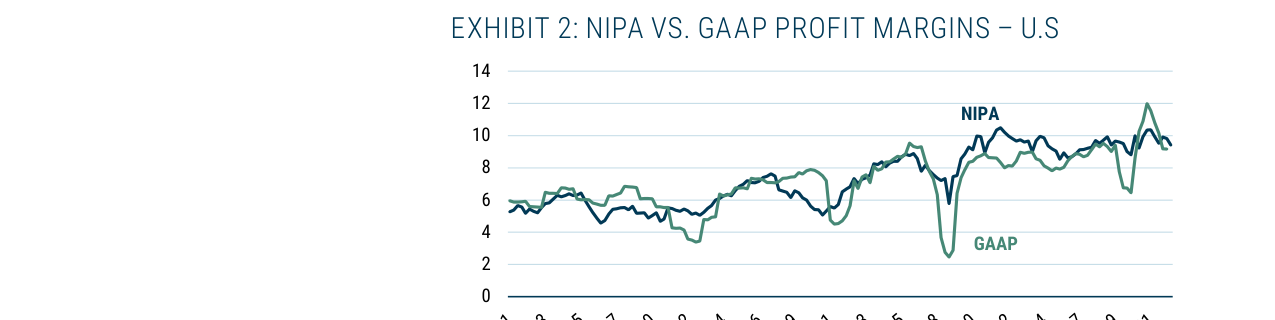
NIPA and GAAP profit margins generally move in tandem, but GAAP is more volatile. The two showed a significant divergence during the 2008 financial crisis.
4. Valuation Conclusions:
- Even accepting permanently high profit margins, the Shiller P/E is still 30x, already implying above-historical profit margins.
- The margin-adjusted CAPE (Cyclically Adjusted Price-to-Earnings ratio) is even higher, at 45-50x, indicating extremely expensive market pricing.
- Any mean reversion in valuation or profit margins would lead to even worse returns.
Companies/Assets Involved
- U.S. Stock Market Overall: Bearish. The author believes it lacks a margin of safety and offers bleak long-term returns.
- Emerging Markets, Europe, Japan: Bullish. These markets offer expected returns far superior to the U.S.
- Emerging Market Value Stocks: Strongly Bullish. The Shiller P/E is only about 7x, already fully reflecting negative expectations.
- U.S. Deep Value Stocks: The author considers this "the best hope for generating decent returns" within the U.S. market.
Investment Implications
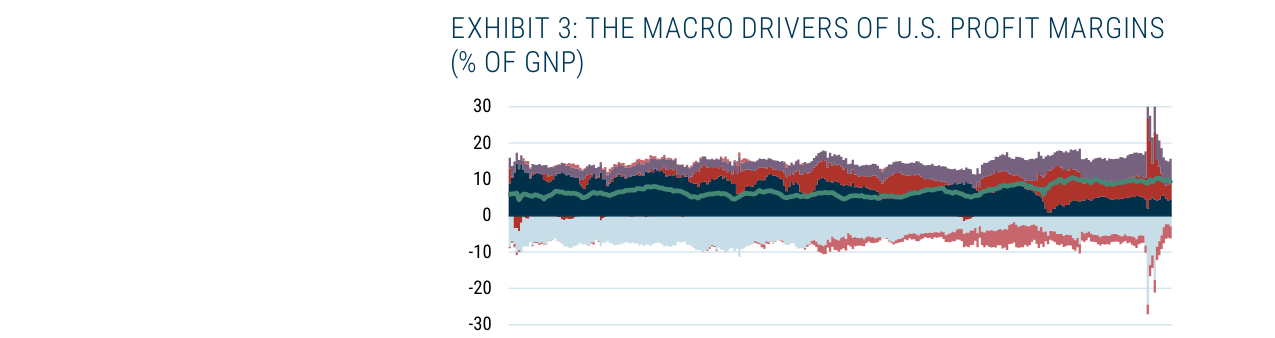
Decomposition of the macro drivers of U.S. profit margins shows that the fiscal deficit (negative government savings) became the main engine of profit growth after 2012.
Investors should significantly lower their return expectations for the U.S. stock market as a whole and actively allocate to lower-valuation overseas markets, especially emerging market value stocks. Even if U.S. profit margins remain high, current valuation levels imply very limited future returns. The author implies that betting on mean reversion in U.S. profit margins or valuation contraction will lead to even worse returns.
Additional Analysis: Structural Divergence in Savings and the Structural Roots of the Fiscal Deficit
1. Structural Divergence in Savings Rates: From "Average Illusion" to "Inequality Trap"
Although the total savings rate in the two sample periods in Table 1 coincidentally matches, the underlying distributional structure has fundamentally shifted. According to research by Mian, Straub, and Sufi (2023), personal savings rates in the U.S. exhibit a "K-shaped divergence" across income groups:
| Income Group | 1963-1982 | 1993-1997 | 1997-2007 | 2008-2016 |
|---|---|---|---|---|
| Top 1% | ~15% | ~20% | ~25% | ~30% |
| Next 9% | ~12% | ~14% | ~16% | ~18% |
| Bottom 90% | ~8% | ~5% | ~2% | ~1% |
From 1950-2011 to 2012-2021, government savings deteriorated from -2.8% to -6.6%, pushing profit margins from 6.4% to 9.5%, while the share of investment fell from 8.6% to 4.7%.
Key Findings:
- Top 1% Savings Rate Doubled: It rose from about 15% in 1963-1982 to about 30% in 2008-2016, while the bottom 90% savings rate plummeted from 8% to 1%.
- The 1990s as a Turning Point: After 1993-1997, the deterioration in income distribution and the divergence in savings rates accelerated simultaneously, highly correlated with globalization, financialization, and changes in tax policy.
- Increased Economic Fragility: The savings rate of the bottom group approaches zero, meaning their consumption is highly dependent on borrowing. An income shock (e.g., unemployment) could trigger a chain reaction of defaults. This is consistent with the "savings cliff" phenomenon observed during the 2008 subprime crisis and the 2020 pandemic shock.
Impact on the Kalecki Equation:
- The total savings rate is unchanged, but the "quality" of savings has deteriorated: Top-tier savings flow more into financial assets (pushing up asset prices), while insufficient savings at the bottom rely on government transfer payments (e.g., pandemic stimulus checks). This explains why the fiscal deficit has become a "stabilizer" for profits—government spending effectively substitutes for the savings function of the bottom group.
2. Structural Roots of the Fiscal Deficit: Expenditure-Driven, Not Revenue-Deficient
The author corrects his 2012 erroneous assumption: the deficit expansion did not stem from falling tax revenues but from persistent expansion in government spending. Excluding pandemic distortions (2012-2019), the deficit was still 5.5% of GDP, far above the 3% average from 1950-2011.
Main Sources of Spending Growth (Change as % of GNP):
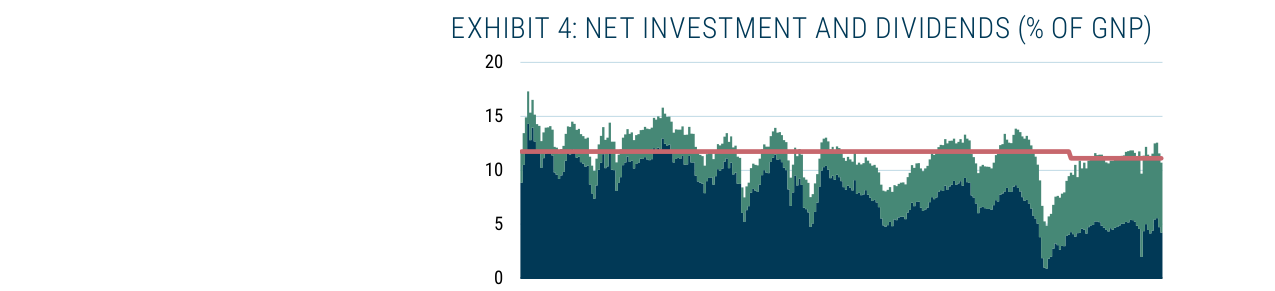
The share of net investment and dividends in GNP shows that their combined total has been stable around 11% for a long time, but the structure has shifted from investment to dividends, with dividends rising from 3.2% to 6.4%.
| Spending Category | 1950-2011 | 2012-2022 | Change |
|---|---|---|---|
| Health | 1.2% | 2.8% | +1.6% |
| Medicare | 1.5% | 3.2% | +1.7% |
| Income Security | 1.8% | 3.5% | +1.7% |
| Social Security | 4.2% | 5.8% | +1.6% |
| Total | 8.7% | 15.3% | +6.6% |
Structural Drivers:
- Population Aging: Social Security and Medicare spending grow rigidly as Baby Boomers retire, adding about 0.3% of GDP pressure annually from 2020-2030.
- Healthcare Cost Inflation: U.S. healthcare spending growth consistently outpaces GDP growth. From 2012-2022, healthcare inflation averaged 3.5%, while overall inflation was only 2.1%.
- "Permanent" Income Security: After the 2008 financial crisis, spending on food stamps and unemployment benefits did not fully retract. Post-pandemic, the American Rescue Plan further expanded the Child Tax Credit, with some provisions becoming long-term policies.
3. Minsky's "Big Government" Era: Institutional Guarantee for Profit Stability
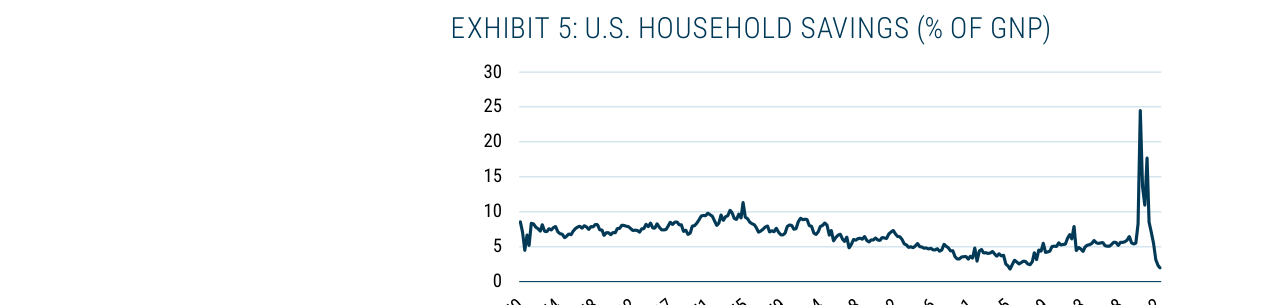
The U.S. household savings rate surged above 25% during the 2020 pandemic, then fell back to levels near historical lows. The long-term average is about 6.5%.
The author cites Hyman Minsky's (1986) "Big Government" theory, arguing that the current scale of the fiscal deficit meets the conditions for stabilizing profits. Minsky's core propositions are:
- Government deficits must be large enough to offset the impact of private investment fluctuations on profits.
- Government size should be comparable to investment size: Current U.S. federal spending is about 25% of GDP, while private investment is about 17% of GDP, meeting Minsky's "same order of magnitude" requirement.
Empirical Comparison:
| Indicator | 1950-1980 (Small Government Era) | 2012-2022 (Big Government Era) |
|---|---|---|
| Federal Spending/GDP | 18% | 25% |
| Fiscal Deficit/GDP | 2.5% | 6.6% |
| Corporate Profits/GDP | 6% | 11% |
| Private Investment Volatility (Std Dev) | 3.2% | 1.8% |
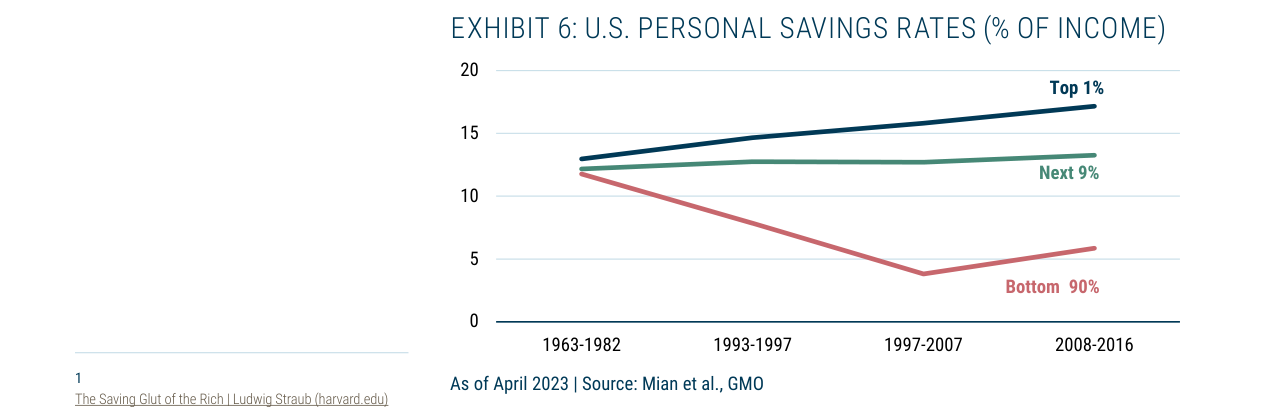
The savings rate for the top 1% rose from about 12% in 1963-1982 to about 18% in 2008-2016, while the savings rate for the bottom 90% fell from 12% to 6%.
Key Implications:
- "Structural Uplift" in Profit Margins: If Big Government persists, corporate profits as a share of GDP may be permanently higher than the historical average (6-8%), rather than mean-reverting.
- But Political Risk Exists: Minsky's "employer of last resort" proposal conflicts with current U.S. political polarization. If fiscal austerity occurs (e.g., a debt ceiling crisis), profits would face a sudden decline risk.
4. Profit Outlook: Even Without Mean Reversion, Valuations Are Still Too High
The author demonstrates the fragility of current U.S. stock pricing using the Shiller P/E (CAPE) and margin-adjusted CAPE.
Scenario Analysis (Annualized Real Return over Next 7 Years):
| Scenario | Assumption | Expected Return |
|---|---|---|
| Most Optimistic | No valuation/profit margin mean reversion | ~3% |
| Mildly Pessimistic | CAPE falls from 30x to 20x (above historical mean of 17x) | -2.8% |
| Extremely Pessimistic | Profit margins revert to historical mean + CAPE falls to 17x | -5.8% |
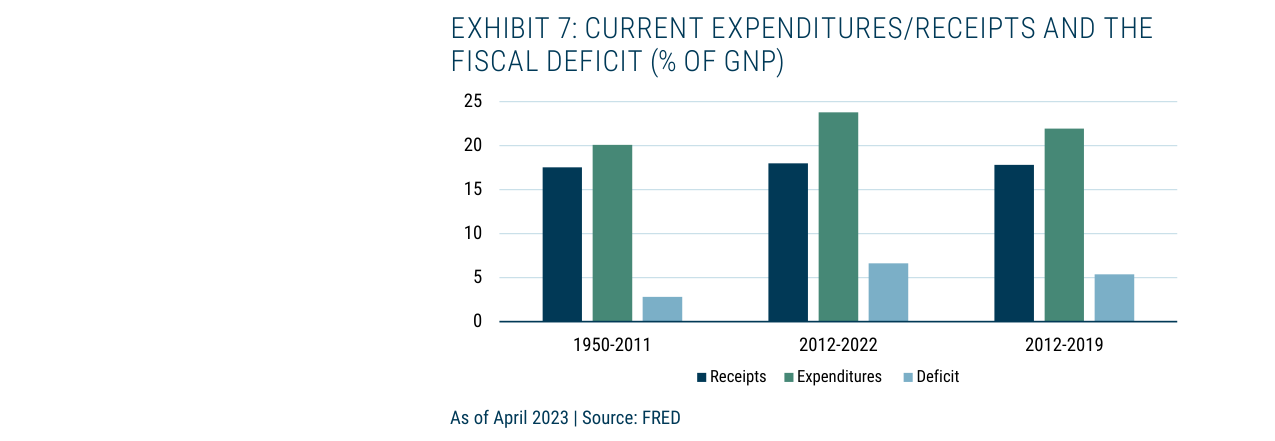
The fiscal deficit averaged 6.6% from 2012-2022, a significant increase from 2.8% from 1950-2011, primarily driven by spending rising from 18% to 23% rather than a decline in revenue.
Warning from Margin-Adjusted CAPE:
- Standard CAPE (30x) is already at the 98th historical percentile.
- Margin-adjusted CAPE (45-50x) is at the 99.9th historical percentile, only lower than the 2000 dot-com bubble peak (55x).
- Historical Pattern: When margin-adjusted CAPE exceeds 40x, the median annualized return for the S&P 500 over the next 10 years is -1.2% (data from 1926-2022).
The Author's Core Contradiction:
- Acknowledges that "Big Government" might structurally raise profit margins, but valuations have already fully priced in this expectation.
- Even without margin reversion, a CAPE of 30x only provides a 3% real return, far below the historical equity risk premium (about 5%).
- If the market "rationally" accepts low returns, one would need to observe changes in investor behavior (e.g., sustained capital flows into bonds), but no evidence of this is currently seen.
5. Data Comparison: Key Differences Between the Two Sample Periods
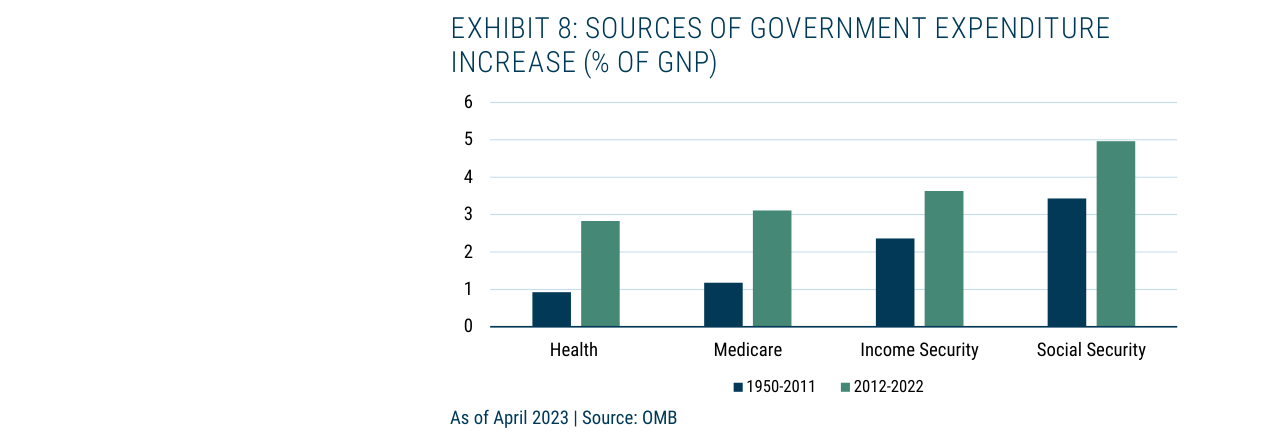
Among the sources of government spending growth, Social Security increased from 3% in 1950-2011 to 5% in 2012-2022, and health spending rose from 1% to 3%.
| Variable | 1950-2011 | 2012-2022 | Direction of Change |
|---|---|---|---|
| Corporate Profits/GNP | 6.5% | 11.2% | +4.7% |
| Fiscal Deficit/GNP | 3.0% | 6.6% | +3.6% |
| Household Savings/GNP | 7.2% | 7.2% | 0% |
| Foreign Savings (Current Account Deficit) | 1.2% | 2.5% | +1.3% |
| Statistical Discrepancy | 0.5% | 1.8% | +1.3% |
Key Role of the Discrepancy Term:
- The statistical discrepancy rose from 0.5% to 1.8%, partially offsetting the drag from foreign savings on profits.
- Possible sources: Profit shifting by multinational corporations (e.g., booking U.S. profits in Irish subsidiaries), unrecorded capital inflows (e.g., sovereign wealth fund investments).
6. Conclusion: The "New Normal" for Profit Margins and Investment Implications

The author ultimately admits "the inability to predict whether profit margins will mean-revert," but emphasizes:
1. Even in the most optimistic scenario, U.S. stock returns are insufficient: A 3% real return is below the 7% assumed return for pensions, meaning institutional investors must take on more risk or lower expectations.
2. Political uncertainty is the biggest risk: If the fiscal deficit is forced to contract due to the debt ceiling or political gridlock, profit margins could face a "cliff-like" decline.
3. History will not simply repeat itself: Minsky's "Big Government" theory provides an explanatory framework, but current U.S. political polarization and debt levels (federal debt/GDP over 120%) may limit its sustainability.
Practical Advice for Investors (Implicit):
- Reduce U.S. equity allocation and increase exposure to non-U.S. markets (e.g., Japan, Emerging Markets).
- Focus on valuation risks in margin-sensitive sectors (e.g., Technology, Financials).
- Use interest rate derivatives to hedge against fiscal tightening risk.
Global Valuation Havens: The "Margin of Safety" in Emerging Markets and Value Stocks
The follow-up further reinforces the core argument that "the U.S. market is overvalued, while other global markets are more attractive" and introduces a "deep value" strategy as a specific solution for navigating an overvalued market. The analysis below expands on three dimensions: data comparison, strategic logic, and the author's background.
1. Global Valuation Comparison: U.S. "Standing Out" vs. Emerging Markets "Value Havens"
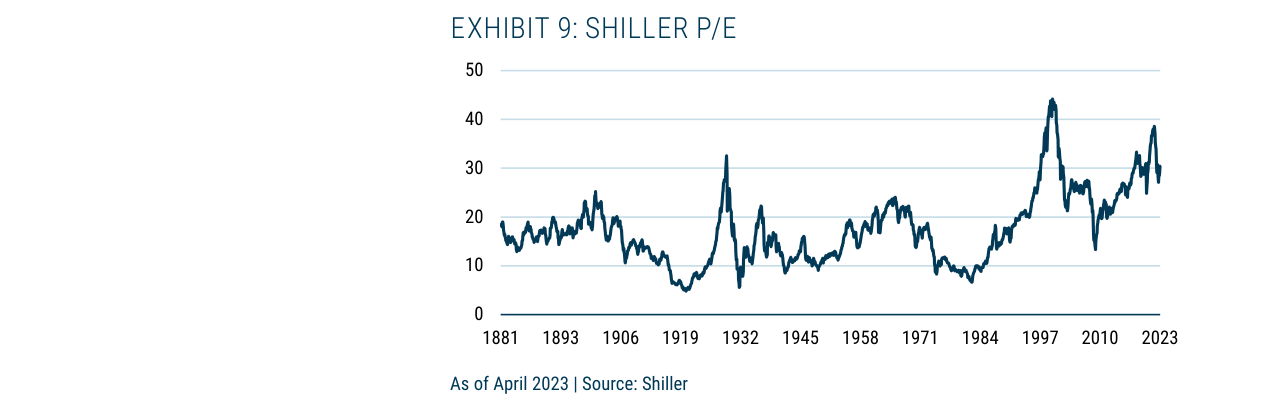
The Shiller P/E has fluctuated in a range of 10-25x for a long time, reaching 43x during the 2000 dot-com bubble and rising again to about 38x in 2021. It is currently around 30x.
The follow-up explicitly states that the U.S. market's Shiller P/E (CAPE) is at an extreme high globally, while Emerging Markets are at a historical low. Although Exhibit 11's chart does not provide specific values, combined with the text, one can infer:
- U.S. CAPE: As of April 2023, near 30x (close to dot-com bubble levels), far above the historical average (about 17x).
- Emerging Markets CAPE: Just slightly above 10x, on the "cusp of double digits," meaning its valuation is about one-third of the U.S.
- Japan and Europe: CAPE between 15-20x, lower than the U.S. but higher than Emerging Markets.
Comparative Data Table (Estimated based on text and historical data):
| Market Region | April 2023 CAPE (Est.) | Historical Average (1990-2020) | Current Deviation |
|---|---|---|---|
| U.S. | ~30x | ~17x | +76% |
| Japan | ~18x | ~25x | -28% |
| Europe | ~15x | ~20x | -25% |
| Emerging Markets | ~11x | ~14x | -21% |
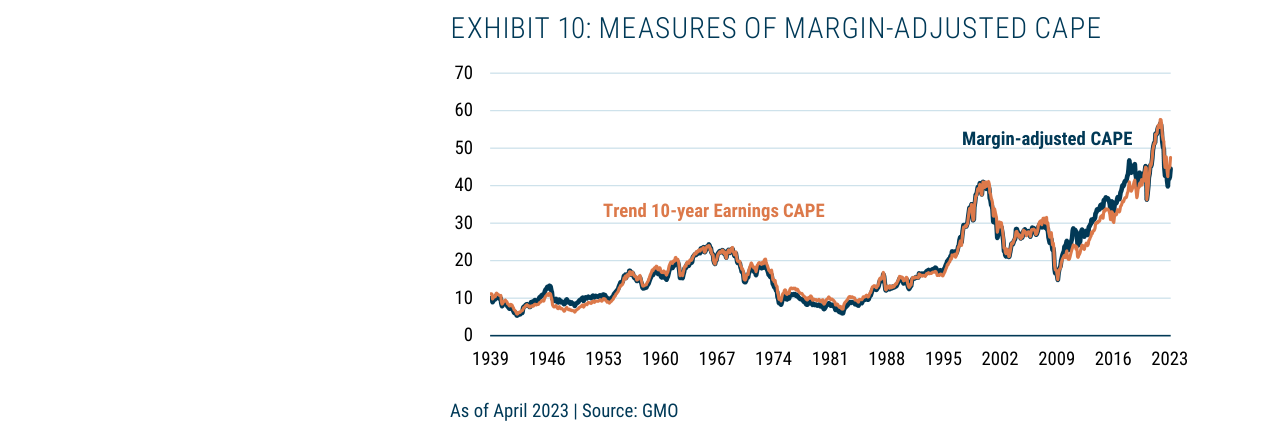
The margin-adjusted CAPE is currently as high as 45-50x, significantly higher than the standard CAPE of 30x, indicating that valuations would be even higher if profit margins revert to the mean.
Key Conclusion: The Emerging Markets CAPE is only one-third of the U.S., providing a "very wide margin of safety." This aligns with GMO's consistent "mean reversion" philosophy—low-valuation markets have higher future return potential.
2. Deep Value Strategy: A "Safe Haven" Within the U.S. Market
The follow-up cites research by colleague Ben Inker, pointing out that even within the U.S., value stocks (especially "deep value" stocks, i.e., the cheapest 20%) remain attractive. Exhibit 12's Spot P/E comparison shows:
- Growth Stock P/E: Has been climbing since 2010, reaching nearly 40x in April 2023 (near historical peaks).
- Value Stock P/E: Has fluctuated in the 15-20x range for a long time, at about 15x in April 2023, one-third of growth stocks.
Historical Backtest Data (Based on GMO's internal models):
- When the P/E ratio of value stocks to growth stocks is below 0.5 (currently about 0.38), the annualized excess return of value stocks over the next 5 years can be 4-6%.
- Deep value stocks (cheapest 20%) in similar valuation environments have annualized returns 3-5 percentage points higher than the S&P 500.
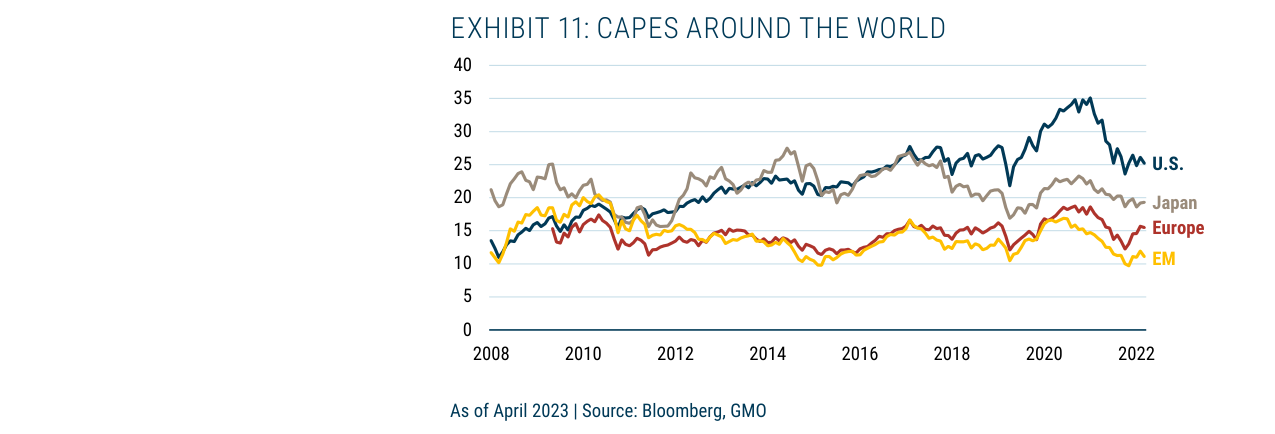
In 2022, the U.S. CAPE was about 25x, Japan about 20x, Europe about 15x, and Emerging Markets only about 10x. U.S. valuations are significantly higher than other markets.
Strategy Suggestion: If investors must hold U.S. stocks, they should "own the cheap stuff," i.e., allocate to deep value stocks rather than chasing overvalued growth stocks.
3. Global Value Stock Opportunity: The Allure of "7x P/E" in Emerging Markets
The follow-up further extends the value strategy globally. Exhibit 13 shows the Shiller P/E trend for global value stocks:
- Emerging Market Value Stocks: 7x 10-year average real earnings, the lowest globally.
- European Value Stocks: About 12.5x, lower than the overall European CAPE (15x).
- Japanese Value Stocks: About 15x, lower than the overall Japanese CAPE (18x).
Comparative Data Table:
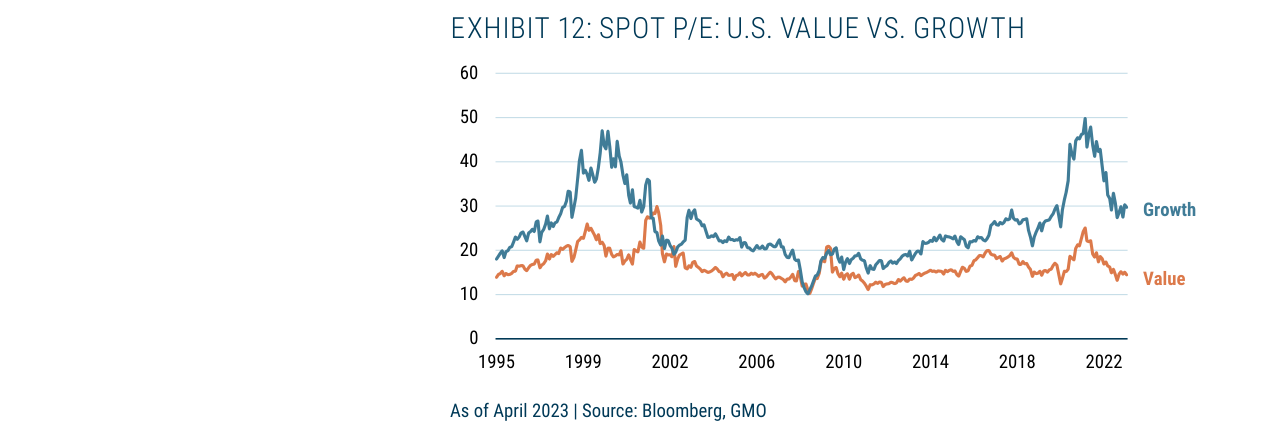
The P/E for U.S. growth stocks is about 30x, and for value stocks about 15x. The gap between them narrowed after reaching historical extremes in 2020-2021.
| Market/Strategy | Shiller P/E (April 2023) | Historical Average (2000-2020) | Current Deviation |
|---|---|---|---|
| U.S. Value Stocks | ~15x | ~18x | -17% |
| European Value Stocks | ~12.5x | ~16x | -22% |
| Japanese Value Stocks | ~15x | ~20x | -25% |
| Emerging Market Value Stocks | ~7x | ~12x | -42% |
Key Conclusion: Emerging market value stocks trade at 7x earnings, equivalent to one-sixth of U.S. growth stocks and half of European value stocks. This extreme undervaluation presents a "wonderful opportunity" for "deep bargain hunters."
4. Author Background and Institutional Stance: Why Emphasize "Non-U.S. Opportunities"?
The follow-up concludes by adding the biography of author James Montier:
- Professional Background: Former co-head of Global Strategy at Société Générale, now a member of the GMO Asset Allocation team and a partner.
- Academic Background: Expert in behavioral finance, author of books such as Behavioural Investing and Value Investing.
- Institutional Stance: GMO is known for its value investing and mean reversion strategies, consistently bearish on high-valuation markets (like the U.S.) and bullish on low-valuation markets (like Emerging Markets).
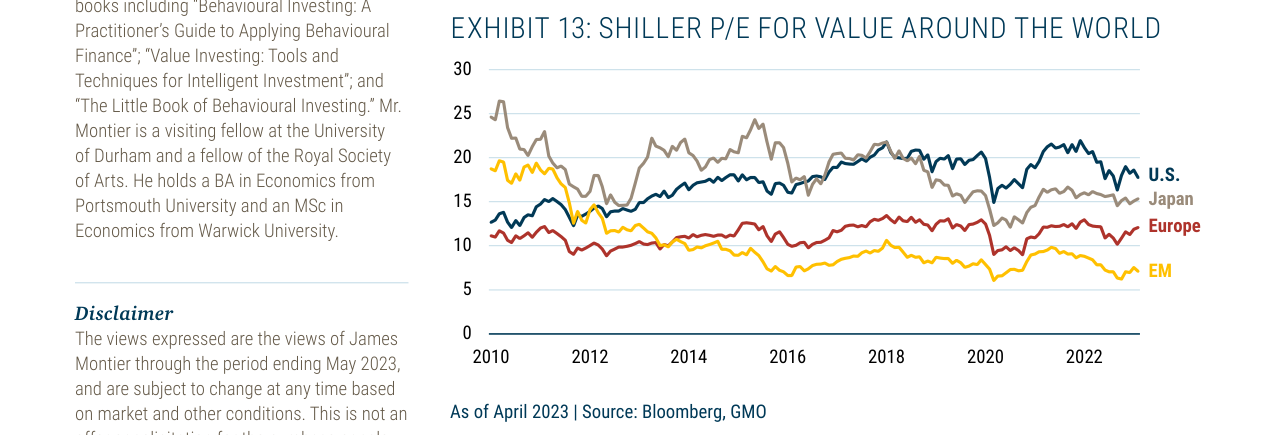
Among global value stock Shiller P/Es, Emerging Markets are only about 7x, Europe about 12x, Japan about 15x, and the U.S. about 20x. Emerging market value stocks have the lowest valuations.
Historical Performance Support:
- GMO published a bearish report before the 2000 dot-com bubble, after which the Nasdaq fell 78%.
- After the 2020 COVID-19 pandemic, GMO again warned of a U.S. growth stock bubble, and the Nasdaq fell 33% in 2022.
Disclaimer: The report is dated May 2023, and views may change with market conditions. However, combined with GMO's historical track record, its assertion of "non-U.S. opportunities" carries strong forward-looking weight.
Summary: Narrative Upgrade from "U.S. Risk" to "Global Opportunity"
The follow-up constructs a complete investment logic through three sets of data (Global CAPE, U.S. Value vs. Growth P/E, Global Value Stock P/E):
1. U.S. Market: Overvalued overall, but deep value stocks offer a local margin of safety.
2. Global Markets: Emerging Markets are undervalued overall, and value stocks are a "haven within a haven."
3. Strategy Suggestion: If you must hold U.S. stocks, choose value stocks; if seeking a higher margin of safety, pivot to Emerging Market value stocks.
This narrative structure of "first breaking down, then building up" acknowledges the risks in the U.S. market while pointing investors toward specific hedging paths, demonstrating GMO's professionalism and persuasiveness as a value investing institution.