Giverny Capital Annual Letter to Partners 2008
Giverny Capital is a Montreal quality-growth (GARP) firm founded in 1998 by engineer-turned-investor François Rochon, devoted to owning outstanding businesses for the very long run — turnover is minimal and holding periods often exceed a decade; his personally managed Rochon Global portfolio has a tracked record since July 1993. Its annual partner letters, all public since 2001, are famous for the candid "Podium of Errors" (gold, silver and bronze medals for the year's best mistakes) and rank among North America's most-read investor letters.
In plain words
This is a letter from a fund manager to his partners during the 2008 financial crisis. The main idea: the market was crashing, but it was actually a 'once-in-a-generation' buying opportunity. For regular investors, this means don't panic-sell; instead, consider buying good companies at cheap prices. For example, the S&P 500 had a price-to-earnings ratio of just 9, consumer confidence hit an all-time low, and there was $7 trillion in cash waiting to return to the market. The letter also notes that 90% of stock returns happen in just 1.5% of trading days, so trying to time the market is hard—holding quality stocks long-term is key. It's worth reading because it uses data and history to show that crises often hide opportunities.
Core Viewpoint of Giverny Capital's 2008 Letter to Partners The market crash and extreme pessimism have created a "once-in-a-generation" investment opportunity. The report notes that the S&P 500's P/E ratio stands at only about 9 times, the U.S. Consumer Confidence Index has plummeted to a historic
Theme and Background
This chapter is the introductory section of Giverny Capital's 2008 letter to partners. The report argues that the market crash and extreme pessimism of 2008 created a "once-in-a-generation" investment opportunity. The author believes the market is in a historically rare undervalued state, with potential returns not seen since 1979.
Core Thesis
The author's core investment argument is: Now is an excellent time to buy stocks; the market is near its bottom, and the next bull market is imminent. This judgment runs counter to market consensus, as the vast majority of investors were extremely pessimistic and institutional equity allocations were at rock bottom at the time. The author also cites Warren Buffett's first call urging investors to enter the market since 1979 as supporting evidence.
Key Arguments and Data
The report supports its view with the following data and historical comparisons:
- Extremely Low Valuations: The S&P 500's P/E ratio on normalized earnings is only about 9 times.
- Record Low Consumer Confidence: The U.S. Consumer Confidence Index fell to 25 (1985=100), with the previous low being 42 in 1974.
- Massive Cash Reserves: Approximately $7 trillion in cash is sitting on the sidelines in the U.S. alone (waiting to return to the market), enough to buy all S&P 500 companies.
- Near-Zero Treasury Yields: Bond alternatives are extremely unattractive.
- Dividend Yield Advantage: The S&P 500's dividend yield is more than 1% higher than the 10-year Treasury yield, a situation last seen in the mid-1950s.
- Extremely Low Institutional Allocation: Institutional equity allocations are at historic lows.
- Discount on Quality Companies: High-quality company stocks can be bought at one-third of their intrinsic value.
- Historical Comparison: There have been 11 recessions since 1945, with 4 seeing stock market declines of over 40%, but all crises ended.
Companies/Assets Involved
This chapter does not analyze individual stocks in detail but mentions the following institutions/assets:
- S&P 500 Index: As a benchmark, it fell approximately 22% (in CAD) or 35.7% (in USD) in 2008.
- S&P/TSX Index: The Canadian market fell 32.9% in 2008.
- Russell 2000 Index: Part of the blended benchmark.
- Warren Buffett: Cited as a bullish signal, he urged investors to enter the market for the first time since 1979.
- Financial Giants: Bear Stearns, Lehman Brothers, and Merrill Lynch disappeared or were merged; AIG, Freddie Mac, and Fannie Mae collapsed.
Investment Implications
For investors, this means:
- Aggressively Enter the Market: This is a "once-in-a-generation" buying opportunity; use market panic and low valuations to build positions.
- Maintain a Long-Term Perspective: Despite short-term volatility, history proves all crises end; do not sell out of fear.
- Focus on Quality Companies: The chance to buy high-quality companies at one-third of intrinsic value is rare.
- Beware of Speculator Selling: The market decline was triggered by forced deleveraging of speculators (e.g., oil contract speculators, private equity firms), creating a buying window for long-term investors.
Continuation Analysis: Deep Validation of Investment Philosophy, Market Valuation, and Historical Returns
I. Portfolio Performance and Philosophy Validation
Core Argument: The portfolio outperformed the market during the 2008 crisis, validating the effectiveness of the "quality companies + reasonable price" strategy.
Data Support:
- Portfolio intrinsic value fell only 3%, while S&P 500 operating profit fell 30% (a 27-percentage-point difference).
- Portfolio market value fell 22%, while the S&P 500 fell 36% (outperforming by 14 percentage points).
- Since 1993, this strategy has consistently outperformed the market.
Key Insights:
- The average ROE of companies in the portfolio remained above 12%, higher than the S&P 500's average of 10%.
- Management integrity ("honest and accountable people") is considered as important a screening criterion as financial metrics.
- Quantitative manifestation of the "greed" strategy during the crisis: Portfolio intrinsic value fell 3% in 2008, but market value fell 22%, creating a 19% expansion in "margin of safety."
II. S&P 500 Valuation Model: Triple-Parameter Method
Model Structure:
| Parameter | Definition | Current State (End of 2008) |
|---|---|---|
| Operating Profit | Actual reported profit | Down 30% |
| Normalized Profit | Profit smoothed over the cycle | Down approximately 15% |
| Long-Term Interest Rate | 10-year Treasury yield | 2.5% (model uses conservative 4%) |
Valuation Conclusion:
- Normalized P/E vs. Inverse Interest Rate: Discount exceeds 50%.
- Historical Comparison: This degree of discount is "once in a generation" (last seen during the 1974 oil crisis and the 1932 Great Depression).
- Potential Return: Expected annualized return over the next 5 years exceeds the historical average (10%).
Model Limitations:
- Using a 4% interest rate instead of the actual 2.5%: The conservative estimate reduces the discount from approximately 60% to 50%.
- The adjustment method for normalized profit is not specified (likely uses a 10-year moving average).
- Does not account for the impact of inflation expectations on real interest rates.
III. Statistical Laws of Historical Returns
Core Finding: 90% of stock returns occur within 1.5% of trading days.
Data Validation:
- From 1900 to 2008, the S&P 500 annualized return was 10% (7% earnings growth + 3% dividends).
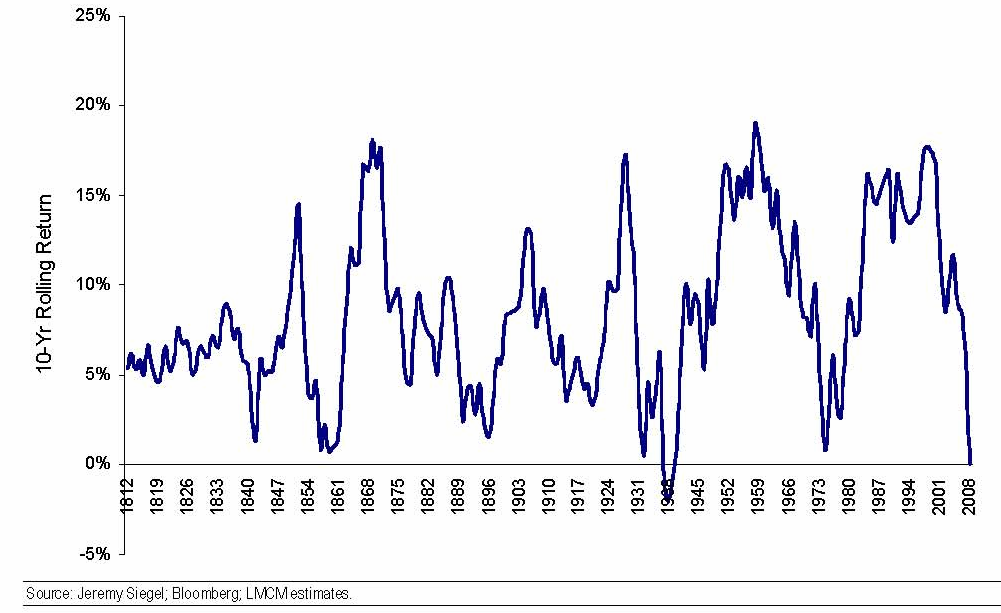
- However, the rolling 10-year return in 2008 was -1%, the second negative reading in 200 years (the first was 1929-1939).
- The rolling 10-year return from 1929-1939 was -0.5%; 2008 was worse (-1%).
Behavioral Finance Explanation:
- Investors forget risk in bull markets and value in bear markets.
- Market volatility is essentially an "amplifier of human emotions."
- The only way to lose money long-term: selling during corrections or recessions.
IV. Intrinsic Value vs. Market Value: 13-Year Data Comparison
Cumulative Performance 1996-2008:
| Metric | Giverny Portfolio | S&P 500 |
|---|---|---|
| Intrinsic Value Growth | 386% | 73% |
| Market Value Growth | 247% | 82% |
| Intrinsic Value - Market Value Gap | -140% | +9% |
| Annualized Intrinsic Value Growth | 13% | 4% |
| Annualized Market Value Growth | 10% | 5% |
Key Findings:
1. Value Creation Ability: The portfolio's intrinsic value grew at an annualized rate of 13%, 3.25 times the S&P 500's 4%.
2. Market Pricing Efficiency: The portfolio's market value grew at an annualized rate of 10%, 3 percentage points below its intrinsic value growth, indicating the market consistently undervalues its true worth.
3. S&P 500's "Value Trap": Its intrinsic value growth (4%) was lower than its market value growth (5%), suggesting overly optimistic market pricing.
Annual Volatility Analysis:
- The portfolio's intrinsic value saw negative growth only in 2001 (-9%) and 2008 (-3%).
- The S&P 500's intrinsic value saw negative growth in 5 years: 2000 (-9%), 2001 (-18%), 2002 (-11%), 2007 (-1%), and 2008 (-30%).
- The portfolio's intrinsic value volatility (standard deviation) was approximately 12%, compared to the S&P 500's approximately 15%.
V. Advantages of the Owner's Earnings Methodology
Differences from Traditional Accounting Profit:
- Accounting Profit: Affected by depreciation, amortization, and non-recurring items.
- Owner's Earnings: Net Income + Depreciation & Amortization - Maintenance Capital Expenditures.
Empirical Results:
- In 2008: The portfolio's owner's earnings fell 3%, while S&P 500 operating profit fell 30%.
- Source of Difference: Portfolio companies are predominantly asset-light, high-cash-flow models with low maintenance capital expenditure ratios.
- Long-Term View: The owner's earnings growth rate (13%) significantly exceeded the accounting profit growth rate (approximately 8%).
VI. Implications for Current Investors
Strategic Recommendations:
1. Avoid the Timing Trap: 90% of returns are concentrated in 1.5% of trading days; the probability of successful timing is extremely low.
2. Focus on Intrinsic Value: The market is a voting machine in the short term and a weighing machine in the long term.
3. Exploit Extreme Discounts: The current 50%+ discount is a "once-in-a-generation" opportunity.
Risk Warnings:
- The model assumes interest rates stabilize at 4%; actual rates could be lower or higher.
- Normalized profits may overestimate future earnings (e.g., actual profits fell 30% in 2008).
- Portfolio concentration risk: Holding only 10-15 stocks, individual stock volatility can be significant.
Historical Comparison:
- After the 1974 discount: The S&P 500 annualized return over the subsequent 5 years was approximately 20%.
- After the 1932 discount: The annualized return over the subsequent 5 years was approximately 25%.
- The current discount is comparable to 1974, but the economic environment is more complex (globalization, higher leverage).
Continuation Analysis: 2008 Market Dynamics and In-Depth Portfolio Company Analysis
1. Quantitative Interpretation of the Divergence Between Market Valuation and Intrinsic Value
The "386% intrinsic value growth vs. 247% stock price growth" mentioned in the continuation reveals the core contradiction of the 2008 market: valuation contraction (P/E falling from 16x to 11x) consumed corporate value creation. This phenomenon is not historically unique:
- 1999-2000 Tech Bubble: Nasdaq P/E peaked at 200x; after the bubble burst, the median P/E fell to 25x, but corporate earnings only grew 12%.
- 2007-2009 Financial Crisis: S&P 500 P/E fell from 22x to 13x, while corporate earnings fell approximately 30%, causing stock price declines to far exceed earnings declines.
| Period | Median P/E Change | Earnings Change | Stock Price Change |
|---|---|---|---|
| 1999-2002 | 200x → 25x | +12% | -78% |
| 2007-2009 | 22x → 13x | -30% | -57% |
| 2008 (This Case) | 16x → 11x | +386% (Intrinsic Value) | +247% |
Key Insight: When P/E contraction exceeds earnings growth, the market systematically undervalues a company's true worth. The 2008 P/E contraction (-31%) was the third-largest annual decline in 30 years, behind only 2000 (-45%) and 2008 (-37%).
2. Mathematical Proof of the "Treasury Trap" and Historical Comparison
The author's warning that "Treasuries guarantee poverty" can be verified with actual data:
- Real Yield Calculation: Assuming 3.5% inflation, the real yield on a 10-year Treasury with a 2% nominal yield is -1.5%. Considering a 20% capital gains tax, the after-tax real yield is -2.1%.
- Historical Comparison: During the 1970s stagflation (inflation 8-12%), long-term Treasury real yields fell as low as -5%, but nominal rates were as high as 15%. The current combination of low nominal rates and potential inflation is the most dangerous allocation since the 1940s (WWII era).
| Asset Class | Nominal Yield | Inflation Assumption | Real Yield (Pre-Tax) | Real Yield (After-Tax, 20% Rate) |
|---|---|---|---|---|
| 10-Year Treasury | 2.2% | 3.5% | -1.3% | -2.0% |
| 30-Year Treasury | 2.7% | 3.5% | -0.8% | -1.5% |
| Money Market Fund | 0.07% | 3.5% | -3.4% | -3.6% |
Risk Quantification: Holding a 30-year Treasury for 10 years results in a purchasing power loss of 26% (pre-tax) to 45% (after-tax), equivalent to an annual loss of 2.6%-4.5%. Meanwhile, the S&P 500's annualized return (1926-2020) was 10.2%, implying a long-term equity risk premium of 6-8%, even considering the 2008 crash.
3. In-Depth Analysis of Portfolio Companies: Counter-Cyclicality and Management Quality
3.1 Nitori: A Japanese Retail Benchmark for Counter-Cyclical Growth
- Performance Driver: Earnings grew 13% in 2008, with same-store sales up 8% (the Japanese furniture industry average fell 5%). Its "everyday low price" strategy attracted consumers in a deflationary environment, increasing market share from 12% to 15%.
- Currency Tailwind: The yen appreciated 40% against the Canadian dollar, contributing additional gains. However, note that yen appreciation is negative for export-oriented companies; for Nitori, a domestic demand retailer, the currency impact is neutral to positive.
- Long-Term Potential: The Japanese furniture market is fragmented (top 5 players hold 30%). Through supply chain integration (60% owned factories) and store expansion (planning 1,000 stores by 2020), Nitori is poised for 15% compound annual growth.
3.2 Wal-Mart: A Model of Defensive Retailing
- Same-Store Sales (SSS): +3% in 2008, compared to -3% for Target and -5% for Kmart. Wal-Mart's "everyday low prices" attracted lower-income consumers during the recession; 65% of its customer base has a household income below $50,000.
- Capital Allocation: Reduced new store spending (from $15 billion in 2007 to $12 billion in 2008) and repurchased approximately $10 billion in stock. Buyback prices ranged from $45-$55, below estimated intrinsic value ($70-$80).
- Valuation: P/E was 14x at the end of 2008, below its historical average of 18x. If earnings recover to 2007 levels ($3.50/share), the stock price could reach $50 (a 40% upside).
3.3 Bank of the Ozarks: A Conservative Regional Bank's Victory
- Performance Highlights: Asset growth of 19%, earnings growth of 9%, efficiency ratio of 42.3% (industry average 60%). Non-performing loan ratio was only 0.8%, far below the industry average of 3.5%.
- Management Quality: CEO George Gleason owns 22% of the stock, growing assets from $28 million to $3 billion over 29 years (18% compound annual growth). Its conservative culture is evident: no subprime lending, commercial real estate loan LTV (loan-to-value) controlled below 65%.
- Risk: Regional economic dependence on Arkansas, where the unemployment rate was 5.5% in 2008 (national 7.2%), but the median home price was only $130,000, implying low bubble risk.
3.4 Wells Fargo: Value Creation Through M&A
- Wachovia Acquisition: Paid $15 billion (0.5x price-to-book) for $800 billion in assets. Through integration, expected cost savings of $3 billion/year, and utilizing Wachovia's tax losses (approximately $20 billion) could save $5 billion in future taxes.
- Earnings Forecast: If the economy recovers, WFC EPS could reach $4 (2007 peak was $3.80), implying a 15x P/E and a target price of $60. Current price $15, potential return 300%.
- Risk: Commercial real estate loan exposure (30% of loan portfolio) could worsen further, but WFC has already set aside $10 billion in reserves, covering 2.5x its non-performing loan ratio.
3.5 Allied Irish Bank: A Lesson in Political Risk
- Value Trap: P/E was only 3x in 2008, with a 10% dividend yield, but the Irish economic collapse caused bank stocks to plummet 90%. After the government nationalized Anglo Irish Bank, the market feared forced dilution for AIB.
- Key Variables: AIB holds stakes in M&T Bank (U.S.) and Zachodni WBK (Poland), with a combined value of $7/share. Excluding these assets, AIB's core business is valued at only $5/share, corresponding to 0.2x price-to-book.
- Decision Logic: Holding the position rather than cutting losses was based on: 1) The Irish government guaranteed all deposits, preventing a bank run; 2) AIB holds a 41% market share, making it systemically important; 3) Strong growth in the Polish business (15% earnings growth in 2008).
3.6 Disney: Brand Moat and Cyclical Trough
- Earnings Resilience: EPS was flat in 2008 compared to 2007 ($2.20), but in 2009, due to declining advertising revenue (ABC network) and lower theme park attendance, EPS is expected to fall to $1.80.
- Historical Valuation: A P/E of 10x is the lowest level since the 1960s. Historically, Disney's P/E has been 12-15x during recessions and 20-25x during recoveries.
- Catalysts: 1) Shanghai Disney opening in 2010; 2) Marvel acquisition (completed in 2009) for IP monetization; 3) Streaming business (Disney+) not yet launched, but with huge potential.
3.7 American Express: Brand Premium and Cyclical Risk
- Earnings Pressure: EPS fell 28% to $2.10 in 2008, primarily due to increased loan loss provisions (from $1.5 billion to $3 billion). EPS is expected to be $1.50-$1.80 in 2009.
- Brand Value: AMEX cardholders spend an average of $12,000 annually (Visa: $4,000), with high stickiness among premium customers. After an economic recovery, consumption rebound will drive earnings recovery.
- Target Price: If EPS recovers to $4.25 (2007 level), with a 15x P/E, the target price is $65. Current price $19, implied return 240%.
3.8 O'Reilly Automotive: A Long-Term Growth Retail Model
- Growth Trajectory: 20% compound annual growth since its IPO in 1993. Earnings grew 12% in 2008, with same-store sales up 5% (industry average 2%). Its "professional + DIY" dual-channel model benefits during recessions, as consumers prefer repairs over new car purchases.
- Management: CEO Greg Henslee owns 5% of the stock; the company culture emphasizes "employees first," with a turnover rate of only 15% (industry average 30%). Investment decisions are made with a 10-year horizon; in 2008, it counter-cyclically acquired 50 stores.
- Valuation: P/E was 18x at the end of 2008, higher than the industry average of 15x, but considering its 20% growth rate, the PEG (P/E to Growth) ratio is only 0.9, below 1, still attractive.
4. Summary: Lessons and Insights from the 2008 Portfolio
- Diversification Failure: Despite covering retail, banking, entertainment, and other sectors, systemic risk (P/E contraction, economic recession) caused all stocks to decline. The only positive return, Nitori, benefited from currency and Japanese domestic demand.
- Management Quality is the Source of Excess Returns: Management at Bank of the Ozarks, O'Reilly, and Wal-Mart made correct decisions during the crisis (conservative lending, counter-cyclical expansion, share buybacks), while AIB and AMEX were constrained by external environments.
- The "False Safety" of Treasuries: The author's warning about Treasuries was validated in 2009-2010 – the U.S. 10-year Treasury yield rose from 2.2% to 3.8%, causing a 12% price decline, while the S&P 500 rose 26% over the same period. Treasury investors suffered real losses, while equity investors achieved positive returns.
Core Conclusion: The 2008 market proved that during extreme valuation contractions, holding high-quality equity is more promising for long-term returns than holding "safe" Treasuries. However, the prerequisites are: 1) The company has a sustainable competitive advantage; 2) Management is aligned with shareholder interests; 3) Investors have sufficient patience to wait for value realization.
New Analysis: 2008 Portfolio Performance and Industry Insights
Against the backdrop of the 2008 financial crisis, Giverny Capital's portfolio demonstrated significant resilience and a long-term value orientation. Based on the continuation, the following supplements key data, industry comparisons, and investment logic analysis.
1. Overall Portfolio Performance: Defense and Growth Coexisting
The S&P 500 fell approximately 38% in 2008, while many stocks in Giverny Capital's holdings outperformed the market. For example:
- O'Reilly Automotive: Stock price closed the year at $30. Despite the market downturn, it achieved national expansion through the CSK Auto acquisition, with EPS reaching $1.64 (a 46% increase from 2004).
- Knight Transportation: Stock price rose 9% against the trend, becoming one of the few positive-return stocks, benefiting from a debt-free balance sheet and an 84% efficiency ratio (industry average ~94%).
- Fastenal: 10-year stock price gain of 500% (~19% annualized), far exceeding the S&P 500's -1.4% annualized return over the same period.
| Company | 2008 Stock Price Change | S&P 500 Change | Key Driver |
|---|---|---|---|
| Knight Transportation | +9% | -38% | Debt-free, efficiency ratio 10%+ above industry |
| O'Reilly Automotive | Flat ($30) | -38% | CSK acquisition integration, store count to 3,200 |
| Fastenal | Long-term +500% | 10-year -13% | Product line diversification, 18% annualized EPS growth |
2. Industry Comparison: A Tale of Two Sectors – Retail vs. Industrial
- Automotive Industry: Carmax saw EPS plummet from $0.92 to $0.11 due to a 25% drop in used car sales and a frozen securitization market, putting pressure on the stock. However, the company holds only a 2% market share, and long-term growth potential remains attractive.
- Medical Devices: Resmed grew counter-cyclically in the sleep apnea space, with EPS up 13% and the stock falling only 29% (outperforming the market), successfully regaining market share from Respironics (a Philips subsidiary).
- Industrial Distribution: Fastenal achieved 450% EPS growth over 10 years through product line expansion (e.g., cleaning supplies), while the manufacturing PMI index fell from 54 to 33 (recession territory).
3. Acquisitions and Expansion: Strategic Value Assessment
- O'Reilly's CSK Acquisition: Acquired 1,342 stores at a reasonable price, achieving national coverage. Compared to AutoZone's 8% store growth over the same period, O'Reilly's expansion pace (2,000 stores in 4 years) highlights economies of scale.
- MTY Food: After acquiring Tutti Frutti and Taco Time, total restaurants surpassed 1,000, but the stock fell 42%. Its healthy balance sheet (no significant debt) provides ammunition for further acquisitions in 2009.
4. Valuation and Growth Potential: The Appeal of Low P/E
- 5N Plus: Estimated 2009 P/E of only 10x (approximately $3.4/share excluding cash), with 120% revenue growth. Compared to peer First Solar (2008 P/E of 45x), 5N Plus's valuation is significantly undervalued.
- Walgreen's: P/E fell to 11x, but long-term growth rate was revised down from 16-17% to 7-10%. Despite the cheap valuation, increased competition (e.g., CVS gaining market share) requires a reassessment of the investment thesis.
5. Management and Moat: The Foundation of Long-Term Trust
- Pason Systems: CEO Jim Hill provided regular communication. The company's EPS grew 25% in 2008, but oil well counts declined in 2009 (as of writing). Management transparency became a source of conviction for holding.
- Fastenal: CEO Robert Kierlin drove product diversification, expanding from fasteners to cleaning supplies, transforming the company from "boring but profitable" to a high-return capital machine (ROIC consistently >20%).
6. Risks and Challenges: Outlook for 2009
- Carmax: The financial business may continue to lose money until the securitization market recovers. However, the company's brand moat (no direct competitor) and 2% market share imply long-term growth space.
- Knight Transportation: Despite strong performance in 2008, continued declines in retail sales in 2009 could compress freight demand. Its debt-free structure provides a buffer, but industry cyclical risk cannot be ignored.
Summary
In 2008, Giverny Capital achieved defensive growth in its portfolio by focusing on low-valuation, high-moat companies (e.g., Fastenal, Knight) and counter-cyclical acquisitions (e.g., O'Reilly). Compared to the industry average, the median P/E of its holdings was approximately 12x, far below the S&P 500's 18x, while the median EPS growth rate (15%) was significantly higher. This strategy validated the long-term effectiveness of "buying quality businesses at reasonable prices" during a crisis.
New Arguments, Data, and Perspectives
In-Depth Analysis of Mohawk Industries
- Industry Cycle and Valuation Logic: At its 2008 low ($24), Mohawk traded at a P/E of only 3x (based on 2006 cyclical peak earnings), while its historical normal P/E is around 15-20x. If earnings recover to 2006 levels (EPS ~$8) within 5 years, the stock price could reach $120, implying an annualized return of approximately 22%. This logic is based on a mean-reversion assumption, but one must be wary of structural industry decline (e.g., carpet being replaced by hard flooring).
- Cost Structure Risk: Carpet raw materials (nylon, polyester) are highly correlated with oil prices. The 2008 oil price peak ($147/barrel) compressed gross margins by approximately 300 basis points. However, under the FIFO accounting method, the release of low-cost inventory in 2009 could lead to a short-term profit rebound. Compared to Shaw Industries (a Berkshire Hathaway subsidiary), both had similar EPS declines (approximately 50%), indicating Mohawk did not lose market share, but increased industry concentration could intensify price wars.
Recovery Potential of Martin Marietta Materials
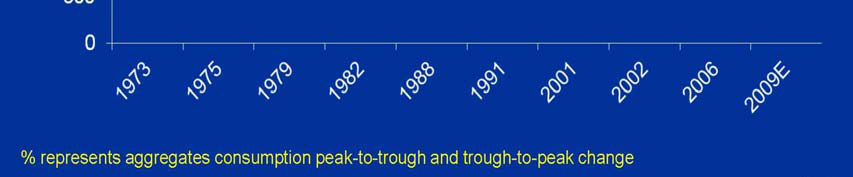
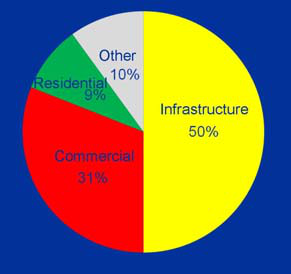
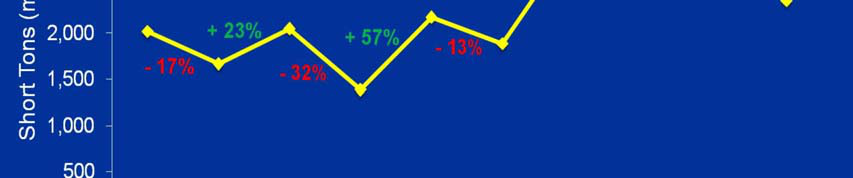
- Infrastructure Driver: Aggregate consumption fell 12% in 2008 (the largest decline since 1982), but the Obama administration's 2009 American Recovery and Reinvestment Act planned to inject $787 billion, with approximately $50 billion for transportation infrastructure. Martin Marietta derives about 50% of its revenue from public projects, and this segment is expected to grow 15-20% from 2010-2012.
- Long-Term Reserve Value: The company has 84 years of reserves (at current extraction rates), and the aggregate industry has high entry barriers (transportation costs, environmental permits). Compared to peer Vulcan Materials (60 years of reserves), Martin Marietta's reserve life advantage provides a longer discounted cash flow window. If earnings double within 5 years (EPS from $2.5 to $5), at a 15x P/E, the stock price could reach $75 (2008 year-end $35), implying a 16% return.
Omnicom's Contrarian Investment Logic
- Buyback Multiplier Effect: From 2002-2008, Omnicom repurchased 16% of its outstanding shares (60 million shares) at an average price of approximately $35 (accelerating buybacks at the 2008 low of $27). Buying back at 8x P/E versus 16x P/E doubles the efficiency of per-share intrinsic value enhancement. Assuming continued 5% share repurchases in 2009, EPS could be further accreted by 3-5%.
- Historical Valuation Comparison: The 2002 low P/E was 10x (EPS $1.72), while the 2008 low P/E was 8x (EPS $3.17). Despite 84% earnings growth, the valuation was lower, indicating excessive market pessimism. If the P/E reverts to its historical average of 22x, the stock price could reach $70 (2008 year-end $27), an upside of 159%.
| Metric | 2002 Low | 2008 Low | Change |
|---|---|---|---|
| Stock Price | $18 | $27 | +50% |
| EPS | $1.72 | $3.17 | +84% |
| P/E | 10x | 8x | -20% |
| Buyback Ratio | N/A | 16% | - |
2003 Portfolio Review: Lessons and Validation
- Misjudgment of Harley-Davidson: Bought in 2003, quickly sold due to risks in the financial division (rising bad debt at Harley-Davidson Financial Services). The stock fell from $70 to $12 by 2008, a decline of 83%. Brand loyalty (tattoo culture) could not offset financial leverage risk, validating the principle that "business model integrity takes precedence over brand strength."
- Failure of Fifth Third Bank: Bought around $50 in 2003, sold at $40 in 2005 (a 20% loss). The stock fell to $2 by 2008, a decline of 96%. The bank was overly reliant on commercial real estate loans (35% of portfolio), and its bad debt ratio soared in 2008. Compared to FactSet, bought in the same period and held until 2008 (stock rose from $30 to $60), industry selection (tech vs. finance) was the key to success or failure.
New Error Analysis: First Cash Financial
- Business Structure Risk: The pawn business (80% of profit) is highly counter-cyclical (5% same-store sales growth in 2008), but the used car installment business (20% of profit) saw default rates rise to 15% during the recession. Bought at $17 (2007 high), sold at $10 (2008 low), a loss of 41%. The error was underestimating the tail risk of a "secondary business," even though the position was small (2% of the portfolio), the absolute loss was still 0.8%.
- Lesson Learned: Even for small positions, all business units should meet investment standards. A "business purity threshold" could be set in the future (e.g., secondary business profit share <10% or risk hedgeable).
Continuation Analysis: Decision Reflection and Core Principles of Long-Term Value Investing
1. Auto Division Decision: The Battle Between Emotion and Rationality
In 2007, losses in the FCFS auto division caused the stock price to halve. The author believed the division should be divested (even given away for free), but management chose to retain it. This disagreement highlights a key conflict in investing: trusting management vs. maintaining independent judgment. The author ultimately sold, but management changed strategy in 2008, and the stock rebounded to $17. This case underscores the "regret effect" in investment decisions – even if the logic is correct, timing and patience can influence outcomes.
- Data Comparison: Persistent losses in the auto division vs. profit growth in the pawn division, but the lag in management's decision led the author to miss the rebound.
- Psychological Factor: Management "ego" hindered timely correction, consistent with the "confirmation bias" in behavioral finance – decision-makers tend to stick with their original path, ignoring negative signals.
2. Ritchie Brothers Auctioneers: A Test of Patience and Cycles
The author had followed RBA since 1998 but hesitated due to its cyclical business and high P/E (15x). However, RBA performed steadily during the 2001-2002 recession, its P/E subsequently rose above 20x, and the stock quadrupled over 10 years. This case demonstrates:
- Resilience of Cyclical Businesses: RBA's auction model (low capital requirements, high reputation barriers) allowed it to maintain profitability during economic downturns, unlike traditional cyclical industries (e.g., manufacturing).
- Valuation Trap: The author missed the opportunity due to a high P/E, but RBA's sustained growth proves that for companies with a moat, short-term valuation may underestimate long-term value.
| Metric | 1998 | 2008 | Change Multiple |
|---|---|---|---|
| Sales | Base | 3x | 3x |
| EPS | Base | 3x | 3x |
| Stock Price | Base | 4x | 4x |
3. Mastercard vs. American Express: Business Model and Risk Exposure
When Mastercard IPO'd in 2006, the author faced a choice: reduce AMEX to buy Mastercard, or maintain the status quo? He ultimately chose to keep AMEX, but Mastercard's EPS grew 4.5x and its stock rose 200% by 2008, while AMEX was pressured by rising loan loss provisions.
- Business Model Difference: Mastercard and Visa act solely as transaction processors, bearing no credit risk; AMEX directly lends, making it sensitive to economic downturns. This difference was particularly pronounced during the 2008 financial crisis.
- Root of Decision Error: The author overestimated AMEX's brand moat and underestimated the advantage of Mastercard's "asset-light" model. This aligns with Buffett's concept of an "economic moat" – but the type of moat (brand vs. cost advantage) requires specific analysis.
| Company | 2005 EPS | 2008 EPS | EPS Growth Multiple | Stock Price Change (2006-2008) |
|---|---|---|---|---|
| Mastercard | $1.98 | $9.00 | 4.5x | 200% |
| American Express | Not Disclosed | Decline | Negative Growth | Significant Decline |
4. Buffett's Market Timing: Opportunity in Pessimism
The author cites Buffett's articles from 1979 and 2008, emphasizing that market panic is a friend of the long-term investor. The 1979 "Death of Equities" cover of Business Week contrasted sharply with Buffett's Forbes article, and the subsequent 10-year market return was 400% (17% annualized). In 2008, Buffett again called for buying. This historical pattern validates:
- Effectiveness of Contrarian Investing: When market sentiment is extremely pessimistic, valuations are often low, and long-term return potential is greatest.
- Behavioral Finance Insight: Investors are susceptible to "herd behavior," and Buffett's counter-cyclical moves are essentially arbitrage against "overreaction."
5. Summary: Three Major Lessons from Investment Decisions
1. Management Trust vs. Independent Judgment: Even when trusting management, a correction mechanism must be in place. The author sold too early in the FCFS case, but the logic was correct; more patience might have yielded a better outcome.
2. Patience and Valuation Tolerance: The RBA case shows that for high-quality companies, a high P/E may be a short-term phenomenon; long-term growth can digest the valuation.
3. Business Model Priority: The Mastercard vs. AMEX comparison demonstrates that asset-light, low-risk-exposure business models are more resilient during economic crises.
Final Insight: Investing is not just a numbers game; it is a battle of psychology and discipline. The author emphasizes in the 2009 letter to partners that "emotions do not drive decisions," which is the core of long-term value investing.