It’s Everywhere, In Everything: The First Truly Global Bubble
GMO is a Boston asset manager co-founded in 1977 by Jeremy Grantham with Richard Mayo and Eyk Van Otterloo, known for valuation-driven dynamic asset allocation built on long-horizon mean reversion. Grantham is famous for calling historic bubbles, warning publicly ahead of both the 2000 dot-com crash and the 2008 financial crisis. Flagship publications include the GMO Quarterly Letter (now written by Asset Allocation co-heads Ben Inker and John Pease), Grantham's Viewpoints essays and the 7-Year Asset Class Forecast.
In plain words
This report argues the world is in its first truly global bubble—everything from Indian antiques to Chinese art, Panamanian land to London real estate, timber to junk bonds and blue-chip stocks is overpriced. Why? The economy is near-perfect and borrowing is cheap and easy, so investors reinforce each other's optimism. The 'risk premium' (extra return for taking risk) has shrunk to near zero, even negative—meaning you're paying to take risk. For ordinary investors, cash may be safest. But big fund managers can't cut risk much without falling behind peers, which keeps the bubble going. Worth reading because it shows with data why this bubble is different from 2000 or Japan's—and why there's no safe haven.
GMO’s April 2007 quarterly letter points out that the world is experiencing its first truly comprehensive bubble, sparing no asset—from Indian antiques to Chinese contemporary art, Panamanian land to Mayfair, timber, infrastructure, junk bonds, and blue-chip stocks. The core argument is that two nec
Theme and Background
This chapter discusses how the world is experiencing its first truly comprehensive bubble, with an unprecedented scope—from Indian antiques to modern Chinese art, from Panamanian land to London’s Mayfair, from forestry to junk bonds and blue-chip stocks, none are spared. Based on observations from a six-week global trip, the author notes that global investors are mutually reinforcing optimism, forming a uniformity never seen in history.
Core Thesis
The author’s core investment argument is that the world is undergoing the first truly comprehensive bubble, where the conditions for its formation (excellent fundamentals + ample and cheap liquidity) are fully met, and all major asset classes (real estate, stocks, bonds) are at historically expensive levels. The counterintuitive judgment is that risk premiums have fallen to historic lows, even resulting in a negatively sloped risk-return line—investors are effectively "paying to take on risk."
Key Arguments and Data
1. Two Necessary Conditions for Bubble Formation:
- Fundamentals must be at least "good" (near-perfect is better)
- Liquidity must be ample and cheap (easy and inexpensive leverage)
- The author emphasizes: the simultaneous occurrence of these two conditions has never failed to trigger a bubble; only one condition typically leads to a normal bull market
2. Extreme Synchronization of Global Economic Growth:
- Among the 42 countries listed by The Economist, not a single country has a GDP growth rate below Switzerland’s 2.2%
- For the first time, all emerging market countries have GDP growth rates exceeding that of the US over a 12-month period (while the US itself is performing well)
- This is further evidence of the high correlation in fundamentals driven by globalization
3. Historic Compression of Risk Premiums:
- Using 7-year forecasts to construct low-, medium-, and high-risk portfolios
- The risk-return gap plummeted from 6.4 percentage points in September 2002 to 0.8 percentage points in May of last year
- After excluding alpha (using only asset class forecasts), the risk-return line turned negative for the first time in May last year—investors are paying to take on risk
| Time Point | 7-Year Expected Return Gap Between Low-Risk and High-Risk Portfolios | Notes |
|---|---|---|
| September 2002 | 6.4 percentage points | Normal risk premium |
| May last year | 0.8 percentage points | Risk premium nearly vanished |
| May last year (excluding alpha) | Negative (first time) | Investors paying to take on risk |
4. Typical Remarks from Global Investors Reinforcing Each Other:
- "Land isn’t being created anymore"
- "With such growth rates and low interest rates, stocks must keep rising"
- "Private equity will continue to drive the market"
Companies/Assets Involved
This chapter does not mention specific companies but covers the following asset classes:
- Real Estate: Global scope, including Panamanian land and London’s Mayfair
- Stocks: Blue-chip stocks, emerging market stocks
- Bonds: Junk bonds, TIPS (Treasury Inflation-Protected Securities)
- Alternative Assets: Forestry, infrastructure, Indian antiques, modern Chinese art
- Cash: The author implies that in a negative risk-return environment, cash is the most reasonable choice
Investment Implications
1. Extreme Caution: In an environment with negative risk premiums, investors should significantly reduce risk exposure and increase cash allocation. The author explicitly states, "If you believe these data, you should put all your money in cash."
2. Career Risk Constraints: Even if fully convinced of the bubble judgment, institutional investors can only hold a marginal amount of cash, as the career risk of deviating significantly from the benchmark is "unbearable"—this itself is a self-reinforcing mechanism of the bubble.
3. Watch for Reversal Signals: When all asset classes are simultaneously expensive, all regions are simultaneously optimistic, and all investors are mutually reinforcing, systemic risk is extremely high. When the bubble bursts, correlations will converge to 1, and diversification will fail.
4. Historical Comparison: Unlike the 2000 TMT bubble (limited to developed-market tech stocks) and the Japanese bubble (limited to Japan), the global and comprehensive nature of this bubble means there is no safe haven.
Theme and Background
This chapter focuses on the inevitability and systemic impact of the bursting of global asset bubbles. In April 2007, the author pointed out that the world was experiencing the first comprehensive cross-country, cross-asset bubble, the bursting of which would bring unprecedented systemic stress and potentially cause widespread damage to economic confidence and activity.
Core Thesis
The author's central judgment is that all bubbles eventually burst, and this bursting will be global and cross-asset. Counterintuitively, the author believes that high-grade bonds may be an exception (i.e., relatively safe when the bubble bursts), while risk premiums will expand significantly, a stark contrast to the prevailing market optimism at the time. Furthermore, because no similar globally synchronized bubble event has occurred in history, markets are unprepared for the systemic stress following the burst.
Key Arguments and Data
- Global and Comprehensive Nature of the Bubble: The report notes that the bubble covers all countries and all asset classes, including Indian antiques, Chinese modern art, Panamanian land, Mayfair real estate, forestry, infrastructure, junk bonds, and blue-chip stocks, across 42 countries listed by The Economist.
- Historical Lows in Risk Premiums: In September 2002, the seven-year expected return differential between high- and low-risk portfolios was 6.4%. By May 2007, this gap had narrowed to just 0.8%, indicating that the market's pricing of risk was extremely compressed.
- Economic Fundamentals and Liquidity: GDP growth in all 42 countries exceeded Switzerland's 2.2%. When the U.S. performed well, emerging market GDP growth surpassed that of the U.S. for the first time across the board. At the same time, liquidity was abundant and cheap, meeting the two necessary conditions for bubble formation.
- Chain Reactions After the Burst: The author emphasizes that the burst will lead to a sharp expansion in risk premiums, systemic stress exceeding expectations, and consequently a decline in confidence and economic activity. This judgment is based on a combination of historical patterns (all bubbles eventually burst) and the uniqueness of the current situation.
Companies/Assets Involved
This chapter does not mention specific companies but focuses on asset classes and macro judgments:
- High-Grade Bonds: The author considers these a possible exception, relatively safe when the bubble bursts.
- Risk Assets: Including stocks, real estate, junk bonds, and emerging market assets, all facing pressure from expanding risk premiums.
- Global Assets: From antiques and artworks to land and infrastructure, none are spared.
Investment Implications
- Short Risk Assets: Investors should reduce or short high-risk assets such as stocks, real estate, and junk bonds, as risk premiums are set to rebound sharply from historical lows.
- Allocate to High-Grade Bonds: High-grade bonds may serve as safe-haven assets, offering relatively stable returns when the bubble bursts.
- Beware of Systemic Risk: Due to the global synchronization of this bubble, market volatility and liquidity stress after the burst may exceed historical experience. Investors should prepare in advance for extreme scenarios.
- Monitor Confidence and Economic Activity: The bursting of the bubble will lead to a collapse in confidence and an economic slowdown. Investors should avoid bottom-fishing in the early stages and wait for risk premiums to fully expand before considering opportunities.
Theme and Background
This chapter focuses on the extreme looseness and cheapness of global credit conditions, and how these conditions, combined with nearly perfect fundamentals, form the necessary ingredients for a bubble. The author uses GMO’s 7-year asset expected return model to demonstrate that the relationship between expected returns and risk across different risk portfolios has significantly deteriorated over time. It also analyzes the trigger mechanism for a bubble burst—often not a single event, but rather when conditions slightly decline from "nearly perfect" to "slightly below perfect," prompting leveraged investors to retreat and triggering a positive feedback loop of declines.
Core Thesis
The author’s core judgment is that current global credit conditions are "generous and cheap," and combined with exceptionally strong fundamentals, have fostered a historically rare, all-encompassing bubble. The bubble’s burst will not be triggered by an obvious catalyst, but rather when conditions deteriorate marginally from "nearly perfect" (a second derivative change), the most aggressive leveraged investors act first, setting off a chain reaction. The author specifically notes that the core of this bubble is private equity, just as the core of the 2000 bubble was internet stocks. A decade from now, people may refer to this period as the "private equity bubble."
Key Arguments and Data
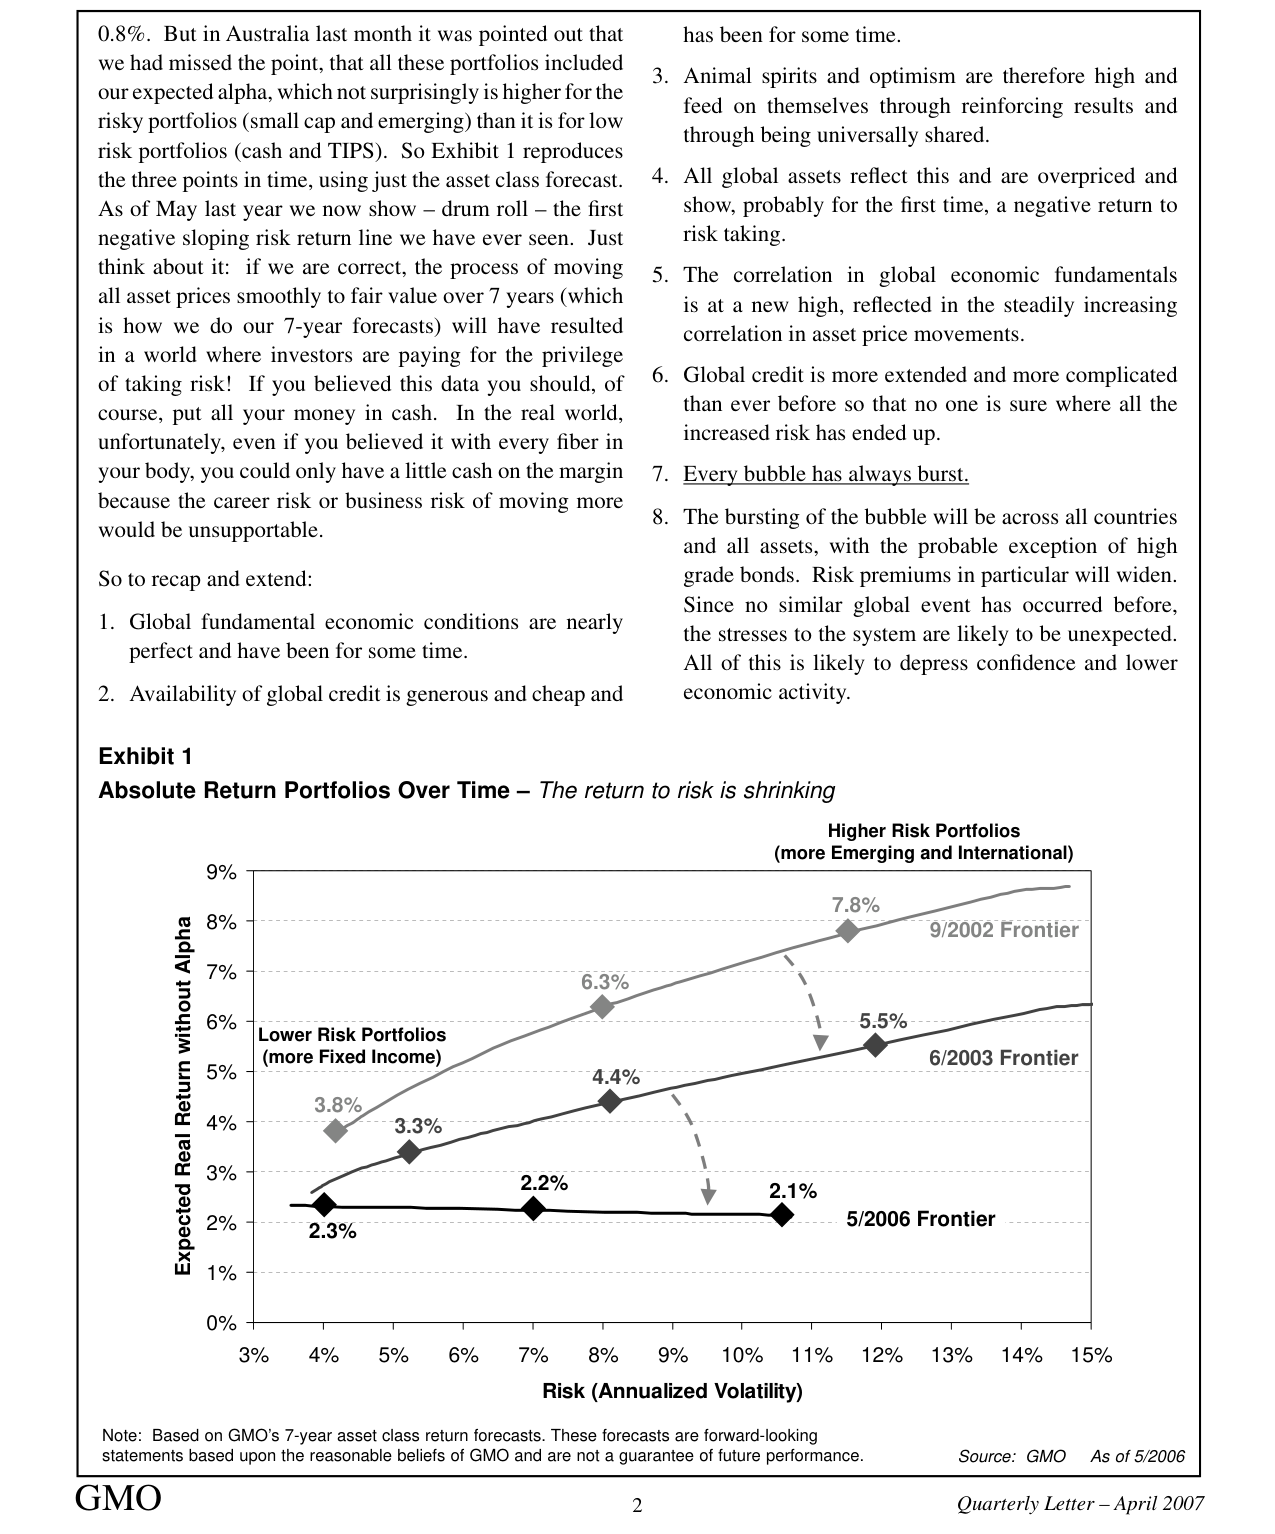
The risk-return frontier has shifted significantly downward from September 2002 to May 2006. Expected returns for low-risk portfolios fell from 3.8% to 2.1%, and for high-risk portfolios from 7.8% to 5.5%, with risk premiums narrowing substantially.
1. Persistent Deterioration in Risk-Return Ratio: GMO’s 7-year expected real return model shows that from September 2002 to May 2006, expected returns for both high-risk portfolios (more emerging market and international equities) and low-risk portfolios (more fixed income) declined sharply, while risk (annualized volatility) increased. Specific data are as follows:
| Time Point | Portfolio Type | Expected Real Return (Excluding Alpha) | Annualized Volatility |
|---|---|---|---|
| Sep 2002 | High Risk | 7.8% | ~13% |
| May 2006 | High Risk | ~3.8% | ~15% |
| Sep 2002 | Low Risk | ~5.5% | ~4% |
| May 2006 | Low Risk | ~2.1% | ~3% |
- Expected returns for the high-risk portfolio fell from 7.8% to approximately 3.8%, a decline of over 4 percentage points; for the low-risk portfolio, they fell from approximately 5.5% to approximately 2.1%, a decline of over 3 percentage points.
- Meanwhile, volatility for the high-risk portfolio rose from approximately 13% to approximately 15%, indicating higher risk alongside lower returns.
2. Trigger Mechanism for Bubble Burst: The author uses the metaphor of a "ball on a fountain" to illustrate—when the fountain (economic and financial conditions) is at full blast, the ball (asset prices) reaches its highest point; once the fountain is slightly turned down (conditions deteriorate marginally from "nearly perfect"), the ball falls. Historians will find it difficult to identify a clear trigger, as it lies in subtle second-derivative changes. When conditions decline to merely "above average," the most aggressive leveraged investors have already begun to retreat, creating a herd effect.
3. Historical Analogy: After the 2000 bubble burst, central banks like the Federal Reserve took measures to control economic damage, but the Nasdaq and internet stocks still fell by nearly 80% and 90%, respectively. The author implies that the core asset of this bubble (private equity) may face a similar magnitude of decline.
Companies/Assets Involved
- Private Equity: The author explicitly positions it as the core of this bubble, analogous to internet stocks in 2000. No specific companies are mentioned, but the implication is that the entire private equity industry may face a significant decline.
- Nasdaq/Internet Stocks: Used as a historical reference, with declines of 80%-90% after the 2000 bubble burst.
Investment Implications
- Avoid High-Leverage Assets: In the current loose credit environment, leverage-driven assets such as private equity carry extremely high risk. Even a slight tightening of liquidity conditions could trigger sharp declines.
- Beware of "Nearly Perfect" Conditions: Investors should not wait for a clear negative catalyst but should proactively reduce risk exposure when conditions marginally deteriorate from their peak.
- Focus on Risk-Return Ratio: The GMO model shows that expected returns for all risk portfolios are at historically low levels, while risk has not declined correspondingly, meaning the compensation for taking risk is extremely low. Investors should shift toward low-risk, high-liquidity assets or wait for valuations to return to reasonable levels.
Theme and Background
This chapter explores when the global bubble will burst, focusing on whether the current market's "this time is different" narrative is tenable. The author argues that while each bubble has unique circumstances, the competitive mechanisms of capitalism will ultimately pull everything back to normal.
Core Thesis
The author's core judgment is: The bubble will eventually burst; it is only a matter of time. He proposes two key catalysts—rising inflation and the reversion of profit margins to the mean. The counterintuitive point is that the author believes no clear catalyst is needed. Historically, the crashes of 1929, 1987, 2000, and even the South Sea Bubble lacked widely recognized triggers. The market is more like a balanced system where a small shock can expose vulnerabilities.
Key Arguments and Data
1. The Destructive Power of Inflation:
- Constrains the Fed's ability to support a weakening economy (the US economy is indeed weakening).
- Directly depresses the traditional bond market.
- Leads to lower stock P/E ratios (behavioral aspect).
- Compresses profit margins (companies must relearn how to pass on costs).
- Reduces leverage in real estate and commercial real estate, lowering prices.
- Most critically: Reduces the feasible leverage for private equity deals, making many current transactions impossible, thereby impacting the stock market.
2. Reversion of Profit Margins:
- Current global profit margins are significantly above historical averages.
- A slowing US economy and fewer global surprises will pressure margins.
- Continued decline in housing prices could slow credit growth and consumption.
- Margin data has lags and significant revisions, but "a few years of declining margins would be enough to prick the bubble."
3. Analogy of Market Balance:
- Compares the equilibrium market to a ping-pong ball on water—seemingly stable, but a small disturbance can break the balance.
- In late February 2007, minor problems in the subprime market, combined with a 9% single-day crash in Chinese stocks (an unrelated cause), triggered a chain reaction.
- In May 2006, during the best fundamental year for emerging markets, they fell 25% in 3 weeks—the author asks: what if it were bad news? A 50% drop in 3 weeks?
Companies/Assets Involved
| Asset/Market | Key Data/Role | Author's Judgment |
|---|---|---|
| Emerging Markets | Fell 25% in 3 weeks in May 2006 (best fundamental year) | Exposes risk: could fall 50% in 3 weeks with bad news |
| Subprime Market | "Minor troubles" in late February 2007 | Warning signal; check portfolio for vulnerabilities |
| Chinese Stocks | 9% single-day crash (unrelated cause) | "Red herring," but exposes fragility |
| Private Equity | Current deals rely on high leverage | Inflation will reduce feasible leverage, impacting stocks |
| US Economy | Weakening | One source of pressure on profit margins |
| Global Stock Market | No specific companies | Overall bubble state |
Investment Implications
1. Do not be fooled by the illusion that "it always bounces back"—the small shocks of May 2006 and February 2007 were just "warning shots"; the next one could be live ammunition.
2. Check your portfolio for "vulnerabilities": The author specifically notes that excessive pursuit of fixed-income alpha in asset allocation has led to accumulated currency exposure, which suffers during carry trade events. He advises investors to carefully examine all portfolios for unexpected reactions after each small shock.
3. Beware of inflation's destructive effect on leverage: Inflation impacts not only bonds and stocks but also indirectly hits the stock market by reducing private equity leverage—this is the market's most fragile link.
4. Reversion of profit margins is a slow but certain force: It is only a matter of time before global profit margins fall from historical highs, systematically lowering stock valuations.
Sequel Analysis: New Arguments, Data, and Perspectives
1. Changes in Forestry Investment Returns and Market Distortion
The sequel points out that real returns in forestry have fallen from "ridiculously high" levels to just 5%-6.5% (data from two countries). This change not only reflects the dilution of asset scarcity but also reveals the destructive effect of capital inflows on pricing mechanisms. Comparing historical data:
| Indicator | Historical Level (approx. pre-2000) | Current Level (2007) |
|---|---|---|
| Real Forestry Returns | Very High (exact figure not specified, but described as "ridiculously high") | 5%-6.5% (two countries) |
| Discount Rate | Low (due to asset scarcity) | Significantly Lower (due to influx of new investors) |
| Asset Diversification Value | High (rose during bear markets) | Diluted (due to excessive demand) |
Key Logical Flaw: Investors treat forestry's "historical diversification advantage" as a permanent attribute, ignoring that when massive capital floods in, asset prices are pushed up, and future expected returns inevitably fall. Harvard University's large-scale sale of forestry assets suggests insiders recognized this trend, while subsequent investors still chase a shrinking opportunity.
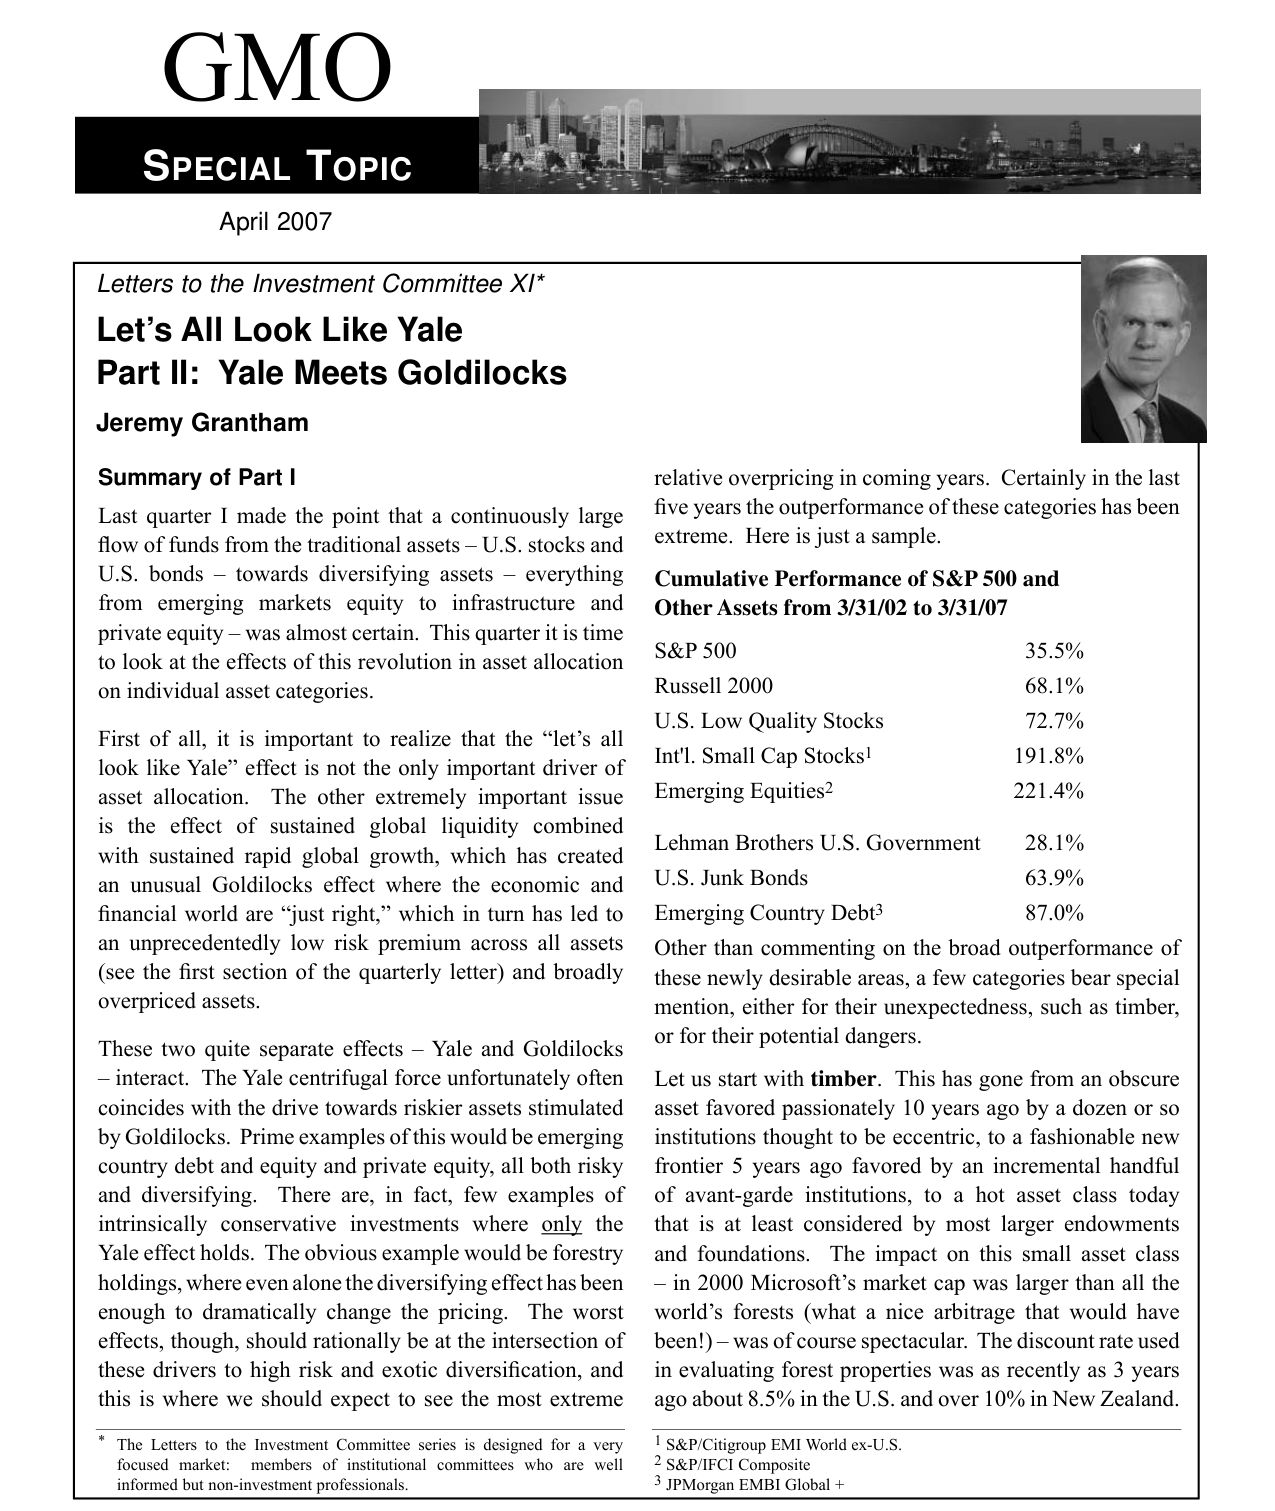
From March 2002 to March 2007, emerging market stocks had a cumulative return of 221.4%, and international small-cap stocks 191.8%, significantly outperforming the S&P 500's 35.5% and US Treasury bonds' 28.1%
2. Commodities: The Shift from "Downward Trend" to "Upward Trend"
The sequel argues that the long-term trend in commodity prices has shifted from an annual real decline of 1%-1.5% to an annual real increase of 1%-1.5%. The driver of this shift is incremental demand from emerging economies (especially China). However, the author warns that short-term price strength may have already "discounted 20 years of future change."
Data Comparison:
| Factor | Historical (100 years) | Current (2007) |
|---|---|---|
| Price Trend | Real price decline of 1%-1.5% per year | Real price increase of 1%-1.5% per year |
| Main Driver | Productivity gains > Rising marginal costs | Emerging economy demand > Technological improvements |
| Futures Curve Shape | Most contracts in contango | Potentially permanent change; some contracts shift to backwardation |
Logical Contradiction: The author acknowledges that "short-term prices have discounted long-term changes" but does not quantify the extent of this discount. If the market has fully priced in 20 years of future demand growth, investors buying at current prices face zero excess returns and could even suffer losses from short-term corrections. Furthermore, the author's personal short position in copper contradicts his overall bullish narrative on commodities.
3. Hedge Funds: The Fee Trap in a Zero-Sum Game
The sequel uses data to reveal the structural cost problem of the hedge fund industry:
| Cost Type | Traditional Long-Only (Institutional) | Traditional Long-Only (Retail) | Hedge Fund (Institutional) |
|---|---|---|---|
| Fixed Fee | 0.5% | 0.67% | 1.5% |
| Transaction Costs | 0.5% | 0.67% | 1.0% (often underestimated) |
| Performance Fee | 0% | 0% | 20% of profits (assuming 4% excess return = 1.8%) |
| Total Cost | 1.0% | 2.0% | 4.3% |
Core Argument: Hedge funds do not create new alpha; they merely allocate limited market inefficiency to more capital. For every additional dollar allocated to hedge funds, alpha is diluted further. The author sarcastically notes that institutions' rush into high-cost hedge funds will actually reduce the alpha returns of their existing long-only managers.
4. Infrastructure and Venture Capital: "Contrarian Indicators" of Capital Floods
The sequel notes that infrastructure has become the latest hot spot, partly because other assets are already "priced too high." Key Observation: Infrastructure's complex fee structure ("declared and submerged") makes it highly attractive to managers, but for investors, the capital influx has quickly compressed "generous risk-adjusted returns" to "meager levels."
For venture capital, the author emphasizes that "the number of new investors entering each year is the single biggest determinant of future returns." The current relatively low capital inflow is actually a "relatively good sign." This view aligns with the "contrarian investing" logic in behavioral finance: when market sentiment is extremely pessimistic, it is often a good time to enter; conversely, when capital floods in, returns are inevitably diluted.
5. Summary of Overall Logical Flaws
1. Historical Extrapolation Fallacy: Investors treat the "historical diversification advantage" or "price trend" of assets like forestry and commodities as permanent, ignoring that capital inflows change asset pricing and return distributions.
2. Excessive Discounting: Short-term commodity prices have already discounted 20 years of future demand growth, but investors still buy at current prices, implicitly assuming "future growth will exceed expectations."
3. Ignoring Zero-Sum Game: "Alternative investments" like hedge funds and private equity do not create new value; they only add fees and transaction friction, ultimately reducing the net return of the entire system.
4. Self-Contradiction: The author's personal short position in copper conflicts with his argument for a "long-term upward trend in commodities," suggesting a potential selective bias in his narrative.
5. Reflexivity of Capital Flows: The capital influx itself destroys the return opportunities it chases (e.g., falling discount rates in forestry, changing futures curve shapes), but investors often ignore this dynamic feedback.
New Arguments and Data Analysis
1. The "Stickiness" of Private Equity Returns and the Market Efficiency Paradox
- Return Persistence: Private equity (PE) returns exhibit significant "stickiness," meaning the gap between top and bottom funds is large and persistent. According to Kaplan & Schoar (2003), the top quartile of PE funds can achieve annualized returns of 20%-30%, while the bottom quartile generates virtually no positive returns. This non-mean-reverting characteristic contrasts sharply with the "style mean reversion" of traditional stock markets (e.g., S&P 500).
- Lack of Market Efficiency: Although the overall value-weighted average return of the PE industry is roughly in line with the S&P 500 (about 14%), top-tier funds achieve excess returns through leverage (4:1 or higher) and selective deal-making. However, this excess return stems not from alpha creation but from leverage amplification and "rent extraction" via fee structures (2% management fee + 20% performance fee). Data shows that if the S&P 500 were operated with 2:1 leverage, its annualized return would be 21%, far exceeding PE's 14%—but after deducting "2 and 20" fees, the net returns of both are nearly identical.
2. Leverage and Risk Asymmetry: A Quantitative Comparison
| Metric | Private Equity (Typical Deal) | Leveraged S&P 500 (2:1) |
|---|---|---|
| Annualized Return (Pre-tax) | 14% | 21% |
| Fees (2% Mgmt + 20% Performance) | ~4.8% | None |
| Net Return (Pre-tax) | 9.2% | 21% |
| Leverage Ratio | 4:1 | 2:1 |
| Maximum Drawdown Risk | Implicit (no margin calls) | Explicit (margin calls) |
| Default Probability (7-year cycle) | High (if GMO prediction is correct) | Low (but requires active management) |
- Key Finding: PE's "no margin call" advantage comes at the cost of illiquidity. If GMO's 7-year prediction (US stocks real return -1.4%/year) materializes, a 4:1 leveraged PE deal would wipe out all equity value within 6 years (assuming a 20% equity stake), while a leveraged S&P 500 position could avoid catastrophic losses through active deleveraging.
3. Fund Flows and Asset Pricing Distortions
- Institutional Capital Reallocation: According to a Greenwich Associates 2007 report, 24% of institutions planned to reduce US active equity allocations, while only 4% planned to increase them. Conversely, 34% planned to increase PE allocations, with only 2% planning to decrease. This one-way flow leads to:
- Inflated PE Asset Prices: A flood of capital chasing a limited number of quality projects pushes up acquisition prices, compressing future returns.
- Undervalued Traditional Assets: US blue-chip stocks and bonds become relatively cheap due to capital outflows, creating a "value opportunity."
- Long-Term Reversion: Ben Graham's "voting machine vs. weighing machine" theory applies here. Short-term fund flows (voting machine) dominate pricing, but long-term asset prices must revert to replacement cost (weighing machine). The current "trend premium" in PE will be corrected by mean reversion over 7-10 years.
4. Fee Structures and Misaligned Incentives
- Asymmetric Return Distribution: The PE manager's compensation structure leads to a "winner takes all, loser pays" scenario:
- First successful deal: Manager earns a large performance fee; client profits.
- Second successful deal: Manager earns an even larger fee (based on a larger fund); client profits.
- Third failed deal: Manager still collects the 2% management fee; client loses money.
- Net Effect: The manager accumulates "two large performance fees + 2% management fee" over three deals, while the client may only achieve a meager positive return or even a loss. The so-called "alignment of interest" is a pseudo-proposition.
5. Academic Perspective: Does PE Create Value?
- Evidence of Value Destruction: Several scholars (e.g., Kaplan & Schoar, 2003) point out that LBOs (leveraged buyouts) have, at the micro (firm) level, a "negligible" or even slightly negative impact on real value creation. The core issues are:
- Short-Term Profit Manipulation: "Beautifying" financial statements by cutting R&D, advertising, and depreciation expenses, masking long-term value erosion.
- Debt Tax Shield Illusion: Tax benefits from leverage are offset by high fees and default risk.
- Macro Zero-Sum Game: PE is essentially a "repackaging" of existing asset classes, creating no new value. Its high fees ultimately translate into lower returns for investors, consistent with the "zero-sum game" law.
Conclusion and Investment Implications
- The Trap of Trendy Assets: Current capital is flooding into "fashionable assets" like PE and emerging markets, but history shows that excessive trend-chasing often leads to pricing errors. Investors should be wary of the "liquidity illusion"—PE's "no margin call" advantage can turn into "implicit destruction" during a bear market.
- The True Value of Diversification: True diversification should be based on the economic essence of asset classes (e.g., stocks, bonds, real assets), not their "packaging form" (e.g., PE, hedge funds). The latter are merely high-fee, high-leverage variants of the former.
- Long-Term Perspective: GMO's prediction (US stocks real return -1.4%/year) is not a certainty, but it reminds investors: in a leverage-driven market, time is on the side of the "weighing machine." The current "sticky returns" of PE may just be a "last gasp" before mean reversion.