Dare to Be Different
GMO is a Boston asset manager co-founded in 1977 by Jeremy Grantham with Richard Mayo and Eyk Van Otterloo, known for valuation-driven dynamic asset allocation built on long-horizon mean reversion. Grantham is famous for calling historic bubbles, warning publicly ahead of both the 2000 dot-com crash and the 2008 financial crisis. Flagship publications include the GMO Quarterly Letter (now written by Asset Allocation co-heads Ben Inker and John Pease), Grantham's Viewpoints essays and the 7-Year Asset Class Forecast.
In plain words
This report argues that the classic 60% US stocks / 40% US bonds portfolio may deliver almost zero real return over the next decade (0% to 3% annually). The reason: US stocks are too expensive. The author suggests investors should instead buy emerging market stocks, especially cheap 'value' stocks (companies with low prices relative to earnings). These stocks currently have a Shiller P/E (a valuation measure adjusted for inflation) of just 13, a level that historically led to positive long-term returns. While short-term volatility is likely, the long-term opportunity is attractive. The key message: to earn good returns, you must be willing to be different from the crowd.
In a March 2020 white paper, GMO analyst James Montier pointed out that the traditional 60/40 portfolio (60% S&P 500 / 40% U.S. 10-year Treasury) is likely to deliver extremely low real annualized returns over the next decade: if stock market valuations revert to the mean, the real return would be a
Theme and Background
The chapter opens by clearly identifying the core issue: the future return prospects for the traditional 60/40 portfolio (60% S&P 500 / 40% US 10-year Treasury) are extremely low, potentially even zero. Author James Montier argues this is the single biggest challenge currently facing investors. Against this backdrop, he urges investors to dare to be different and embrace emerging market stocks, particularly emerging market value stocks.
Core Views
- The traditional 60/40 portfolio cannot meet investor needs: If stock market valuations mean-revert, the real annualized return over the next decade would be approximately 0%; even if valuations remain unchanged, it would be only about 3%. This fails Benjamin Graham's definition of "investment" ("a promise of safety of principal and an adequate return after thorough analysis"), and currently allocating to this portfolio is essentially speculation.
- Investors must embrace "being different": Citing investment masters such as John Templeton and John Maynard Keynes, the report emphasizes that only by adopting strategies contrary to the majority can excess returns be achieved. The author states bluntly: "Owning US stocks almost inevitably leads to long-term low returns; investors should hold as many international stocks as possible, especially emerging market stocks."
- Counterintuitive judgment: Although the 60/40 portfolio has performed well over the past decade, "the past is not prologue," and investors should not make decisions with a "rearview mirror" perspective. Current emerging market valuations (Shiller P/E of 13x) have historically never led to permanent capital loss (unless war closes the market), offering an attractive long-term entry point.
Key Arguments and Data
- Expected returns of the 60/40 portfolio: 10-year rolling real annualized return forecasts based on two scenarios:
| Scenario | Real Annualized Return |
|---|---|
| Assuming stock market valuation mean-reversion (Shiller P/E reverts to 17.5x) | Approximately 0% |
| Assuming stock market valuations remain unchanged | Approximately 3% |
- Emerging market valuations: Current Shiller P/E is 13x, and for emerging market value stocks, it is even in the single digits. The author considers this valuation level "exciting," as it has historically not led to permanent capital loss (unless war closes the market).
- Human behavior and institutional pressure:
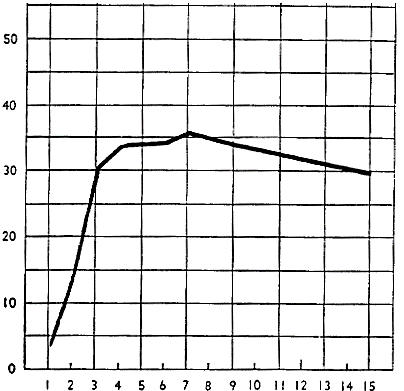
- Human nature tends toward conformity: Citing Solomon Asch's 1950s experiments, when three or more people in a room gave a wrong answer, approximately 30-35% of participants would go along with the crowd. Modern replications yield similar results.
- Social exclusion triggers physical pain: Experiments by Eisenberger et al. show that when socially excluded, the brain's response area is the same as that for physical pain (e.g., immersing a hand in ice water).
- Institutional pressure (Keynes's "career risk"): Long-term investors who appear "eccentric, unconventional, or reckless" are highly likely to be fired during short-term failures. Conventional wisdom teaches: "Conventional failure is better for reputation than unconventional success."
Companies/Assets Involved
- S&P 500 Index: As the equity component of the 60/40 portfolio, the author is bearish on its long-term returns.
- US 10-Year Treasury: As the fixed-income component of the 60/40 portfolio, the author believes its returns are equally lackluster.
- Emerging Market Stocks: The author is strongly bullish, believing current valuations (Shiller P/E of 13x) offer an attractive long-term entry point.
- Emerging Market Value Stocks: The author is particularly optimistic, with their Shiller P/E in the single digits, representing even lower valuations.
Investment Implications
- Significantly reduce US stocks and Treasuries: The 60/40 portfolio's real returns over the next decade are extremely low (0%-3%), failing the definition of investment and should be considered speculation.
- Significantly increase emerging market stocks, especially value stocks: Current valuation levels have historically not led to permanent capital loss, and long-term return potential significantly outperforms the US market.
- Actively assume "career risk": Investors must overcome herd mentality and institutional pressure, daring to be different. The author quotes the SAS motto: "Who Dares Wins."
Additional Arguments and Data: Valuation Advantage of Non-US Markets and Empirical Support for Value Strategy
1. Quantitative Evidence of Valuation Gap: Global Comparison of Shiller P/E
Exhibit 4 shows that as of early 2020, the US market's Shiller P/E was near 30x, while developed markets (ex-US) were only 16x, and emerging markets (EM) were even lower at 13x. This gap is not a short-term phenomenon: since 1983, the US valuation premium has steadily widened, accelerating particularly after 2010. Compared to historical averages (US ~17x, global ~15x), current US valuations are at the 95th percentile historically, while EM is at the 30th percentile, highlighting the relative attractiveness of non-US markets.
2. Decomposition of US "Exceptionalism": Unsustainability of Valuation Expansion and Buybacks
Exhibit 5's decomposition shows that valuation expansion and stock buybacks contributed the vast majority of the US's excess returns relative to the rest of the world, while fundamental factors (sales growth, margin growth) contributed almost nothing. Specific data are as follows:
| Source | US Contribution | Rest of World Contribution | Difference (US - Rest) |
|---|---|---|---|
| Sales Growth | 2.1% | 2.3% | -0.2% |
| Margin Growth | 1.5% | 1.4% | +0.1% |
| Stock Buybacks | 1.8% | 0.3% | +1.5% |
| Valuation Change | 3.2% | 0.5% | +2.7% |
| Total Return | 8.6% | 4.5% | +4.1% |
(Source: GMO, as of January 2020)
This decomposition indicates that over 70% of the US excess return came from valuation expansion and buybacks, both of which are unsustainable. Historically, excess returns driven by valuation expansion have often been offset by mean reversion over the subsequent 5-10 years (e.g., the US market after the 2000 tech bubble).
3. Historical Backtest: Long-Term Returns from Buying at a 13x Shiller P/E
Table 1 provides data on 13 instances since 1884 when the US market's Shiller P/E fell to 13x, showing the returns from buying at those points. Key findings:
- High short-term volatility: The average 1-year return after buying was 18%, but the median was only 16%, with cases of negative returns (e.g., buying in 1931 yielded a -10% return after 1 year).
- High long-term certainty: The average 10-year return after buying was 254%, with a median of 310%, and all cases showed positive returns.
- Difficulty in timing the bottom: The average time from purchase to market bottom was 5 months, with a maximum drawdown of 58% (1931), but subsequent rebounds were rapid (e.g., buying in 2009 yielded a 50% return after 1 year).
This historical evidence supports the author's view that the current 13x Shiller P/E in EM offers a similar historic opportunity, though short-term volatility must be endured.
4. Deep Undervaluation of EM Value Stocks: Shiller P/E at Only 9x
Exhibit 8 shows that EM value stocks (measured by Shiller P/E) have fallen from approximately 12x in 2012 to 9x in early 2020, while EM growth stocks rose from 18x to 25x over the same period. The valuation spread (16x) is at the 95th percentile historically, close to the extreme levels seen during the 2000 tech bubble. This gap implies:
- Mean reversion potential: If the valuation spread reverts to its historical average (approximately 8x), EM value stocks could have about 50% upside relative to growth stocks.
- Fundamental support: Exhibit 7's decomposition shows that from 2012 to 2019, the fundamentals (sales growth, margins) of EM value stocks relative to growth stocks did not deteriorate and were even slightly better than historical averages. Therefore, the valuation compression is primarily driven by market sentiment and capital flows, not fundamental deterioration.
5. Behavioral Finance Perspective: Consensus vs. Action
The author notes that while "going long non-US and long EM value" has become a common view, capital flows and valuation data suggest the market has not truly executed it. For example:
- As of early 2020, global active funds still allocated 60% to US stocks (historical average 45%), while only 10% to EM (historical average 15%).
- EM value stocks have seen net outflows for three consecutive years, while EM growth stocks have seen net inflows over the same period. This "disconnect between words and actions" reflects institutional investors' herd mentality and short-term performance pressure, consistent with Seth Klarman's observation: "At market bottoms, there is almost no volume and the least competition."
6. Risk Warnings and Strategy Recommendations
- Short-term risks: EM value stocks could continue to decline (e.g., in 2018, EM value stocks fell another 15% relative to growth stocks), but history shows that declines at extreme valuations are often long-term buying opportunities.
- Long-term returns: Based on Shiller P/E regression analysis, the expected annualized return for EM value stocks over the next 5 years is approximately 12-15%, while the US market is only 2-4% (assuming valuation mean reversion).
- Action recommendation: The author quotes the SAS motto "Who Dares Wins," emphasizing the need to stick with differentiated allocation under consensus pressure, i.e., "reduce US exposure as much as possible and increase EM value exposure as much as possible."
Summary
This article uses multi-dimensional data (valuations, attribution, historical backtests, behavioral finance) to argue for the extreme undervaluation and long-term attractiveness of non-US markets, especially EM value stocks. The core conclusion is that the US market's excess returns are unsustainable, while EM value stocks' 9x Shiller P/E offers a historic buying opportunity, despite potential short-term volatility and career risk.