Reasons (NOT) To Be Cheerful
GMO is a Boston asset manager co-founded in 1977 by Jeremy Grantham with Richard Mayo and Eyk Van Otterloo, known for valuation-driven dynamic asset allocation built on long-horizon mean reversion. Grantham is famous for calling historic bubbles, warning publicly ahead of both the 2000 dot-com crash and the 2008 financial crisis. Flagship publications include the GMO Quarterly Letter (now written by Asset Allocation co-heads Ben Inker and John Pease), Grantham's Viewpoints essays and the 7-Year Asset Class Forecast.
In plain words
This report warns that the US stock market has surged about 47% since late March 2020, even though the economy is in terrible shape—unemployment jumped from 6 million to over 30 million. The author argues that investors are overly optimistic, pricing in a 'V-shaped recovery' as if it's certain, while ignoring huge risks. He shows that stocks are extremely expensive (Shiller P/E at the 95th percentile since 1881) while the economy is very weak (GDP growth at the 4th percentile). He also debunks the idea that the Federal Reserve's bond-buying (quantitative easing) is driving stocks higher—pointing out that past QE didn't consistently boost markets. For regular investors, this means chasing US stocks now is risky; it's better to wait for cheaper prices with a margin of safety.
GMO research report Reasons (Not) to Be Cheerful, authored by James Montier in August 2020, examines the U.S. stock market's extremely high valuations amid significant uncertainty. The core argument is that the market, driven by erroneous narratives such as liquidity creation by the Federal Reserve,
Theme and Background
This section discusses that after the U.S. stock market rebounded approximately 47% from late March 2020, valuations have reached historically extreme highs, while fundamentals face unprecedented uncertainty. Author James Montier questions whether the market's pricing of a "V-shaped recovery" based on narratives such as Federal Reserve liquidity creation is reasonable, arguing that current pricing lacks a margin of safety and represents an "absurd certainty."
Core Thesis
The author's core investment argument is: The U.S. stock market is currently priced at extremely high valuations while ignoring enormous uncertainty; investors should be wary of risk rather than optimistic. The market, like a drinker of Dr. Pangloss's "Kool-Aid," believes everything will turn out for the best, but this is dangerous overconfidence. The author explicitly states he does not know the answers to questions about the shape of the recovery, the restoration of employment, or a second wave of the pandemic, but precisely because these unknowns exist, investors should demand a margin of safety—something the current market completely disregards.
Contrarian/Against Consensus Views:
- The prevailing market view is that Federal Reserve liquidity creation (QE) drives stock market gains, but the author points out that QE primarily involves maturity transformation, with a weak direct link to equities. Moreover, during the first three QE programs, bond yields actually rose, and other markets did not exhibit extreme valuations despite low interest rates.
- The market prices a "V-shaped recovery" as a certainty, but the author argues a V-shape may be the least likely outcome, as economic reopening is not as simple as "flipping a switch."
Key Arguments and Data
1. Rare Speed and Magnitude of Market Rebound: Since late March 2020, the U.S. stock market has risen approximately 47%, other global markets nearly 38%, and emerging markets 36%. Historically, the only comparable case of a rapid decline followed by a rapid rebound is the 2008 Global Financial Crisis (GFC); the early stages of the 1929 Great Depression and the 1987 crash did not follow the same pattern. The author emphasizes that markets have no "divine right" to rebound after a crash.
2. Severe Divergence Between Valuation and Fundamentals:
- The current Shiller P/E (Cyclically Adjusted Price-to-Earnings ratio) is at the 95th percentile since 1881 (one of the most expensive levels in history).
- Meanwhile, real GDP growth (assuming -6% for the full year 2020) is at the 4th percentile (one of the worst levels in history).
- Historical comparison: In 1929, the market P/E was 37% above its long-term average, with earnings 46% above normal. In 2000, the P/E was 98% above average, with earnings 37% above normal (peak multiples corresponding to peak earnings). In 1932, the market valuation was only 64% of the average, with earnings only 54% of the average (trough multiples corresponding to trough earnings). The current situation is peak multiples corresponding to trough earnings, which is unprecedented.
3. Grim Employment and Consumption Outlook:
- U.S. unemployment surged from 6 million in February to over 30 million currently.
- A University of Chicago study estimates that up to 40% of COVID-related layoffs could be permanent. If this projection is accurate, household consumption capacity will decline significantly.
4. Historical Comparison Table:
| Event | Rebound Characteristics After Market Decline | Valuation vs. Earnings Relationship |
|---|---|---|
| 1929 Great Depression | No similar rapid rebound | P/E 37% above average, earnings 46% above normal |
| 1987 Crash | No similar rapid rebound | — |
| 2008 Global Financial Crisis | Similar rapid rebound occurred (but after a 40% decline) | P/E 98% above average, earnings 37% above normal |
| 2020 COVID-19 Pandemic | Rapid rebound of 47% | Shiller P/E at 95th percentile, GDP at 4th percentile |
Companies/Assets Involved
- U.S. Stock Market (S&P 500): Core subject of analysis; the author is bearish, arguing its valuation is extremely high and lacks a margin of safety.
- Other Global Markets: Rose nearly 38%, but the author notes these markets did not exhibit extreme valuations like the U.S.
- Emerging Markets: Rose 36%; the author has been bullish long-term but offers no clear bullish or bearish judgment currently.
Investment Implications
- Beware of the Valuation Bubble in U.S. Stocks: The current Shiller P/E is at the 95th historical percentile, while economic growth is at the 4th percentile. This combination of "peak multiples corresponding to trough earnings" is extremely dangerous. Investors should avoid chasing highs, especially assets bought based on narratives of Fed liquidity or a V-shaped recovery.
- Demand a Margin of Safety: In an environment of high uncertainty (unemployment, consumption, corporate bankruptcies, etc.), investors should adhere to value investing principles and only buy assets with a sufficient margin of safety. Current U.S. stock pricing offers no buffer.
- Focus on the Complexity of the Recovery Shape: A V-shaped recovery may be overly optimistic; a W-shape, L-shape, or "Nike swoosh" is more likely. Permanent job losses and corporate bankruptcies will dampen the economic rebound, and investors should lower expectations for a short-term recovery.
Additional Arguments and Data: Empirical Challenges to the QE-Stock Market Link
This section further deconstructs the popular narrative that "Fed balance sheet expansion drives the stock market," providing historical data and logical rebuttals. The core argument is that QE is essentially maturity transformation, not direct liquidity injection into stocks; historical evidence also shows QE did not persistently lower long-term interest rates, thereby weakening its logic as a support for stock valuations.
1. Deconstructing the QE Mechanism: Maturity Transformation, Not "Printing Money to Buy Stocks"
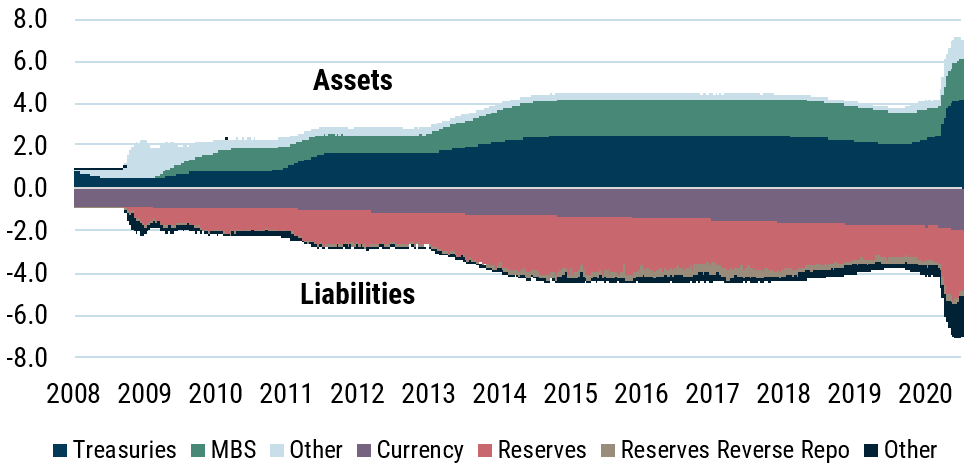
Using Exhibit 6 (a diagram of the Fed's balance sheet structure), the author emphasizes that the asset side (purchasing long-term Treasuries, MBS) and liability side (creating excess reserves) of QE must balance. This operation does not directly increase the total amount of private sector funds available for stock investment; instead, it changes the maturity structure of the banking system's assets. Specifically:
- QE1 (2009-2010): Assets rose from ~$2.3 trillion to ~$2.9 trillion, centered on purchasing $1.25 trillion in MBS.
- QE2 (2010-2011): Assets rose to ~$2.9 trillion, purchasing $600 billion in long-term Treasuries.
- Operation Twist (2011-2012): Did not expand the balance sheet; used proceeds from maturing short-term Treasuries to buy long-term assets.
- QE3 (2012-2014): Assets rose to ~$4.5 trillion, purchasing $40 billion MBS + $45 billion long-term Treasuries monthly.
- Tapering (2017-2019): Assets fell from ~$4.5 trillion to ~$3.7 trillion, with the monthly reduction gradually increasing to $50 billion.
- QE4 (2020-): Assets exceeded $7 trillion, shifting to unlimited purchases after March, with at least $80 billion in Treasuries + $40 billion in MBS purchased monthly starting June.
Key Data Comparison: During the 2016-2020 tapering period (balance sheet declining from $4.5 trillion to $3.7 trillion), the S&P 500 rose from approximately 2000 points to 3300 points, a gain of over 60%. This directly refutes the simplistic linear relationship that "balance sheet expansion drives the stock market."
2. Three Major Flaws in the Interest Rate Transmission Mechanism
The author cites research from AQR Capital (May 2020) to systematically question the "low rates → high valuations" chain:
| Logical Link | Rebuttal Basis | Data/Case Support |
|---|---|---|
| Direct link between rates and valuations | Rates are only part of the discount rate; risk premiums and expected cash flow changes are more significant | Japan's 10-year government bond yield has been below 0.5% for a long time, but the Nikkei 225 P/E is only 15x (2020); many European countries have negative rates, but the Stoxx 600 P/E is ~18x, far below the U.S. 25x |
| Low rates reflect low growth | If rate declines stem from worsening growth expectations, the numerator (cash flows) and denominator (discount rate) in the DDM model fall simultaneously, leaving valuations unchanged | The U.S. 10-year real yield fell from 0.5% in 2019 to -0.5% in 2020, but GDP growth expectations dropped from 2% to -5% over the same period, with corporate earnings estimates cut by over 30% |
| Can QE persistently lower rates? | Historical data shows rates were higher at the end of QE than at the start | See Exhibit 7: At the start of QE1 (Jan 2009), the 10-year yield was ~2.5%; at its end (Aug 2010), it rose to 3.0%. At the end of QE2 (Jun 2011), the yield was ~3.2%, higher than the 2.8% at its start. At the end of QE3 (Oct 2014), the yield was ~2.3%, higher than the 1.7% at its start. |
3. The Market's "Illusion of Certainty" in Pricing and Historical Lessons
Citing Howard Marks' "I know" vs. "I don't know" investor classification, the author argues that the current U.S. stock market (June 2020) has already priced in all possible good news ("priced in all the good news") while ignoring the following uncertainties:
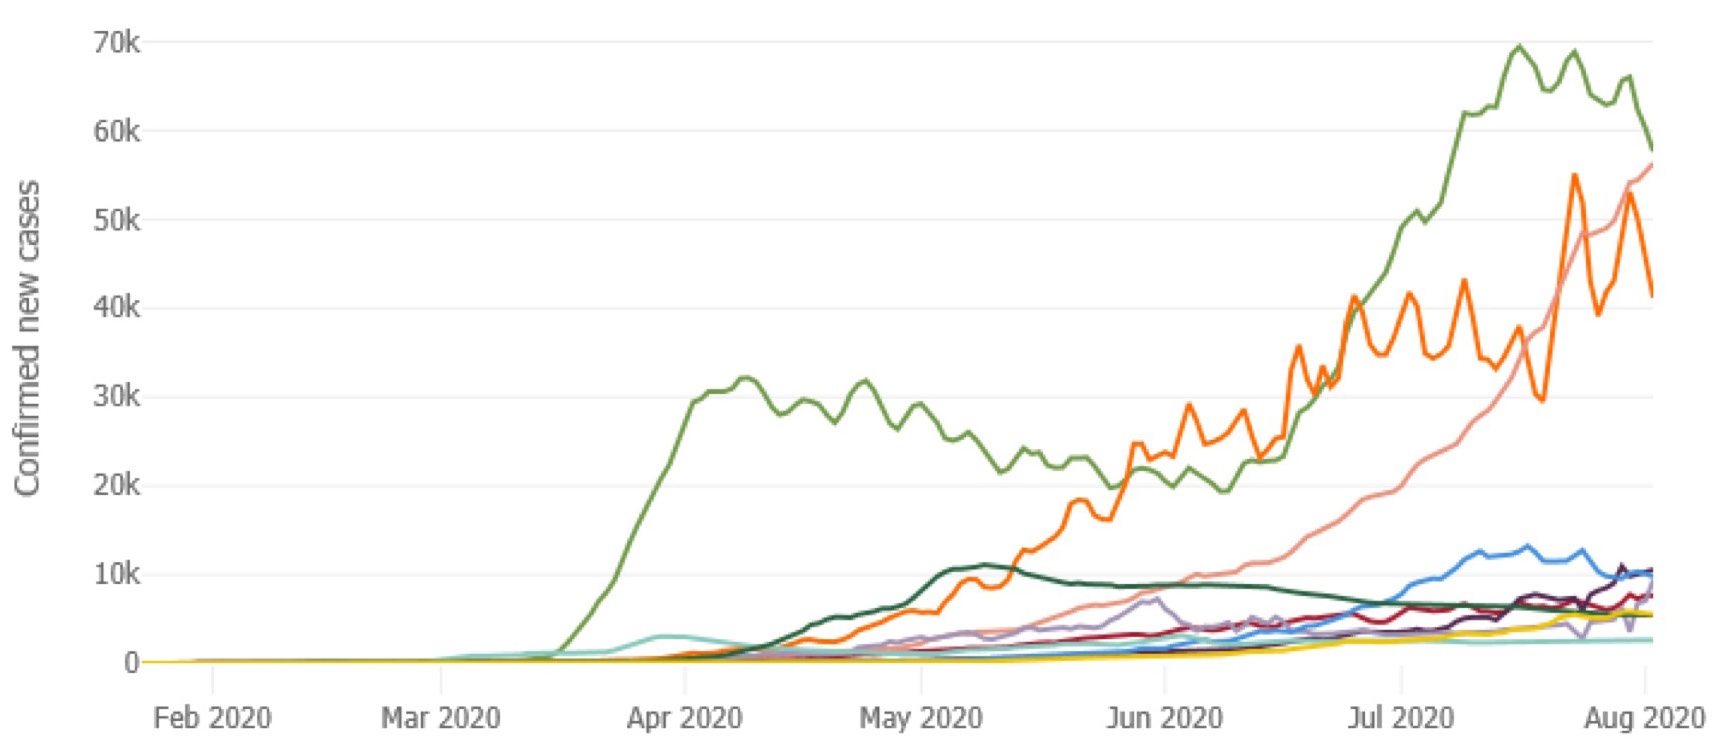
- Risk of a Second Wave of the Pandemic: Exhibit 4 shows that the U.S. 5-day rolling average of new cases still exceeded 20,000 in June, with no clear downward trend.
- Divergence Between Fundamentals and Valuations: The S&P 500 trailing P/E reached 25x in June 2020, close to the 2000 dot-com bubble peak (30x), while corporate earnings fell over 30% year-over-year.
- Boundaries of Fed Tool Effectiveness: Even with QE4 pushing the balance sheet to $7 trillion, the 10-year yield remained around 0.7% in June 2020, failing to decline further, suggesting rates are near the zero lower bound.
4. International Comparison: Low Rates ≠ High Valuations
| Region | 10-Year Government Bond Yield (June 2020) | S&P/Local Index P/E | Notes |
|---|---|---|---|
| U.S. | 0.7% | 25x | Above 90th historical percentile |
| Japan | 0.0% | 15x | Below 20-year average of 18x |
| Germany | -0.4% | 18x | Below 20-year average of 20x |
| UK | 0.2% | 16x | Below 20-year average of 17x |
The data shows that low interest rates are not a sufficient condition for high valuations. The prolonged low-rate environments in Japan and Europe did not create valuation bubbles similar to the U.S., further weakening the narrative that "the Fed lowers rates → pushes up stocks."
Conclusion: The Author's Core Stance
The author explicitly aligns with the "I don't know" school, arguing that the market's optimistic expectations regarding Fed policy are excessive and ignore the following facts:
1. The maturity transformation nature of QE cannot directly explain stock market gains;
2. The transmission chain from rates to valuations has multiple breaks;
3. Historical QE cycles have all ended with rising interest rates;
4. International experience shows no necessary link between low rates and high valuations.
Therefore, the author believes U.S. stocks have fully priced in good news, with limited upside potential, while risks (pandemic, earnings decline, policy failure) are systematically underestimated.
Additional Analysis: From Statistical Fallacies to Market Narrative Traps
This section continues the author's critique of the "Fed narrative," using the statistical concept of "spurious correlation" to further dismantle the plausibility of the mainstream market explanation. Using the striking correlation (94.7%) between U.S. cheese consumption and deaths by bedsheet entanglement as an example, the author vividly demonstrates the basic principle that "correlation does not equal causation," pointing out that humans are naturally inclined to weave stories around random patterns—this is precisely the psychological root of the current "Fed drives the market" narrative.
Key Arguments and Data
- Spurious Correlation Example: Tyler Vigen's data shows a correlation coefficient of 0.947 (near-perfect positive correlation) between per capita U.S. cheese consumption and deaths by bedsheet entanglement. This absurd example serves as a reminder: even if two variables move in sync, without a logical mechanism, the correlation may be purely coincidental.
- Narrative Preference Experiment: The author cites a mock trial experiment from Chapter 15 of his book Behavioral Investing: when the prosecution presented evidence in story order and the defense in witness order, 78% of jurors voted guilty; when the formats were swapped, only 31% voted guilty. The same facts, different narrative structures, led to vastly different conclusions—this directly maps to the market: the "liquidity creation" story of the Fed is packaged as a causal chain, while actual data may be mere coincidence.
Historical Warning: Japan's Failed "Price Maintenance Operation"
The author adds a key historical case from personal experience:
- Time: 1992-1993, the Bank of Japan and government directly intervened in the Nikkei 225 index, attempting to keep it above a certain level.
- Result: Short-term intervention failed to prevent the decline (the Nikkei fell from ~23,000 points to 14,000 points in 1992); long-term, the Japanese stock market did not truly bottom and recover until 2013 (with the launch of Abenomics), experiencing a "lost two decades" in between.
- Implication: Even when an official institution directly buys stocks (rather than indirectly influencing rates), it cannot control prices over the long term. This directly refutes the assumption that "the Fed can manipulate the stock market through QE or interest rates."
The "Panglossian" Absurdity of Market Pricing
The author uses Voltaire's Dr. Pangloss (a blindly optimistic philosopher) from Candide as a metaphor for current U.S. stock pricing:
- Core Data: The market appears to price "tail risks" (e.g., a V-shaped economic recovery, rapid pandemic resolution) as a 100% probability base case, rather than low-probability events.
- Comparison: Historically, the S&P 500's forward P/E in August 2020 was ~22x, far above the 20-year average (~16x). The earnings growth assumptions implied by this valuation were severely disconnected from the reality of a U.S. unemployment rate still above 10% and GDP contracting 9% year-over-year.
Comparison Table: Narrative-Driven vs. Fundamentals-Driven
| Dimension | Fed Narrative (Current Mainstream) | Fundamental Value Investing (Author's Stance) |
|---|---|---|
| Core Assumption | Central bank liquidity can infinitely inflate asset prices | Long-term returns are determined by earnings growth, dividends, and valuation mean reversion |
| Attitude Towards Uncertainty | Ignored or downplayed ("the Fed will save us") | Acknowledged and embraced; demands a margin of safety |
| Historical Evidence Support | Spurious correlations (e.g., cheese consumption case), failed Japan intervention | Long-term mean reversion (e.g., Shiller CAPE predicts 10-year returns) |
| Current Market Pricing | Extremely optimistic (tail risks priced as base case) | No margin of safety (valuation above 90th historical percentile) |
| Risk Consequences | May be self-fulfilling in the short term, but inevitably corrects long term | May underperform short term, but protects capital long term |
Conclusion: Quantitative Evidence of Market "Absurdity"
The author quotes Voltaire's saying, "Doubt is not a pleasant condition, but certainty is absurd," and directly asserts that "the U.S. stock market looks absurd." This judgment is not emotional but based on:
1. Statistical Traps: The correlation between the Fed and the stock market has been disproven multiple times historically (e.g., before the 2000 dot-com bubble burst, the Fed raised rates but stocks still rose; before the 2008 crisis, rate cuts failed to prevent the crash).
2. Behavioral Biases: Humans' love for stories (the 78% vs. 31% juror outcome difference) leads market participants to ignore fundamentals and indulge in the "Fed rescue" narrative.
3. Historical Lessons: The failure of Japan's direct intervention in 1992-1993 proves fundamental limitations of official price controls.
Final Warning: The "certainty" priced into the current market is essentially a product of cognitive biases. Long-term value investors should reject this narrative and instead demand a sufficient margin of safety—a condition entirely absent in the U.S. stock market of August 2020.