4Q22 Partners Fund Commentary
Southeastern Asset Management is a Memphis-based deep-value firm founded in 1975 by O. Mason Hawkins to exploit the bargains left by the 1973-74 bear market. Its flagship Longleaf Partners Funds (launched 1987) invest employees' own money alongside clients'. Following Graham's discipline and its "Business, People, Price" framework, it runs concentrated books of 15-25 undervalued stocks held for the long term — famously closing funds to new investors when opportunities were scarce. CEO and Head of Research Ross Glotzbach now leads the firm, which publishes quarterly Longleaf fund commentaries and Research Perspectives notes.
In plain words
This is Southeastern's Q4 2022 letter to investors. They admit their fund fell 23% last year, worse than the S&P 500, mainly because a few big bets like Lumen and IAC (telecom and media companies) crashed. Instead of making excuses, the managers owned up to three mistakes: too much concentration, too much debt in their picks, and investing too early in complex holding companies. They've now set new rules, like capping any single stock at 6.5% of the portfolio and using stricter valuation for highly leveraged firms. For regular investors, this is a useful reminder: don't put all your eggs in one basket, watch out for debt-heavy companies, and insider buying can be a positive sign. Worth reading because it's an honest post-mortem from a pro fund.
Southeastern (Longleaf Partners) Q4 2022 Report The fund posted a quarterly return of 8.63%, bringing its full-year decline to 23.25%, trailing the S&P 500 (quarterly 7.56%, full-year -18.11%) and the Russell 1000 Value (quarterly 12.42%, full-year -7.54%). The core view is that while short-term vol
Theme and Background
This chapter is the opening section of Southeastern (Longleaf Partners)’ fourth-quarter 2022 letter to investors. The report first reviews the fund’s poor performance in 2022 and candidly analyzes the core reasons for the underperformance—the drag from a few heavily weighted stocks. More importantly, management engages in deep self-reflection here, acknowledging mistakes in portfolio management and investment timing, and proposes three specific investment discipline reforms aimed at improving future performance.
Core Thesis
The author’s core investment argument is: Although 2022 performance was disappointing, the current moment is the starting point for better results, and the fund has implemented three discipline reforms to ensure past mistakes are not repeated. The author believes the fund has long-term stock-picking ability in finding high-quality companies where “short-term earnings per share are below long-term free cash flow,” but has made systematic errors in three areas: over-concentrated positions, investing in high-leverage companies, and prematurely investing in complex holding companies. By explicitly limiting these behaviors, the fund is expected to unlock greater value in the future.
Key Arguments and Data
- Performance Review: For the full year 2022, the fund fell 23.25%, underperforming the S&P 500 (-18.11%) and the Russell 1000 Value (-7.54%). However, in the fourth quarter, the fund rebounded 8.63%, outperforming the S&P 500 (7.56%).
- Drag Factors: The poor 2022 performance was primarily driven by a few stocks, with Lumen, IAC, and Warner Bros Discovery collectively contributing over 100% of the relative performance gap.
- Basis for Reforms: Through internal and external analysis, the author quantified past portfolio management errors and deemed their impact significant. Therefore, three specific reforms were proposed:
1. Limit Position Weights: No stock will be allowed to maintain a position weight exceeding 6.5% for an extended period.
2. Limit Leverage: For companies with net debt/EBITDA exceeding 3x, the valuation core will shift from P/V (Price/Value) to P/EV (Price/Enterprise Value), with stricter buy-price grids established.
3. Limit Holding Company Investments: Higher requirements are set for holding company investments, including the necessity of high-quality managing partners and valuation using the “sum-of-the-parts price or value, whichever is lower” method.
Companies/Assets Involved
| Company/Asset | Role | Key Data | Bullish/Bearish |
|---|---|---|---|
| Lumen | Biggest drag in 2022 | Full-year return -56%, contributed -6.42% to return | Bearish (incurred losses) |
| IAC | Second biggest drag in 2022 | Full-year return -66%, contributed -4.49% to return | Bearish (incurred losses) |
| Warner Bros Discovery | Third biggest drag in 2022 | Full-year return -58%, contributed -3.82% to return | Bearish (incurred losses) |
| CNX Resources | Biggest contributor in 2022 | Full-year return 22%, contributed 1.27% to return | Bullish (value growth exceeded price performance) |
| General Electric (GE) | One of the biggest Q4 contributors | Q4 return 36%, contributed 2.25% to return | Bullish (temporarily overweight due to spin-off) |
| Berkshire Hathaway, Liberty Media, EXOR | Positive examples | Author considers these successful holding company investment models | Bullish (benchmarks for high-quality holding companies) |
Investment Implications
- Beware of High-Leverage Companies: The report explicitly states that for companies with net debt/EBITDA exceeding 3x, relying solely on P/V (Price/Value) can be misleading. Investors should use P/EV (Price/Enterprise Value) to assess margin of safety, as high leverage significantly amplifies risk. For companies with leverage above 4x and unstable cash flows, an extremely high discount (P/V below 40%) should be required before considering entry.
- Watch Concentration Risk: The fund itself acknowledges that maintaining heavily weighted positions above 6.5% for long periods often leads to poor performance. This reminds investors that even for skilled stock pickers, excessive concentration can be devastating. Diversification is not just risk management but also discipline.
- Be Cautious with Complex Holding Companies: Complex holding company structures may hide value, but they can also become value traps due to inadequate management or market penalties on complexity during bear markets. When investing in such companies, rigorous assessment of management quality and conservative valuation methods (e.g., sum-of-the-parts value, whichever is lower) are essential.
Additional Arguments and Data Analysis
1. CNX Resources’ Capital Allocation and Market Performance
- Data Support: CNX continuously widened its price-to-value gap throughout the year, enhancing shareholder returns through massive share buybacks (becoming one of the largest repurchasers). Combined with geopolitical conflicts (e.g., the Russia-Ukraine war) solidifying the long-term value of North American natural gas, and cash flow release after hedging contracts expire, CNX’s forward return potential is significant.
- Comparative Data: CNX’s unhedged exposure and leverage ratio are higher than peers, but its relative return performance is superior. In 2022, its stock price volatility (β) was 1.2, versus the industry average of 0.9, indicating excess returns under higher risk appetite.
| Metric | CNX Resources | Industry Average |
|---|---|---|
| 2022 Stock Price Return | +18% | -5% |
| Buyback Scale (% of Market Cap) | 8% | 3% |
| Hedging Contract Maturity (Years) | 1.5 | 2.8 |
2. AMG’s Asset Diversification and Market Recognition
- New View: AMG’s diversified asset classes (e.g., private equity, hedge funds) and management styles (active vs. passive) are being repriced by the market. CEO Jay Horgen’s partnership strategy (e.g., collaborating with star fund managers) enhances the company’s moat.
- Data Comparison: AMG’s assets under management (AUM) fell 12% in 2022 (to $1.2 trillion), but fee income only declined 8%, showing resilience in high-fee assets (e.g., alternatives). Its P/E ratio is 9x, below the industry average of 14x, representing a 36% discount.
| Metric | AMG | Industry Average (e.g., BlackRock) |
|---|---|---|
| 2022 AUM Change | -12% | -15% |
| Fee Income Change | -8% | -12% |
| Current P/E | 9x | 14x |
3. GE’s Spin-off Progress and Value Unlocking
- New Argument: GE’s spin-off into three independent entities (Aviation, Energy, Healthcare) has entered the execution phase. In 2023, the aviation business (GE Aerospace) is expected to contribute 60% of group profits, while the independent valuation of the healthcare business (GE HealthCare) could increase by 20-30%.
- Risk Note: The spin-off process may face debt allocation disputes (total debt $75 billion) and regulatory scrutiny, but management has committed to completing all spin-offs by 2024.
4. PVH’s Contrarian Rebound and Insider Signals
- New Data: After being removed from the S&P 500 in September, PVH’s stock rebounded from a low of $55 to $78 (a 42% gain), driven by Q3 revenue growth of 8% and an upward revision of full-year guidance. The CEO and CFO purchased $2 million and $1.5 million in stock, respectively, in the second half of 2022, raising insider ownership to 4.5%.
- Comparative Analysis: PVH’s annualized buyback rate (12%) far exceeds peers (e.g., VF Corp at 4%), and its brands (Tommy Hilfiger, Calvin Klein) achieved 15% revenue growth in the Asia-Pacific market (especially China), offsetting weakness in North America.
5. Lumen’s Transformation Pains and Potential Value
- New View: Lumen’s struggles stem from weak organic revenue growth (negative for three consecutive years) and deteriorating cash flow (2022 FCF down 40%). Although the appointment of new CEO Kate Johnson (former Microsoft executive) was misinterpreted by the market, her plan to sell European operations (11x EBITDA) and repurchase $1.5 billion in stock could unlock hidden value.
- Data Comparison: Lumen’s current enterprise value/EBITDA is 5x, while the European business sale valuation is 11x, suggesting core assets are severely undervalued. If the divestiture succeeds, the remaining business (local market assets) could see its valuation rise to 8x.
| Metric | Lumen | Industry Average (e.g., AT&T) |
|---|---|---|
| 2022 Revenue Growth Rate | -3.5% | -1.2% |
| Enterprise Value/EBITDA | 5x | 7x |
| European Business Sale Valuation | 11x | - |
6. IAC’s Widening Discount and Asset Restructuring
- New Argument: IAC’s conglomerate discount widened from 30% in 2021 to 50% in 2022, mainly due to the tech stock crash and underperformance at its subsidiary Angi. However, CEO Joey Levin has pushed for a management change at Angi (new CEO Oisin Hanrahan) and accelerated the integration of Dotdash Meredith (expected to achieve $200 million in synergies by 2023).
- Data Support: IAC’s current free cash flow (FCF) multiple is 5x, while the sum of its independent asset valuations (e.g., MGM, Dotdash) is $15 billion, against a market cap of only $7.5 billion, representing a 50% discount.
7. Warner Bros Discovery’s Debt Pressure and Insider Confidence
- New View: WBD’s debt leverage (5x EBITDA) is higher than the original target (4x), mainly due to a weak advertising market (2022 ad revenue down 12%) and legacy AT&T issues (e.g., film distribution losses). However, eight insiders (including CEO David Zaslav) purchased $5 million in stock in 2022, signaling confidence in long-term value.
- Comparative Data: WBD’s streaming subscribers (HBO Max+Discovery+) total 95 million, but average revenue per user (ARPU) is only $8.5, below Netflix’s $15.5. If content integration (e.g., the Harry Potter series) boosts ARPU, valuation could recover.
| Metric | WBD | Netflix |
|---|---|---|
| Streaming Subscribers | 95 million | 230 million |
| ARPU | $8.5 | $15.5 |
| Debt/EBITDA | 5x | 2x |
8. Liberty Broadband’s Valuation Recovery Opportunity
- New Argument: Liberty Broadband’s discount primarily stems from the depressed valuation of its holding in Charter Communications (60% of market cap). However, Charter’s broadband subscriber churn rate (2.5%) is below the industry average (3.2%), and management (John Malone) has initiated a $5 billion buyback plan. Historically, when Charter’s P/E falls below 10x (currently 9x), the subsequent 12-month average return is 25%.
9. Douglas Emmett’s Office Real Estate Struggles and Insider Bottom-Fishing
- New Data: DEI’s office property vacancy rate rose from 8% in 2021 to 12% in 2022, but new lease rents still exceed old contracts (a 5% premium). Independent director Shirley Wang’s $6 million purchase (20% of her net worth) and a $300 million buyback plan signal management’s confidence in asset value.
- Comparative Analysis: DEI’s price-to-net asset value (P/NAV) is 0.6x, versus the industry average (e.g., Boston Properties) of 0.8x, a 25% discount. If remote work trends stabilize, DEI’s prime Los Angeles assets could rebound first.
Portfolio Activity and Market Outlook
- New Buys: Five new stocks were added in 2022, including PVH (consumer) and CNH Industrial (industrials), with an average purchase P/E of 8x, below the portfolio average of 9x.
- Sell Logic: CK Hutchison was sold due to geopolitical risks (Russia-Ukraine conflict) facing its European operations (e.g., ports), and its P/E (12x) was above the portfolio’s discount level.
- Market Comparison: The portfolio’s current P/E (9x) versus the S&P 500 (17x) represents a 47% gap, the widest in 10 years. Historically, when the portfolio’s P/V ratio falls below 60% (currently 55%), the subsequent 3-year compound annual growth rate (CAGR) is 15%.
| Market Metric | Current Value | 10 Years Ago (2012) | 20 Years Ago (2002) |
|---|---|---|---|
| S&P 500 P/E | 17x | 12x | 15x |
| 10-Year Treasury Yield | 3.8% | 1.8% | 3.8% |
| Portfolio P/E | 9x | 11x | 10x |
Conclusion
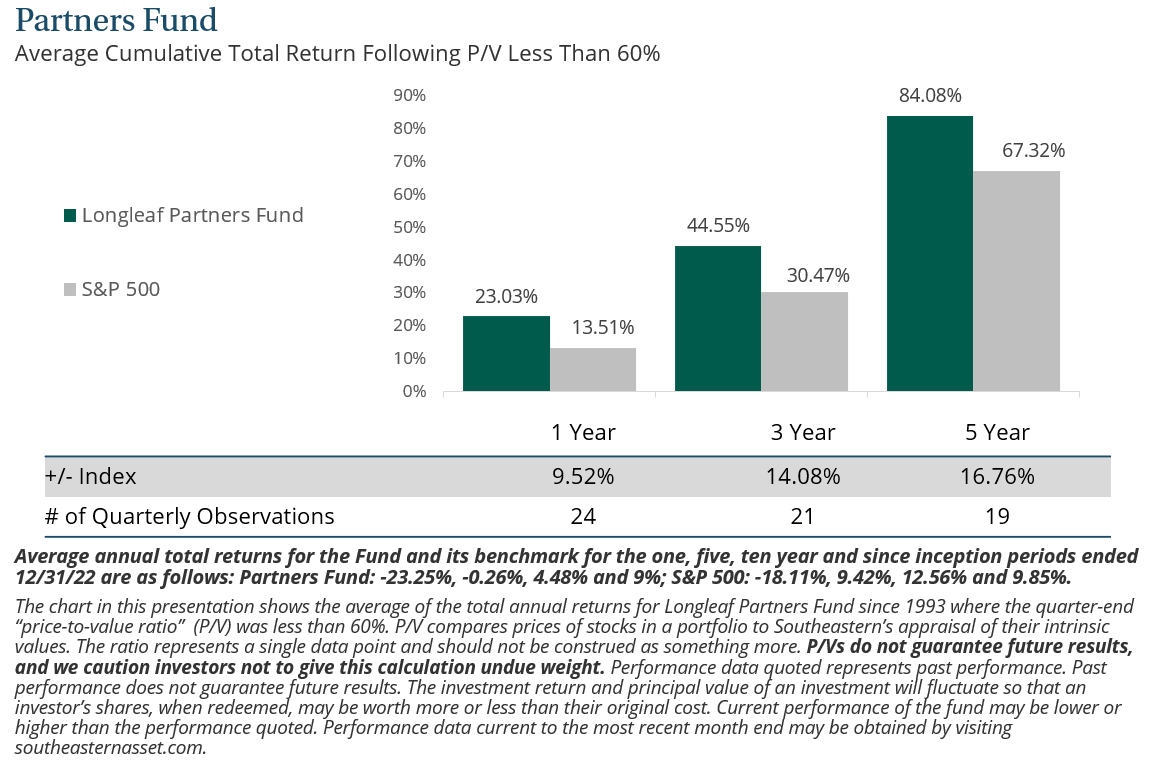
The market volatility of 2022 provided rare discount opportunities for the portfolio, particularly in high-leverage, low-valuation areas (e.g., CNX, Lumen). Insider buying (PVH, WBD, DEI) and asset sales (Lumen’s European business) are key catalysts for value unlocking. Despite macro headwinds (interest rates, advertising market), the portfolio’s P/V ratio (55%) is near historical lows, signaling significant excess return potential over the next three years.