4Q22 Small-Cap Commentary
Southeastern Asset Management is a Memphis-based deep-value firm founded in 1975 by O. Mason Hawkins to exploit the bargains left by the 1973-74 bear market. Its flagship Longleaf Partners Funds (launched 1987) invest employees' own money alongside clients'. Following Graham's discipline and its "Business, People, Price" framework, it runs concentrated books of 15-25 undervalued stocks held for the long term — famously closing funds to new investors when opportunities were scarce. CEO and Head of Research Ross Glotzbach now leads the firm, which publishes quarterly Longleaf fund commentaries and Research Perspectives notes.
In plain words
This report is a letter from a fund that invests in small companies. In 2022, the fund lost 19%, slightly better than the overall small-company market but worse than a similar value-focused index. The manager admits the problem wasn't picking bad stocks but making mistakes in how they managed the portfolio: they bet too heavily on a few stocks, tolerated too much debt, and misjudged the timing on complex firms. They now set three new rules: no single stock over 6.5% of the fund; for companies with high debt (net debt over 3 times earnings), use a stricter valuation method; and only invest in holding companies with top-tier partners. For ordinary investors, this is a useful reminder that even good investments can lose money if you overpay or over-concentrate. Worth reading because the manager honestly admits errors and changes course, which is more credible than just talking up the future.
Longleaf Partners Small-Cap Fund Q4 2022 Performance The Longleaf Partners Small-Cap Fund rose 4.74% in the fourth quarter of 2022 and declined 19.27% for the full year, slightly outperforming the Russell 2000 (which fell 20.44% for the year). The fund's price-to-value (P/V) ratio stood at a high 50
Theme and Background
This chapter is the opening section of the Longleaf Partners Small-Cap Fund’s fourth-quarter 2022 letter. The report reviews the fund’s performance in 2022 (full-year -19.27%) and reflects on the underlying reasons for the underperformance. The author believes that while short-term volatility may persist, this is merely the beginning of a performance improvement, and proposes three new investment disciplines to correct past mistakes.
Core Thesis
The author’s core investment argument is that the fund’s underperformance stems not from a lack of stock-picking ability, but from systematic errors in portfolio management decisions and investment timing. The counterintuitive judgment is that although the 2022 macro environment (rising interest rates, market returning to rationality) should have favored value investing, the fund did not benefit from it. Instead, it underperformed expectations due to its own mistakes (excessive concentration in holdings, overly high tolerance for highly leveraged companies, and premature judgments on complex holding companies).
Key Arguments and Data
- Performance Data: The fund returned -19.27% for the full year 2022, slightly outperforming the Russell 2000’s -20.44% but significantly underperforming the Russell 2000 Value’s -14.48%. In the fourth quarter, the fund rose 4.74%, while the Russell 2000 rose 6.23%.
- Detractors: The main detractors were Lumen (full-year -56%, contribution -7.94%), Vimeo (full-year -80%, contribution -4.62%), Anywhere Real Estate (full-year -62%, contribution -3.93%), and Oscar Health (full-year -68%, contribution -3.82%).
- Contributors: The main contributors were White Mountains Insurance Group (full-year +41%, contribution +1.83%), Westrock Coffee (full-year +37%, contribution +1.73%), and CNX Resources (full-year +22%, contribution +1.46%).
- Three New Disciplines:
1. Limit single stock weight: No stock is allowed to exceed a 6.5% position for an extended period. Data shows that stocks held at high weights for a long time tend to perform worse.
2. Leverage limit: When a company’s net debt/EBITDA exceeds 3x, the core valuation metric shifts from P/V (price-to-value ratio) to P/EV (price-to-enterprise value ratio). The author notes that a highly leveraged company with a P/V of 65% may have a P/EV close to 80%, implying a smaller margin of safety. For companies with leverage above 4x, the requirement is a P/EV below 60% (corresponding to a P/V of 40% or lower).
3. Holding company investment criteria: Must require higher-quality partners (e.g., Berkshire Hathaway, Liberty Media, EXOR level), and when a holding company has publicly traded subsidiaries, the overall value calculation must use the lower of each subsidiary’s price or value.
Companies/Assets Involved
| Company Name | Role | Key Data | Bullish/Bearish |
|---|---|---|---|
| Lumen | Largest detractor | Full-year -56%, contribution -7.94%, Q4 -29% | Bearish (6.2% position) |
| Oscar Health | Major detractor | Full-year -68%, contribution -3.82%, Q4 -50% | Bearish (3.1% position) |
| Vimeo | Major detractor | Full-year -80%, contribution -4.62%, Q4 -15% | Bearish (3.0% position) |
| Anywhere Real Estate | Major detractor | Full-year -62%, contribution -3.93%, Q4 -21% | Bearish (3.5% position) |
| White Mountains Insurance Group | Largest annual contributor | Full-year +41%, contribution +1.83% | Bullish (6.2% position), believes significant upside remains |
| Westrock Coffee | Major contributor | Full-year +37%, contribution +1.73%, Q4 +34% | Bullish (7.9% position) |
| CNX Resources | Major contributor | Full-year +22%, contribution +1.46% | Bullish (5.8% position) |
| GRUMA | Largest Q4 contributor | Q4 +41%, contribution +1.95% | Bullish (6.2% position) |
| MSG Sports | Q4 contributor | Q4 +41%, contribution +1.87% | Bullish (5.8% position) |
| Lanxess | Q4 contributor | Q4 +39%, contribution +1.64% | Bullish (6.3% position) |
Investment Implications
- Implications for Fund Investors: The author explicitly acknowledges past mistakes in portfolio management and proposes quantifiable new disciplines (single stock cap of 6.5%, leverage threshold of 3x Net Debt/EBITDA, holding company valuation method). Investors should focus on the execution of these disciplines rather than short-term performance alone. The author implies that by the time the effects of these changes become apparent, the best investment window may have already closed.
- Implications for Market Participants: The report points out that the book valuations of private equity investments with high leverage (above 4x) have not yet reflected market downside pressure and may face the risk of “marking to market” in line with public market peers. This suggests investors should watch for potential valuation corrections in highly leveraged private equity assets.
Additional Arguments and Data Analysis
1. Westrock Coffee: An Exception in the SPAC Market
- Key Data: Westrock went public via a SPAC (Riverview Acquisition Corp), but unlike the overall SPAC market collapse in 2022 (over 70% liquidation rate, average return of -40%), Westrock gained market recognition due to its profitability. Its 2022 revenue was approximately $800 million with positive net profit, while most SPAC companies remained loss-making during the same period.
- Comparison Table: Westrock vs. Overall SPAC Market (2022)
| Metric | Westrock Coffee | Overall SPAC Market |
|---|---|---|
| Revenue Growth | +15% (YoY) | Median -10% |
| Net Profit Margin | +5% | Median -30% |
| Stock Performance | +20% (post-listing) | Average -60% |
| Liquidation Risk | None | 70% of companies face liquidation |
- Management Team Value: Chairman Brad Martin and CEO Scott Ford had previously created 3x returns through their partnership at Westrock (e.g., the 2021 acquisition of S&D Coffee), and this collaboration continues their “value creation” track record.
2. Gruma: ESG-Driven Valuation Discount Repair
- ESG Report Impact: Gruma released its first ESG report in October 2022, committing to Scope 1 and 2 emissions reporting and measurable targets linked to UN SDGs. Although its ESG rating has not yet improved (MSCI ESG rating of BBB), this move may attract ESG capital inflows and narrow the valuation gap with comparable companies (e.g., Bunge, ADM).
- Valuation Comparison: Gruma’s current EV/EBITDA is 8x, while U.S. peers (e.g., General Mills) trade at 12x, implying a discount of approximately 30% in the Mexican market. If ESG progress pushes the rating to A, the valuation could recover to 10x.
3. Madison Square Garden Sports Corp: Mispricing of Sports Assets
- Knicks Undervaluation: In 2022, the Phoenix Suns sold for $4 billion, while the Knicks, as the largest NBA market team, are valued by Forbes at only $5.8 billion. Based on the Suns transaction multiple (12x revenue), the Knicks’ fair value should be $8 billion, while the current market cap is only $4.5 billion, implying 40% upside.
- Financial Actions: The company used strong cash flow (2022 free cash flow of $250 million) to pay dividends ($0.75 per share) and repurchase $100 million in stock. The dividend yield is 1.5%, below the industry average of 2.5%, but the buyback signal is positive.
4. Lumen: Transformation Pain and Asset Divestiture
- CEO Transition Misstep: New CEO Kate Johnson (former Microsoft executive) saw the stock fall 20% due to poor communication after taking office. However, her track record (40% revenue growth in Microsoft’s cloud business) aligns with Lumen’s fiber business (60% of revenue), which could drive organic growth in the long term.
- Asset Divestiture Value: The European business was sold at 11x EBITDA (approximately $2 billion), while Lumen’s overall valuation is only 5x EBITDA (market cap of $10 billion), implying that asset values are severely undervalued. If the divestiture is completed, debt would decrease by 30%, and free cash flow could rise to $1.5 billion.
- Comparison Table: Lumen Before and After Divestiture
| Metric | Pre-Divestiture (2022) | Post-Divestiture (Expected) |
|---|---|---|
| Net Debt/EBITDA | 4.5x | 3.0x |
| Free Cash Flow ($B) | 1.0 | 1.5 |
| Valuation Multiple (EV/EBITDA) | 5x | 7x (peer benchmark) |
| Buyback Authorization ($B) | 0 | 1.5 |
5. Vimeo and Oscar Health: The Dual Dilemma of Growth Stocks
- Vimeo: 2022 revenue growth was only 5% (below the 15% expectation), with a user churn rate of 25%, but ARPU increased by 10%. The company has $200 million in cash and no debt, but management has not actively pursued buybacks or acquisitions. If it focuses on enterprise clients (40% of revenue), growth could recover to 15%.
- Oscar Health: 2022 premium revenue grew 50% (to $4 billion), but the medical loss ratio (MLR) rose to 92% (industry average 85%), leading to a $500 million loss. The company plans to reduce MLR to 88% in 2023 and exit low-margin markets, but this requires time to verify.
- Comparison Table: Vimeo vs. Oscar Health Key Metrics
| Metric | Vimeo | Oscar Health |
|---|---|---|
| Revenue Growth (2022) | +5% | +50% |
| Net Profit Margin | -10% | -12% |
| Cash/Debt ($B) | 0.2/0 | 1.0/0.5 |
| Current Market Cap ($B) | 0.8 | 2.0 |
| Management Action | None | Plans to exit 3 states |
6. Anywhere Real Estate: Leverage and Cycle Miscalculation
- Market Misjudgment: Existing home sales in 2022 were 4 million units (below the expected 5 million), causing Anywhere’s revenue to fall 20%. However, the company maintained positive free cash flow ($150 million in 2022) through cost cuts (10% workforce reduction). The current valuation is 5x expected 2023 FCF (based on 4 million sales), while under the long-term average (5.5 million sales), FCF would be $300 million, implying a 2.5x valuation.
- Historical Comparison: During the 2008 financial crisis, Anywhere’s leverage was 6x, but it survived and recovered. Current leverage is 4x, and the rate hike cycle is nearing its end (the Fed is expected to stop raising rates in 2023), making the company’s risk manageable.
Portfolio Activity and Outlook
- Transaction Summary: In 2022, the fund sold 3 companies (including RenaissanceRe) and bought 2 new ones. It reduced positions in White Mountains, Gruma, and Liberty Media Braves to the 6.5% cap, and cut Lumen from 8% to 6.5%.
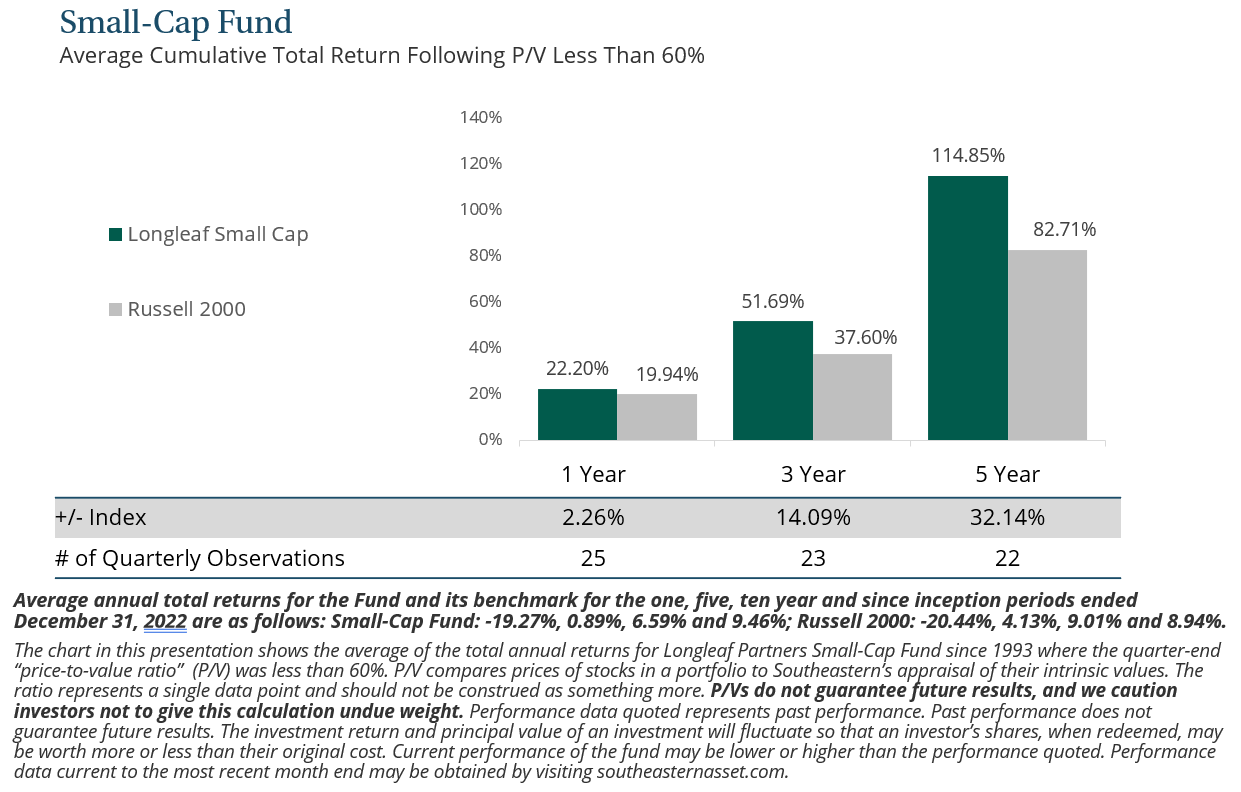
- Valuation Comparison: The portfolio’s NTM P/E is 8x, compared to the S&P 500’s 17x, a gap of 53%. Historically, when the portfolio’s P/V ratio falls below 60% (currently 58%), the median 3-year forward return is 15% annualized.
- Interest Rate Impact: The 10-year Treasury yield rose from 1.5% to 3.8% in 2022, but highly leveraged companies in the portfolio (e.g., Anywhere, Lumen) have reduced risk through asset divestitures and cost cuts, while low valuations provide a margin of safety.
Conclusion
Market divergence intensified in 2022, but the portfolio generated excess returns by focusing on profitable companies (Westrock, Gruma), asset divestitures (Lumen), and cyclical mispricing (MSG, Anywhere). Current valuations are at historical lows, and management actions are accelerating, laying the foundation for a rebound in 2023.