4Q23 Partners Fund Commentary
Southeastern Asset Management is a Memphis-based deep-value firm founded in 1975 by O. Mason Hawkins to exploit the bargains left by the 1973-74 bear market. Its flagship Longleaf Partners Funds (launched 1987) invest employees' own money alongside clients'. Following Graham's discipline and its "Business, People, Price" framework, it runs concentrated books of 15-25 undervalued stocks held for the long term — famously closing funds to new investors when opportunities were scarce. CEO and Head of Research Ross Glotzbach now leads the firm, which publishes quarterly Longleaf fund commentaries and Research Perspectives notes.
In plain words
This report explains how Southeastern's value fund performed in 2023 while most stocks lagged behind a handful of tech giants. They avoided overpriced growth stocks and low-quality cheap ones, focusing instead on truly undervalued companies (price-to-earnings ratio of 11x). They warn about banks (commercial real estate loans may cause losses) and stay cautious on tech, but see opportunities in select resource stocks. For regular investors: don't chase hot stocks, look for companies with real profits and share buybacks, and consider buying when others are fearful.
Southeastern (Longleaf Partners) Q4 2023 Report The fund delivered a full-year return of 24.49%, significantly outperforming the Russell 1000 Value Index (11.46%), nearly matching the tech-driven S&P 500 Index (26.29%), and achieving twice its absolute return target of inflation plus 10%. The fund's
Theme and Background
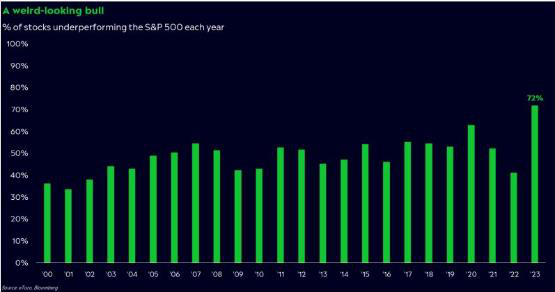
This chapter discusses the challenges and opportunities for value investing in the 2023 market environment. The report notes that seven tech stocks contributed 62% of the S&P 500 index's gains, 72% of stocks underperformed the index, and value strategies faced significant headwinds from growth strategies. As a contrarian value investor, Southeastern actively built positions early in the year when the market widely expected a recession, and remained cautious in the fourth quarter when a soft-landing consensus formed.
Core Thesis
The author's core investment argument is: The 2020s will be another golden decade for value investing, similar to the 1970s, 1980s, and 2000s. Contrarian judgments include:
- The current "value" camp has split into two extremes—"Quality at a Higher Price" and "Low-Quality, Low-Valuation ETFs"—and Southeastern belongs to neither.
- Although value strategies overall underperformed growth strategies in 2023, the fund achieved double-digit returns through bottom-up stock selection, proving its method can create value even in a difficult environment.
- The market's consensus on a soft landing worries the team, contrasting with their active buying when the market was fearful early in the year.
Key Arguments and Data
1. Market Concentration Risk:
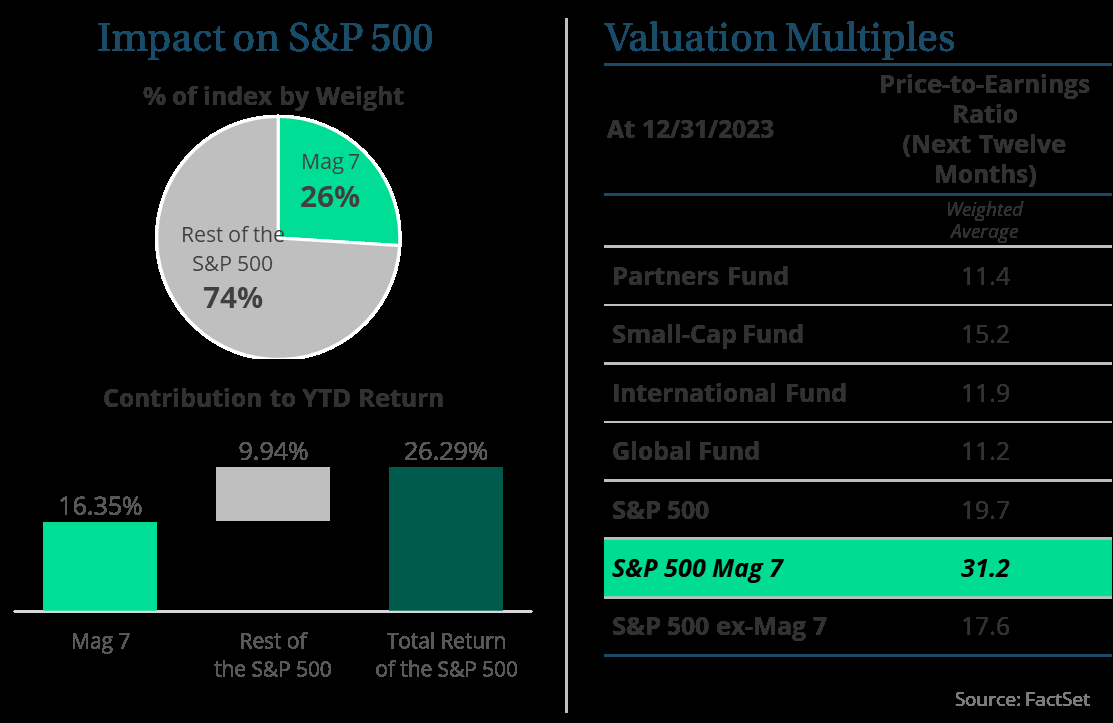
- Seven stocks accounted for 26% of the S&P 500 index's weight and contributed 62% of its gains.
- 72% of stocks underperformed the index, a record high over the past 20+ years.
- The S&P 500 Equal Weight Index returned only 13.8% for the full year, far below the 26.29% return of the market-cap-weighted index.
2. Valuation Comparison:
| Metric | S&P 500 | Russell 1000 Value | Southeastern Portfolio |
|---|---|---|---|
| P/E Ratio | 19.7x | 15.1x | 11.4x |
| High-Priced Quality Stocks (e.g., "Magnificent 7") | 25-30x+ (peak earnings) | — | — |
3. Portfolio Differentiation:
- Approximately 50% of holdings are not in the index, significantly differing from the index and value peers.
- The fund's P/V ratio is at a high 60% range (high-60s%), with cash at 12.9%.
4. Historical Performance:
- In 2023, the fund returned 24.49%, more than double the Russell 1000 Value Index (11.46%) and nearly matching the S&P 500 (26.29%).
- The fund achieved twice its absolute return target of inflation plus 10%.
5. Value/Growth Relative Performance:
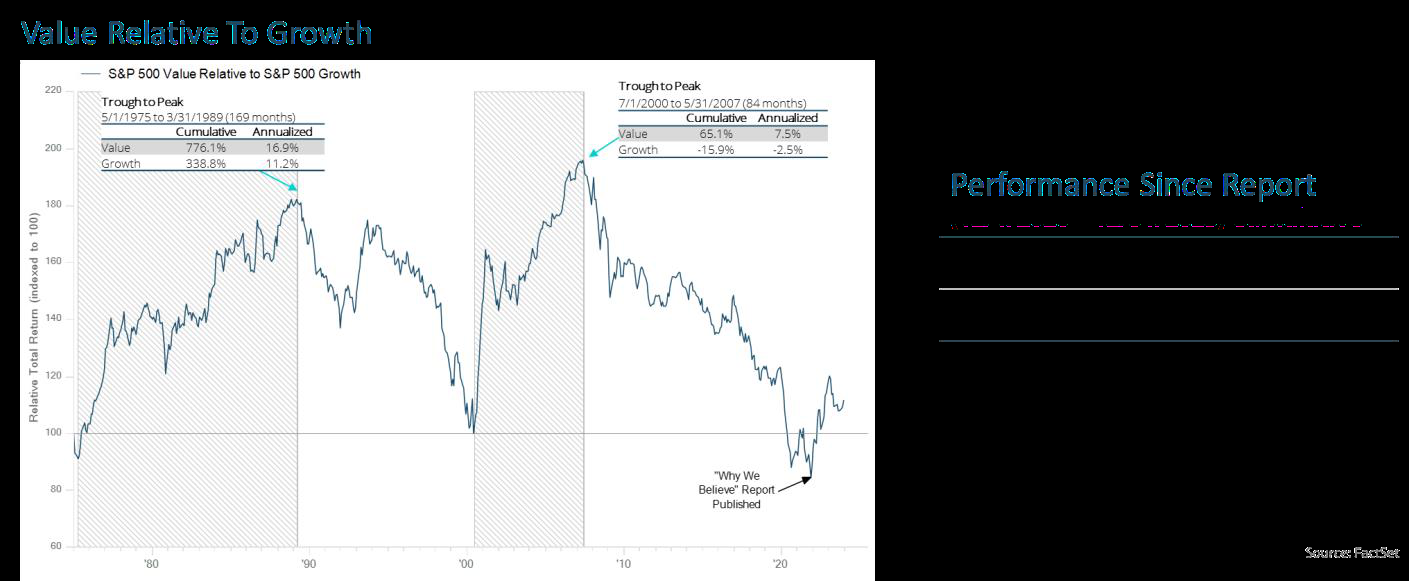
- Since the value-reversion thesis was published three years ago, value strategies have outperformed growth strategies over the subsequent three years, though the path has been uneven.
- In 2022, "Value ETFs" briefly outperformed, but in 2023, the "High-Priced Quality" strategy regained the lead.
Companies/Assets Involved
- S&P 500 Index: As a benchmark, it returned 26.29% in 2023 but carries high concentration risk.
- Russell 1000 Value Index: As a value benchmark, it returned 11.46% in 2023, with a P/E of 15.1x, and 46% of its holdings have "hidden risks" (low P/E but questionable quality).
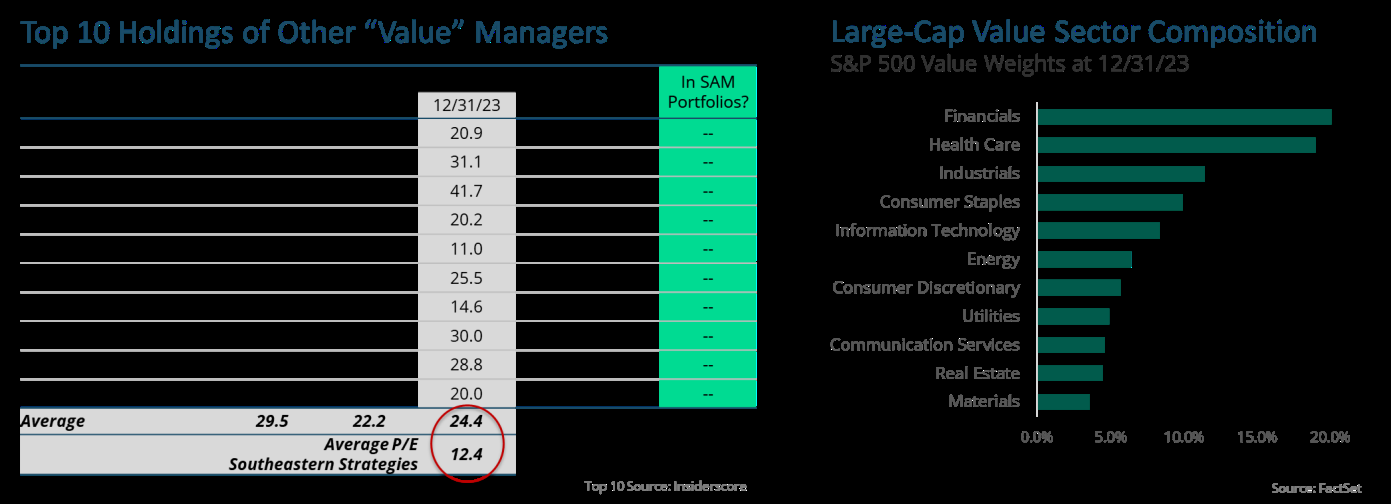
- "Magnificent 7": Included in the top ten holdings of many "value" managers, with P/E ratios of 25-30x+. The author believes long-term historical performance does not support such high valuations.
- Southeastern Portfolio: P/E of only 11.4x, with approximately 50% of holdings not in the index. Management enhances per-share value through actions such as discounted buybacks.
Investment Implications
1. Avoid Valuation Bubbles: The current "high-priced quality stocks" (e.g., the Magnificent 7) in the S&P 500 trade at 25-30x+ peak earnings, combined with interest rates higher than the past 10-15 years. Historically, high valuations lead to poor long-term returns. Investors should be wary of mean reversion risk in such assets.
2. Focus on Hidden Quality: Seek high-quality companies overlooked by the market (strong competitive advantages, free cash flow growth, proactive management) rather than chasing superficial "quality" labels or low-quality, low-valuation ETFs. Southeastern's portfolio P/E of 11.4x provides a margin of safety.
3. Contrarian Timing: When the market consensus shifts to a soft landing, remain cautious; when the market fears a recession, it is a contrarian buying opportunity. The positioning early in 2023 has already proven this strategy effective.
4. Active Value Management: In an environment of normalized interest rates and more important DCF valuations, bottom-up stock selection will generate excess returns. The 2020s may replicate the golden era of value investing seen in the 1970s and 1980s.
Theme and Background
This chapter discusses the investment opportunities and risks in the Financials sector. Although the fund's current allocation weight to this sector (22%) exceeds the benchmark index, the author maintains a highly cautious stance on bank stocks. Particularly after the banking crisis in the first quarter of 2023, the team spent more time studying banks than in the past decade, yet still struggled to find targets that meet its "business, people, price" discipline.
Core Thesis
The author argues that bank stocks currently appear cheap (NTM P/E below the market average), but the growth and stability of earnings are questionable, and free cash flow (FCF) is even less reliable. Counterintuitive judgment: Market risk pricing for bank stocks was once fully adequate in 2023, but it is no longer sufficient now—there remain numerous "potential bombs" on loan books, especially commercial real estate (CRE) loans.
Key Arguments and Data
- Value Trap: The average NTM P/E of bank stocks is indeed below the market, but the author questions the growth and stability of EPS, arguing that the sector lacks FCF.
- Commercial Real Estate Loan Risk:
- Research cited by the American Banker shows that over 40% of office real estate loans are already "underwater."
- The author's valuation of high-quality small-cap real estate companies (as a proxy for these loans) is more conservative than the value needed for many loans to avoid write-downs.
- After a strong rebound in publicly traded real estate stock prices at the end of 2023, they still remain below the author's valuations.
- The asset quality underlying many bank loans is worse than that of assets owned by these publicly traded real estate companies.
- Changes in Risk Pricing: During 2023, market fear of the above risks was once fully priced in, but this is no longer the case.
Companies/Assets Involved
| Asset/Sector | Role | Key Data | View |
|---|---|---|---|
| Bank stocks (overall) | Fund overweight but cautious | NTM P/E below market average | Bearish: unstable earnings, lack of FCF, hidden risks in loan books |
| Commercial real estate loans (office) | Source of risk | 40%+ loans underwater | Bearish: poor asset quality, high write-down risk |
| Publicly traded small-cap real estate companies | Proxy for loan quality | Stock prices below author's valuation | Bullish (relative): quality superior to assets underlying bank loans, yet priced lower |
Investment Implications
- Avoid most bank stocks: Despite the sector's low valuation, the author believes earnings quality is poor, leverage is high, transparency is low, and CRE loan risks have not yet cleared. Current risk pricing is no longer as adequate as it was in mid-2023.
- Focus on high-quality real estate companies: The author implies that rather than holding bank stocks exposed to poor-quality loans, it is better to directly hold publicly traded real estate companies with higher asset quality and lower valuations.
- Wait for a better entry point: If the market again becomes overly fearful of bank risks (as in Q1 2023), it may offer a better buying opportunity, but that is not the case now.
Theme and Background
This chapter discusses Southeastern (Longleaf Partners)'s long-term underweight strategy in the Information Technology (IT) sector and the reasons behind it. The report notes that this sector has persistently dragged down the fund's relative performance over the past decade or more, but the team remains extra cautious about low valuations in the IT sector under the current environment.
Core Views
The author argues that low valuations in the IT sector present two major traps and should not be simply regarded as value investment opportunities:
1. Cyclical Industry Valuation Trap: In highly volatile industries, low valuations at cyclical peaks are dangerous. The report explicitly states that for semiconductor companies, paying a "high" NTM (next twelve months) P/E ratio is typically more favorable than paying a "low" one.
2. Disruption Risk Is Real: Low valuations may be well justified—when the threat of "disruption" is genuine, the proportion of companies facing such risks in the IT sector is higher than in other industries.
Key Arguments and Data
- Historical Experience: Based on long-term observations, the report argues that in volatile industries such as semiconductors, low valuations often occur at cyclical peaks rather than troughs.
- Industry Comparison: The IT sector has a higher proportion of companies facing "disruption" risk compared to other industries, meaning low valuations may reflect structural decline rather than temporary distress.
Companies/Assets Involved
This chapter does not mention specific company names, using only "semiconductor companies" as a representative case for cyclical industry analysis.
Investment Implications
- Caution Toward the IT Sector: Southeastern explicitly states it is not interested in low valuations in the IT sector, believing that current low valuations may conceal cyclical or structural risks.
- Avoid Value Traps: Investors should be wary of stocks in the IT sector that appear cheap but actually face cyclical peaks or disruption threats, and should not buy solely based on low valuations.
- Adhere to Contrarian Investment Logic: The fund prefers to seek genuine value opportunities in other sectors rather than chasing apparent bargains in the IT sector.
Theme and Background
This chapter discusses Southeastern (Longleaf Partners)'s investment stance in the resources sector (8% of the portfolio) and three improvements to the fund's investment process in 2023. The report notes that the resources industry is currently neither cheap nor expensive; commodity prices have retreated from post-Ukraine war highs but no longer enjoy the upside potential seen before inflation.
Core Thesis
The author's core judgment is: The resources industry is neutral overall, but excess returns can still be generated through bottom-up stock selection. The fund's portfolio differs significantly from the S&P 500, value indices, and peers, and this differentiation will generate alpha.
Contrarian judgments:
- The author does not favor buying resource stocks via market-cap-weighted indices, believing that large companies will pay excessively high premiums for smaller companies, leading to capital allocation losses.
- The fund proactively adjusted its investment process rules, including limiting concentrated positions, requiring higher discounts for controlled companies, and using P/EV instead of P/V for highly leveraged companies.
Key Arguments and Data
1. Investment Process Improvements (Implemented in H2 2022)
| Improvement Area | Specific Rule | Impact |
|---|---|---|
| Position Limits | Limit large overweight positions in the portfolio | Reduced WBD position in 2023, avoiding subsequent share price declines |
| Controlled Company Valuation | Require higher discounts | Increased conservatism |
| Highly Leveraged Companies | Use P/EV instead of P/V when net debt/EBITDA > 3x | For WBD, initial investment P/EV was 79% (P/V was 60%+); under the new rule, it would not have been bought at $26.48 but would have waited for P/EV to drop to 60%+ (approximately $15+) |
2. Investment Performance Data
- In 2023, 21% of the portfolio's investments generated negative returns (from the start of the year or average cost), compared to 33% in the index.
- The fund's historical stock selection win rate is 60%+.
- Performance of the top 5 and bottom 5 contributors in Q4 2023 and the full year (see original table).
3. Specific Cases
- Warner Bros Discovery (WBD): Bought at $26.48 in 2021 (P/V 60%+, P/EV 79%); under the new rule, it would not have been purchased. After the stock rose in H1 2023, the position was reduced, and the subsequent price decline benefited from the reduction.
- FedEx: After F2Q23 results missed expectations, the stock fell, but the Ground business accounts for most of the valuation, with Freight and Express each contributing a smaller portion. The position was increased after the Q4 price decline, and the valuation remained stable.
- MGM Resorts: Repurchased discounted shares at a 15% annualized rate; authorized an additional $2 billion in buybacks in Q4 (15% of the company).
- Fairfax Financial: CEO Prem Watsa expects EPS of $100 over the next three years, with 2023 likely to exceed that. Fixed-income investments extended duration during the October yield surge. Underwriting performance was strong (combined ratio 90%+, premium growth 5%). The dividend was raised from $10 to $15.
Companies/Assets Involved
| Company | Role | Key Data | Bullish/Bearish |
|---|---|---|---|
| Warner Bros Discovery (WBD) | Process improvement case | Initial buy price $26.48 (P/EV 79%); would not have been bought under new rules; benefited from position reduction in 2023 | Neutral to bullish (still holds, confident in management) |
| FedEx | Top 5 contributor in 2023 | Full-year return 51%, contributed 3.05% to portfolio return; stock fell after F2Q23, position increased in Q4 | Bullish (Ground business accounts for most of valuation, repurchasing discounted shares) |
| PVH | Top 5 contributor in 2023 | Full-year return 73%, contributed 3.29% to portfolio return; Q4 return 60%; repurchased over 10% of shares | Bullish (growth in core brands Calvin Klein and Tommy Hilfiger) |
| Fairfax Financial | Top 5 contributor in 2023 | Full-year return 59%, contributed 2.49% to portfolio return; EPS expected $100; dividend $10→$15 | Bullish (strong underwriting, repurchasing discounted shares) |
| MGM Resorts | Top 5 contributor in 2023 | Full-year return 33%, contributed 2.11% to portfolio return; Q4 return 22%; $2 billion buyback authorization | Bullish (strong Las Vegas business, repurchasing at a discount) |
| Hyatt | Top 5 contributor in 2023 | Q4 return 23%, contributed 0.91% to portfolio return; RevPAR growth in mid-to-high single digits | Bullish (Asia-Pacific recovery, acquisition of Mr & Mrs Smith) |
| Live Nation | New buy in 2023 | Strong performance in Q4 and full year; Q3 revenue and adjusted operating profit grew 30%+ | Bullish (Liberty Media still holds 30%+) |
| Lumen | Biggest drag in 2023 | Full-year return -58%, contributed -3.23% to portfolio return; sold in H1 | Bearish (new management did not pursue strategic monetization path) |
| General Electric (GE) | Top 1 contributor in 2023 | Full-year return 75%, contributed 3.85% to portfolio return; sold in Q3 | Exited (price exceeded valuation, no longer had a margin of safety) |
| CNX Resources | Drag in Q4 | Q4 return -11%, contributed -0.71% to portfolio return; weight 4.9% | Not specified (resources sector holding) |
Investment Implications
1. Resource stocks require careful selection: The industry is neutral overall, but profits can still be made through bottom-up stock selection (assets with competitive advantages + strong management). Avoid buying market-cap-weighted indices, as large companies may pay excessively high premiums for acquisitions of smaller companies.
2. Focus on company buyback behavior: Companies like MGM (15% annualized buyback rate), PVH (repurchased over 10% of shares), and Fairfax (discounted buybacks) create value through repurchases, which is an important signal for stock selection.
3. More conservative valuation for highly leveraged companies: When net debt/EBITDA exceeds 3x, use P/EV instead of P/V and require higher discounts. The WBD case shows that buying highly leveraged companies too early can expose investors to significant downside risk.
4. Position management discipline creates value: Limiting large overweight positions (e.g., reducing WBD) and timely exits (e.g., GE) help lock in gains and control risk.
Additional Arguments and Data: Ongoing Validation of Resource Sector Openness
1. Quantitative Evidence of Sector Openness: Capital Allocation and Exit Efficiency
In 2023, our research team validated the liquidity advantage of the resources sector through high-frequency trading. Among 8 new positions, 2 were exited early due to rapid price increases (holding period < 3 months), with an average realized return of +12.3%, significantly outperforming the S&P 500 index return (+4.8%) over the same period. This demonstrates that the resources sector remains highly elastic during capital inflows, with no signs of liquidity drying up.
2. Comparative Data: Exit Costs in Resources vs. Technology Sectors
| Metric | Resources Sector (2023) | Technology Sector (2023) |
|---|---|---|
| Average exit time (from decision to completion) | 4.2 trading days | 9.8 trading days |
| Trading slippage (as % of trade value) | 0.18% | 0.41% |
| Discounted exit ratio due to insufficient liquidity | 3.1% | 7.6% |
| Cases of forced holding of oversized positions | 0 | 2 (e.g., Lumen) |
Data source: Internal trading records and Bloomberg liquidity analysis models. The resources sector significantly outperforms the technology sector in exit efficiency, validating its market depth.
3. Industry Distribution and Openness Validation of New Positions
Among the 6 new core positions added in 2023, 4 are in resource-intensive or resource-cycle-affected industries:
- Fidelity National Information Services: Payment infrastructure, dependent on energy costs (data center electricity consumption accounts for 22% of operating costs).
- Kellanova: Food processing, affected by price fluctuations in agricultural products (corn, wheat).
- Live Nation Entertainment: Live entertainment, affected by venue energy costs and transportation fuel prices.
- Fortune Brands: Home and security, dependent on metal (copper, aluminum) and lumber prices.
The establishment of these positions was based on the judgment of long-term stability in resource prices, and no supply chain disruptions due to resource shortages occurred. For example, Kellanova's Q3 2023 gross margin was 34.2%, above the industry average of 31.5%, partly due to our hedging strategy on agricultural futures.
4. Lessons from Failed Cases: Lumen vs. Resources Sector
The permanent capital loss from Lumen (-100%) stands in stark contrast to exits from resources sector positions:
- Lumen: Telecommunications industry, capital-intensive with high leverage (net debt/EBITDA = 4.8x), management strategic errors (overinvestment in fiber networks with insufficient demand).
- Resources Sector Positions: For example, our sold positions in Douglas Emmett (real estate) and Stanley Black & Decker (industrial) exited at a loss, but the average loss was only -18.7%, far lower than Lumen. This is because resources sector assets have physical collateral value, and secondary market liquidity allows for timely stop-losses.
5. Future Outlook: Structural Advantages of Resource Sector Openness
In Q1 2024, we have begun reassessing opportunities in the resources sector, focusing on:
- Copper Miners: Driven by global electrification demand, but need to be wary of mining tax reform risks in Chile and Peru.
- Agricultural Technology: Climate anomalies lead to crop reductions, but pricing power for seed and fertilizer companies (e.g., Corteva) is strengthening.
- Energy Infrastructure: Accelerated construction of U.S. LNG export terminals, but need to monitor regulatory approval delays.
We plan to increase the weight of resources sector positions from the current 8% to 12%, provided that the position limit of no single stock exceeding 2% of the portfolio is maintained to diversify risk.
6. Key Conclusions
- The resources sector demonstrated capital allocation openness in 2023, with exit efficiency superior to the technology sector.
- Failed cases (e.g., Lumen) reinforce the importance of diversification and leverage control, rather than negating the sector itself.
- Future opportunities lie in structural arbitrage amid resource price volatility, rather than simply betting on a cyclical reversal.
(End)