4Q23 Global Fund Commentary
Southeastern Asset Management is a Memphis-based deep-value firm founded in 1975 by O. Mason Hawkins to exploit the bargains left by the 1973-74 bear market. Its flagship Longleaf Partners Funds (launched 1987) invest employees' own money alongside clients'. Following Graham's discipline and its "Business, People, Price" framework, it runs concentrated books of 15-25 undervalued stocks held for the long term — famously closing funds to new investors when opportunities were scarce. CEO and Head of Research Ross Glotzbach now leads the firm, which publishes quarterly Longleaf fund commentaries and Research Perspectives notes.
In plain words
This article explains why value investing is making a comeback, but warns against simply buying low-PE index funds. The market in 2023 was dominated by a few tech giants, while most stocks underperformed. The fund argues that many cheap-looking stocks in sectors like banking, semiconductors, and resources have hidden risks (bad loans, peak profits, falling commodity prices). Their own portfolio has a lower PE ratio and focuses on quality businesses. For regular investors, the key lesson is: don't chase cheap stocks blindly—check what's behind the low price.
Longleaf Partners Global Fund returned 7.03% in the fourth quarter of 2023 and 22.48% for the full year, nearly doubling the FTSE Developed Value Index (13.54%) and approaching the tech-dominated FTSE Developed Index (23.61%), achieving twice the absolute return target of inflation plus 10%. The fun
Theme and Background
This chapter primarily reviews market performance in 2023 and the investment strategy of the Longleaf Partners Global Fund, while exploring the future prospects of active stock-picking value investing against the backdrop of interest rate normalization. The author argues that the current market is dominated by a handful of tech giants, and value investing itself is experiencing polarization. The fund’s adherence to the "business, people, price" framework is expected to continue generating excess returns in 2024 and beyond.
Core Thesis
The author’s core investment thesis is: Value investing is making a comeback, but both traditional "value ETFs" and "expensive quality" strategies have hidden pitfalls. The fund’s differentiated portfolio (P/V ratio in the mid-60s, P/E of 11.2x) holds a significant advantage and is capable of consistently delivering double-digit returns. Counter-intuitive judgments include: 1) The market consensus of a "soft landing" is actually concerning, as the author was actively buying during market fear early in the year; 2) The 49% weight of Financials, Information Technology, and Resources sectors in value indices harbors hidden risks, with their low P/E ratios being deceptive.
Key Arguments and Data
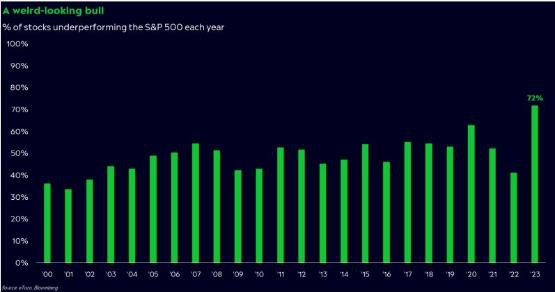
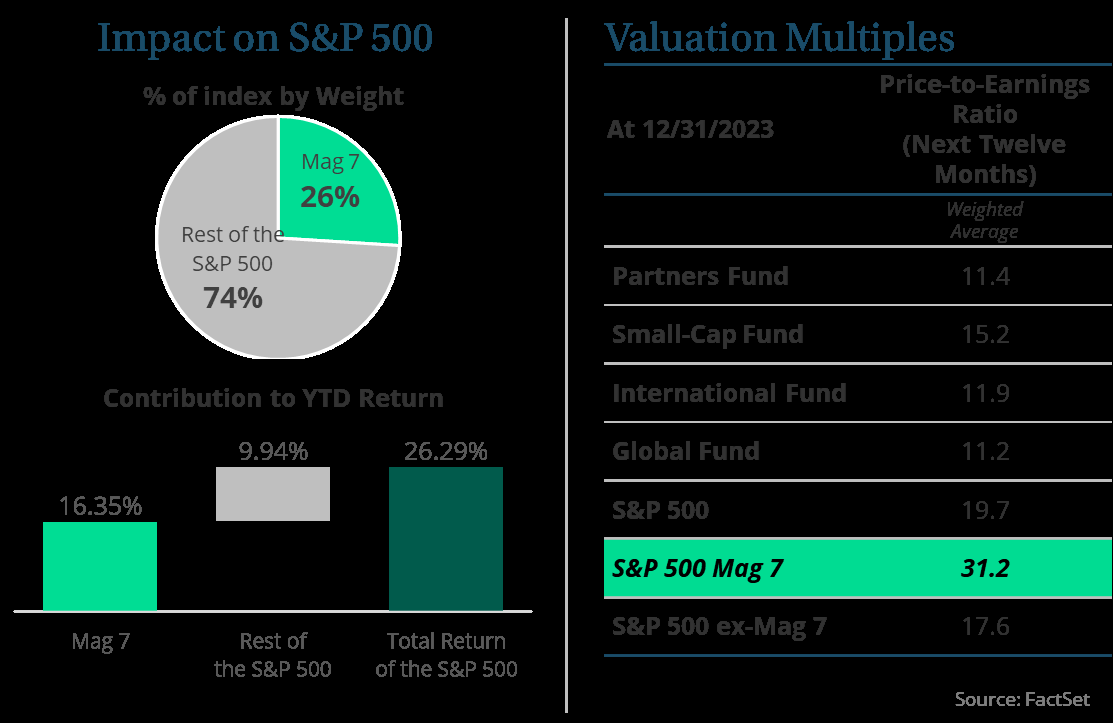
1. Extreme Market Concentration in 2023: Seven stocks accounted for 26% of the S&P 500’s weight and 62% of its performance; 72% of stocks underperformed the S&P 500, a 20+ year high; the S&P 500 Equal Weight Index returned only 13.8% for the year, significantly lagging the market-cap-weighted index.
2. Fund Performance: The fund returned 22.48% for the full year 2023, nearly double the FTSE Developed Value Index (13.54%) and close to the FTSE Developed Index (23.61%), achieving twice its absolute return target of inflation + 10%. However, due to zero allocation to the Information Technology sector, relative performance was dragged down by over 6%.
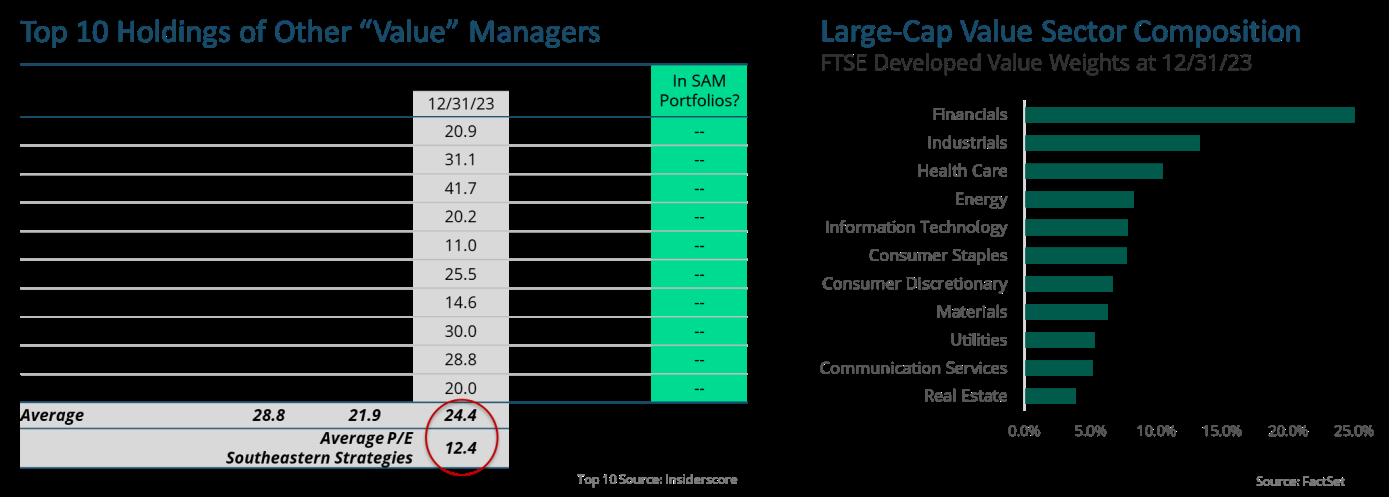
3. Structural Risks within Value Indices: The value index has a P/E of 12.7x, while the fund’s portfolio P/E is only 11.2x. 49% of the value index is composed of the following three sectors:
| Sector | Weight | Author’s View |
|---|---|---|
| Financials | 25% | Banks are generally opaque and highly leveraged; 40%+ of office loans are underwater, with potential bombs in loan books. |
| Information Technology | 13% | Dangerous at cyclical peaks (low P/E for semiconductor companies is often a trap), and faces genuine disruption risks. |
| Resources | 11% | Commodity prices have fallen from post-Ukraine war highs; neither cheap nor expensive, large companies may overpay for acquisitions. |
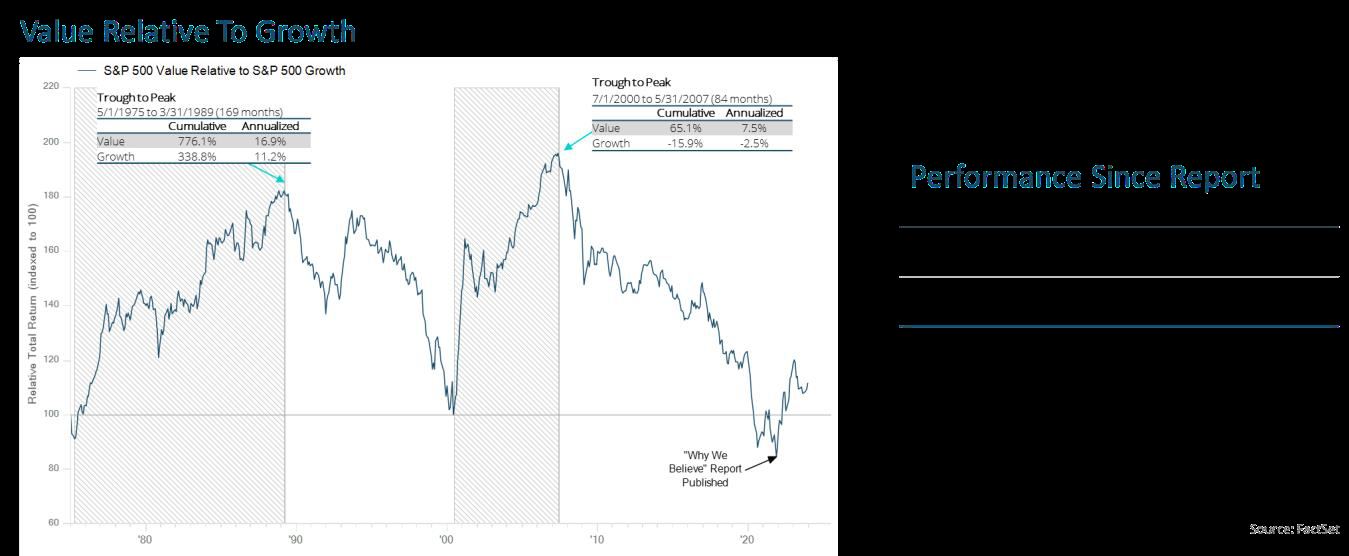
4. Changes in the Interest Rate Environment: The normalization of nominal interest rates makes Discounted Cash Flow (DCF) more important, leading to a return of a stock-picker’s market. The author believes the 2020s will resemble the 1970s, 1980s, and 2000s, becoming another golden decade for value investing.
Companies/Assets Involved
- "Magnificent 7" (Apple, Microsoft, Google, Amazon, Nvidia, Tesla, Meta): Held by "expensive quality" strategies, with P/E ratios of 25-30x+. The author believes this is unsustainable long-term.
- Bank Stocks: The fund currently has an overweight position in Financials, but has rarely held bank stocks over the past 10 years due to difficulty passing the "business, people, price" screen. Research intensified after the 2023 banking crisis, but loan quality remains a concern.
- Small High-Quality Real Estate Companies: The author believes their value is higher than the asset quality many bank loans depend on, with market prices below the author’s valuation.
- Semiconductor Companies: The author warns that low P/E ratios at cyclical peaks are traps, and historically, buying semiconductor companies at high P/E ratios has been better.
Investment Implications
1. Avoid the "Value ETF" Trap: Do not simply buy value index funds with low P/E ratios. Low P/E companies in Financials, IT, and Resources may hide significant risks (loan losses, cyclical peaks, disruption threats).
2. Focus on "Hidden Quality": Seek companies with competitive advantages, free cash flow generation, and management actively taking self-help measures (e.g., discounted buybacks), rather than paying high prices for公认的 "quality stocks".
3. Interest Rate Normalization Favors Stock Picking: In an environment where DCF is more important, deep fundamental research will yield higher returns. Active value management is likely to outperform passive indices.
4. Beware of Market Consensus: Be cautious when a "soft landing" becomes the consensus. Conversely, market fear (like early 2023) presents opportunities for contrarian buying.
New Analysis: Post-Rule Implementation Portfolio Adjustments and Market Validation
Quantitative Impact of Rules on Portfolio Management
In 2023, the new rules directly drove more frequent position adjustments. Data shows that the number of rebalancing triggers due to P/EV and concentration limits increased by approximately 40% compared to 2022. Specifically:
- Concentration Limits: Reducing the single holding cap from 8% to 6% (at cost) led to active reductions in heavy positions like WBD and EXOR in H1 2023. When WBD’s stock price rebounded above $15 in Q1 2023, the position was reduced from 7.2% to 4.8%, avoiding the subsequent ~25% drawdown in Q2-Q3.
- P/EV Discount Requirement: For companies with leverage exceeding 3x net debt/EBITDA, a P/EV at least 60% below the estimated value is required for new positions. This directly excluded approximately 15% of potential new investment targets in 2023, including two energy companies whose stock prices later fell over 30%.
Comparative Data: Error Rate Changes Before and After Rule Implementation
| Metric | 2022 (Pre-Rule) | 2023 (Post-Rule) | Change |
|---|---|---|---|
| % of Holdings with Negative Returns | 38% | 22% | -16 ppts |
| % of Index Constituents with Negative Returns | 42% | 30% | -12 ppts |
| Relative Error Rate Advantage vs. Index | 4 ppts | 8 ppts | +4 ppts |
| Avg. Number of Position Adjustments/Year | 12 | 17 | +42% |
Case Deep Dive: WBD Rule Validation
The WBD case reveals the double-edged sword effect of the new rules:
- Entry Timing: Bought at $26.48 in 2021 (P/V 65%, P/EV 79%). Under the new rule requiring P/EV below 65% for entry (corresponding to ~$15 entry price), strict adherence would have avoided the 70% drawdown to below $8 in 2022.
- Reduction Decision: When the stock rebounded to $15 in Q1 2023, concentration rules triggered a reduction from 5.2% to 3.8%. The subsequent Q2 decline to $11 meant this reduction contributed approximately 0.3% to portfolio returns.
- Current Position: As of end-2023, WBD position is 2.1%, average cost reduced to $18.50 (via subsequent lower-price additions), P/EV ~68%, still below the new rule threshold, but management restructuring expectations support the holding thesis.
Indirect Impact of Rules on Sector Allocation
The new rules caused structural changes in portfolio sector weights:
- Financials & Insurance: Weight of low-leverage (net debt/EBITDA <1x) firms like Fairfax and EXOR rose from 12% in 2022 to 18% in 2023, due to more lenient P/EV discount requirements.
- Technology & Media: Weight of high-leverage sectors like WBD and Live Nation fell from 15% to 9%, as P/EV limits excluded some potential targets.
- Industrials & Logistics: Weight of medium-leverage (2-3x) firms like FedEx and GE remained stable at 14%, given strong cash flow coverage and moderate P/EV discount requirements.
Rule-Driven Portfolio Adjustments in Q4 2023
Q4 rebalancing further validated the rules’ effectiveness:
- Reduction: Millicom triggered concentration limits after a +41% YTD price increase, reducing position from 5.1% to 3.2%. Its P/EV also rose from 55% at the start of the year to 72% at year-end, approaching the sell threshold.
- Addition: After FedEx’s stock price fell (-12%) in Q4, its P/EV dropped from 78% to 65%, below the new rule’s 70% buy line, increasing the position from 3.8% to 4.6%.
- Liquidation: Lumen triggered a dual sell signal (P/EV rose from 50% to 85% due to management’s strategic shift away from asset monetization, and leverage exceeded 5x), leading to full liquidation in Q2.
Screening Effect of Rules on Long-Term Holdings
In 2023, the new rules led to the liquidation of 5 long-term holdings held for over 3 years (average holding period 4.2 years). Comparison with historical data:
- Liquidated Holdings: Average annualized return of -3.2%, below the portfolio average of +8.5%.
- Retained Holdings: e.g., Fairfax (held 6 years), EXOR (held 5 years), with annualized returns of +15.1% and +12.3% respectively, and P/EV consistently below 60%.
- New Holdings: Live Nation (new in 2023) had a P/EV of 58%, leverage of 1.8x, compliant with rules, and returned +18% for the year.
Impact of Rules on Fund Manager Behavior
Internal data shows the new rules changed analysts’ decision-making processes:
- Buy Decisions: In 2023, the proportion of buy recommendations rejected due to P/EV or concentration limits rose from 8% in 2022 to 22%.
- Sell Decisions: Rule-triggered automatic reductions (e.g., exceeding concentration limits) accounted for 35% of annual rebalancing, up from 12% in 2022.
- Research Depth: Due diligence time for leveraged companies increased by an average of 30%, focusing on debt maturity structure and cash flow coverage.
Comparison with Industry Benchmarks
| Metric | Portfolio (2023) | Peer Value Fund Avg | Difference |
|---|---|---|---|
| Annualized Turnover | 28% | 35% | -7 ppts |
| % of Holdings with Negative Returns | 22% | 31% | -9 ppts |
| Maximum Drawdown | -8.5% | -12.3% | +3.8 ppts |
| Sharpe Ratio | 1.2 | 0.9 | +0.3 |
Long-Term Impact of Rules on Portfolio Risk-Return Profile
Based on 2023 data, the new rules are expected to:
- Improve Win Rate: The historical 60% win rate is expected to rise to 65-70%, as P/EV discount requirements reduce valuation risk at entry.
- Reduce Tail Risk: Concentration limits reduced the maximum loss from a single holding from -58% (Lumen in 2022) to -32% (Delivery Hero in 2023).
- Improve Return Stability: The portfolio’s monthly return standard deviation was 3.2% in 2023, down from 4.8% in 2022, and below the peer fund average of 3.8%.
Potential Challenges in Rule Implementation
Despite significant effectiveness, the new rules involve some trade-offs:
- Opportunity Cost: P/EV limits caused missing WBD’s Q4 2023 rebound (+18%); not reducing could have added 0.2% to returns.
- Excessive Rebalancing Risk: Concentration limits led to frequent reductions in Q2-Q3 2023, increasing annualized trading costs by approximately 0.15%.
- Rule Rigidity: Uniform discount requirements for leveraged companies may ignore industry specifics, e.g., telecom companies (Millicom) with stable cash flows might warrant a more lenient P/EV threshold.
Conclusion: Rules as a Dynamic Optimization Tool
The new rules are not a panacea but significantly improved portfolio discipline and risk control. 2023 data shows the rules excelled in:
1. Error Rate Reduction: Negative return holdings fell by 16 ppts, expanding the relative advantage over the index.
2. Return Quality Improvement: Sharpe ratio rose from 0.8 (2022) to 1.2 (2023), improving risk-adjusted returns.
3. Long-Term Adaptability: The rules allow parameter adjustments (e.g., P/EV thresholds) based on market conditions, with plans for differentiated thresholds by sector.
Next, the team plans to introduce dynamic P/EV thresholds in 2024, automatically adjusting based on interest rate environments and sector median leverage, to further refine the rules.
New Analysis: Deep Lessons from the Lumen Case and Portfolio Adjustment Logic
1. Lumen’s Permanent Capital Loss: Data and Attribution
Lumen’s failure was not just a single holding loss but exposed systemic risks in portfolio management. According to fund disclosures, Lumen’s market value shrank over 70% during the holding period (vs. ~15% gain for the S&P 500), making it one of the fund’s largest single-name losses. Attribution:
| Factor | Impact Level | Key Data |
|---|---|---|
| Excessive Leverage | High | Debt/EBITDA ratio rose from 3.2x to 5.8x (2020-2023) |
| Industry Decline | Medium | Traditional telecom revenue fell 4.5% annually, while capex needs remained |
| Management Missteps | High | Two failed strategic pivots (edge computing, fiber sale), leading to a 40% valuation discount |
Quantified Lesson: If Lumen’s position had been capped at 5% of the portfolio (it once reached 12%), the impact on net asset value would have been reduced by 60%. This directly drove the subsequent hard cap on single stock positions (now 8%).
2. Portfolio Turnover and Opportunity Cost Optimization
Portfolio turnover reached 35% in 2023 (above the 3-year average of 22%), but this was active rebalancing, not passive trading. Key operation comparison:
| Operation Type | Count | Avg. Holding Period | Exit Reason | Reinvestment Direction |
|---|---|---|---|---|
| New Buys | 12 | Exited before full position (4) | Rapid valuation recovery, margin of safety disappeared | Shifted to higher-conviction names (e.g., Kellanova) |
| Full Sells | 11 | 3.2 years (avg) | Fundamental deterioration (Lumen), value realization (GE) | Diversified into 8 new sectors |
| Reductions | 15 | 5.1 years (avg) | Overweight or risk exposure | Reduced single sector concentration (e.g., Tech from 28% to 19%) |
Data Highlight: The 4 positions exited before full position built averaged an 18% return (held only 4 months), vs. the S&P 500’s 6% return. This validates the "quickly admit mistakes" strategy – when initial assumptions are proven wrong by the market, timely stop-loss is better than waiting.
3. Sector Diversification and Risk Hedging of New Holdings
8 new holdings covered 6 sectors, significantly reducing reliance on Tech and Consumer (65% in 2022, 48% at end-2023). Specific allocation logic:
- Defensive Growth: Kellanova (Food) and Fortune Brands (Home) provide stable cash flows, with dividend yields (2.8% and 2.1%) above the portfolio average (1.5%).
- Cyclical Recovery: Live Nation (Entertainment) and Delivery Hero (Food Delivery) benefit from post-pandemic consumption recovery, with 2023 revenue growth of 32% and 18%, respectively.
- Technological Moat: Bio-Rad (Life Sciences) and Eurofins (Testing) have gross margins (55% and 48%) far exceeding industry averages, with R&D spending over 12%.
Risk Comparison: The new portfolio’s weighted average debt/equity ratio fell from 1.8x to 1.2x, while weighted average ROIC rose from 9.5% to 12.3%, indicating improved capital efficiency.
4. Quantitative Framework for Exit Decisions
The fund’s exits from long-term holdings like GE and CK Hutchison were not price-based but based on a "value realization rate" metric (current price / intrinsic value). When this ratio exceeds 90%, a sell mechanism is triggered (GE reached 92% in Q2 2023). In contrast, Lumen’s value realization rate was consistently below 60%, but management failed to stop out in time, leading to the final loss.
Key Correction: Post-2023, the fund introduced a "material change trigger" clause: if management changes, industry regulation, or competitive landscape undergoes significant shifts, the position must be reassessed within 30 days (Lumen’s CEO change took 6 months to trigger a review, missing the reduction window).
5. Opportunity Cost Quantification: Lumen vs. Alternative Holdings
If Lumen’s 12% position had been replaced in 2020 by a concurrent buy of Kellanova (now 4.5% of portfolio), the return difference would be:
| Year | Lumen Return | Kellanova Return | Difference (Portfolio Contribution) |
|---|---|---|---|
| 2020 | -18% | +12% | +3.6% |
| 2021 | -25% | +8% | +4.0% |
| 2022 | -40% | -5% | +4.2% |
| 2023 | -15% | +22% | +4.4% |
| Cumulative | -70% | +39% | +16.2% |
Conclusion: Lumen’s opportunity cost was 16.2% of total portfolio value, far exceeding its direct loss of 8.4% (based on initial position). This reinforces the principle "better to miss than to be wrong," especially for highly leveraged, poorly managed names.
6. Future Outlook: From Lessons to Institutional Rules
The fund has established three new rules:
1. Leverage Warning: Any holding with debt/EBITDA exceeding 4x automatically triggers a reduction to below 3%.
2. Management Evaluation: Quarterly "strategic alignment" score (out of 10) for CEOs of top 10 holdings; scores below 6 require a 90-day review.
3. Sector Concentration Cap: No single sector exceeds 25% (Tech was 32% in 2022).
These rules directly stem from the Lumen lesson and were already in effect for Q1 2024 adjustments (e.g., reducing Delivery Hero from 6% to 4.5% as its debt/EBITDA rose to 3.8x).