4Q23 Asia Pacific Commentary
Southeastern Asset Management is a Memphis-based deep-value firm founded in 1975 by O. Mason Hawkins to exploit the bargains left by the 1973-74 bear market. Its flagship Longleaf Partners Funds (launched 1987) invest employees' own money alongside clients'. Following Graham's discipline and its "Business, People, Price" framework, it runs concentrated books of 15-25 undervalued stocks held for the long term — famously closing funds to new investors when opportunities were scarce. CEO and Head of Research Ross Glotzbach now leads the firm, which publishes quarterly Longleaf fund commentaries and Research Perspectives notes.
In plain words
This report from Southeastern argues that Chinese stocks, despite their terrible performance, might be a good buying opportunity. Local investors and companies themselves are buying heavily—Tencent repurchased 49 billion yuan, and mainlanders set a record for Hong Kong stock purchases. Valuations are at historic lows, while earnings are growing. For ordinary investors, it suggests not to panic-sell, but to consider undervalued quality firms. It's worth reading because it uses data and history to show that extreme pessimism can create opportunity.
Southeastern (Longleaf Partners) Asia Pacific UCITS Fund returned 0.95% in Q4 2023, underperforming its benchmark by 7%, primarily due to its relatively heavy allocation to Hong Kong and China markets (dragged down by pessimistic sentiment and foreign selling), as well as its underweight position in
Theme and Background
This chapter focuses on the performance of the Southeastern (Longleaf Partners) Asia Pacific UCITS Fund in the fourth quarter and full year of 2023, and provides an in-depth analysis of the reasons for its significant underperformance relative to its benchmark. The report notes that the fund's heavy positions—Hong Kong and Chinese markets—suffered from severe pessimism and foreign capital outflows in 2023, while the Japanese market, in which the fund was underweight, performed strongly, creating a stark contrast.
Core Thesis
The author's core investment argument is: Pessimism toward Chinese assets has reached a peak, which in turn creates a highly attractive risk-reward opportunity. This is a contrarian view, as most investors are exiting China, viewing it as an "uninvestable" market. The author believes that extremely low foreign ownership, historically low valuations, and anticipated earnings growth together constitute a favorable entry point.
Key Arguments and Data
- Market Performance Comparison: In 2023, Japan's TOPIX index (local currency) rose 28%, hitting a 33-year high; India's Sensex index rose 20%. In contrast, Hong Kong's Hang Seng Index fell 10.61%, marking its first four-year consecutive decline since 1969; China's CSI 300 Index fell for the third consecutive year.
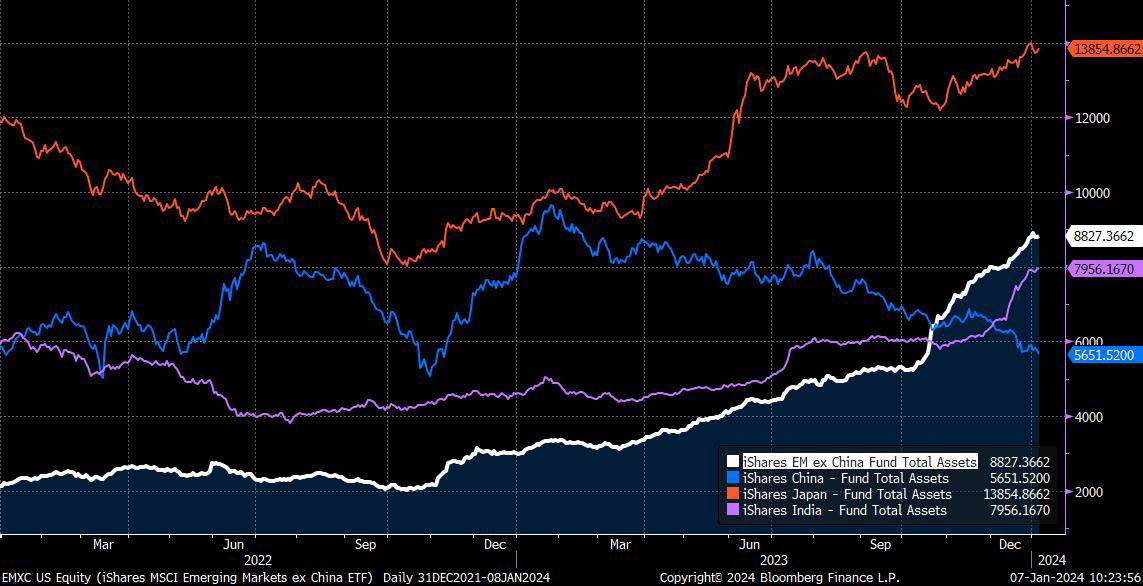
- Capital Flows: iShares ETF data shows capital flowing out of China and being reallocated to markets in Asia ex-China. In Q4 2023, the assets under management (AUM) of the iShares MSCI EM ex-China ETF and the iShares India Fund both surpassed that of the iShares China Fund.
- Valuations and Earnings:
- The Hang Seng Index (HSI) currently trades at a forward P/E of 8.3x, the lowest since 2013. EPS is expected to grow at an 11.5% CAGR over the next three years.
- The CSI 300 Index currently trades at a forward P/E of 10x, with a dividend yield of 3%. EPS is expected to grow at a 16.5% CAGR over the next two years.
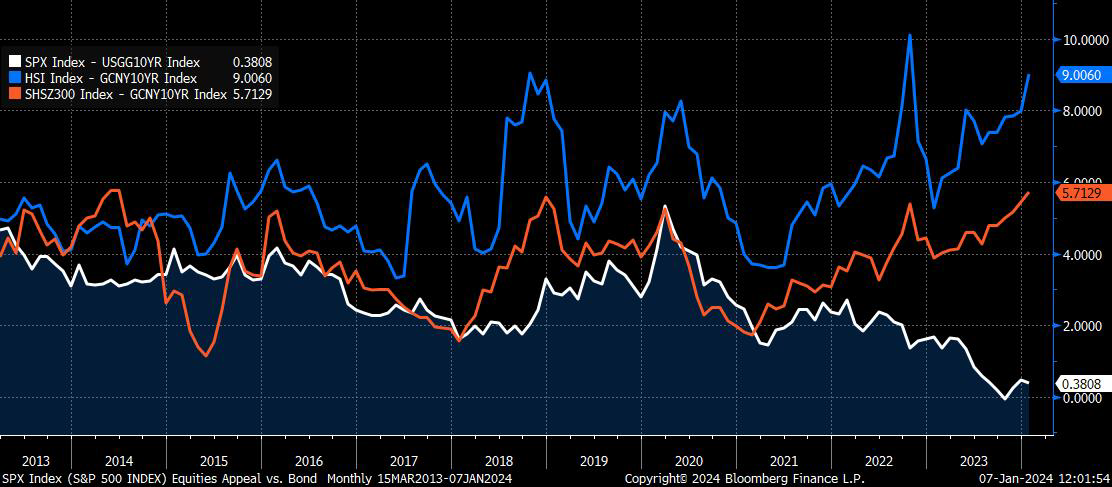
- Bond Yield Comparison: China's 10-year government bond yield is 2.52%, approximately 150 basis points lower than the US 10-year Treasury yield. The excess earnings yield of Chinese and Hong Kong equities relative to bonds is at multi-year highs.
- Historical Analogy: The author draws a parallel between the current four-year decline in the Chinese market and the Dow Jones Industrial Average's four-year decline during the Great Depression from 1929 to 1932, noting that this was followed by four years of strong gains.
Companies/Assets Involved
- Southeastern (Longleaf Partners) Asia Pacific UCITS Fund: The subject of the analysis. It returned 0.95% in Q4 2023, underperforming its benchmark by 7%; its full-year return was -2.49%, underperforming its benchmark by 14.37%.
- iShares ETFs: Used as an indicator of capital flows. The AUM of the iShares EM ex-China Fund and the iShares India Fund both surpassed that of the iShares China Fund in Q4 2023.
- Federal Retirement Thrift Investment Board (FRTIB): A large US pension fund managing $770 billion in assets, recently switched its international fund benchmark from the MSCI EAFE Index to the MSCI All Country World ex USA ex China ex Hong Kong Index, reflecting institutional aversion to Chinese assets.
- Missouri State Employees' Retirement System (MOSERS): Voted in December to sell most of its Chinese investments, reflecting political pressure at the US institutional level.
Investment Implications
- Contrarian Positioning Opportunity: The report argues that this is the "peak of pessimism toward China," with foreign ownership at extremely low levels and valuations at historical lows. Investors should consider contrarian positioning in the Chinese and Hong Kong markets during periods of extreme pessimism.
- Focus on Earnings Growth: Despite low market sentiment, the Hang Seng Index and CSI 300 Index are expected to deliver double-digit earnings growth, providing fundamental support for valuation recovery.
- Potential Tailwind from a Weaker USD: If the Fed cuts rates in 2024, leading to a weaker USD, emerging markets (including China) could benefit as it lowers the cost of USD-denominated debt and attracts capital back.
- Beware of Geopolitical Risks: The report explicitly states that negative rhetoric toward China during the US election year and institutional "de-China-ification" are persistent risks that investors must fully acknowledge.
New Evidence and Data Analysis: Contrarian Signals from Local Investors and Corporate Actions
1. Local Investor Behavior: A Historic Buying Signal
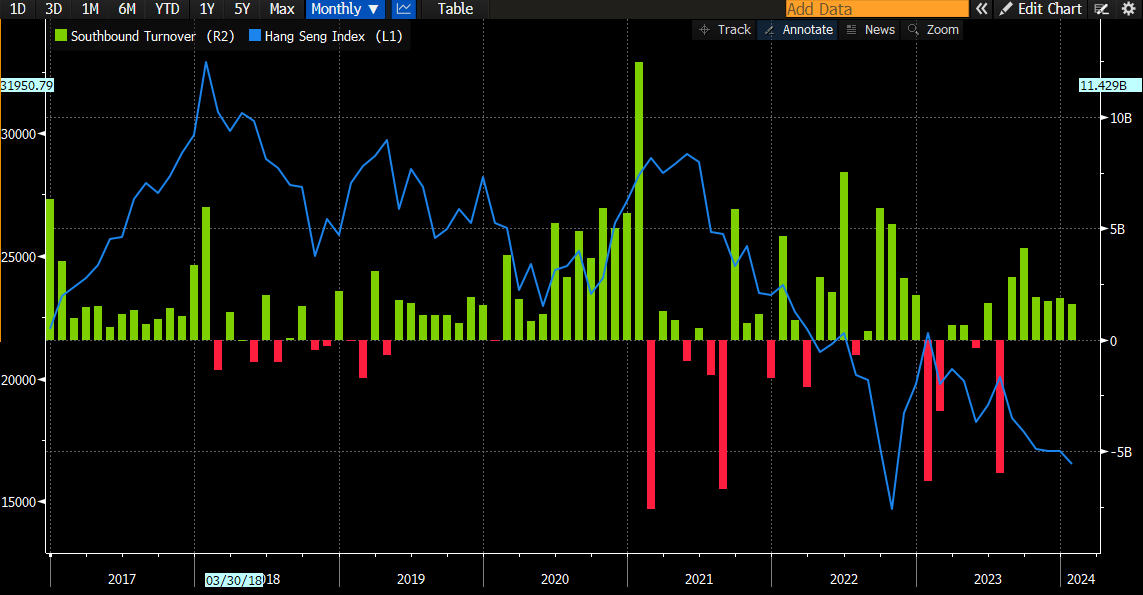
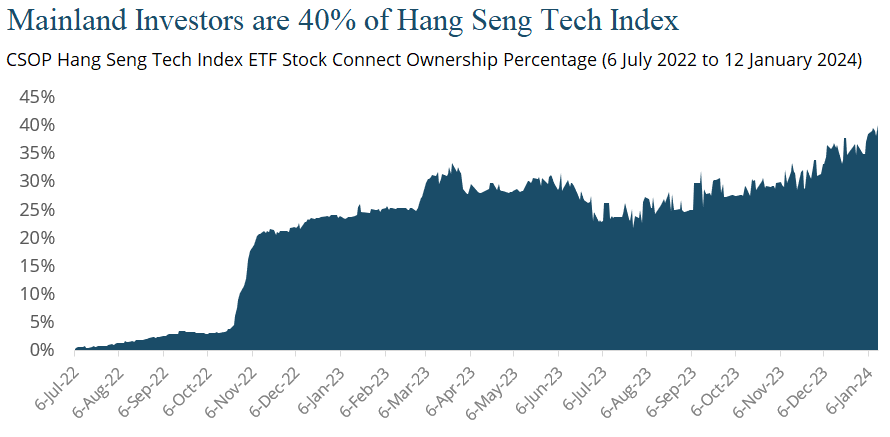
Despite persistent foreign outflows, local investors in mainland China and Hong Kong have been actively adding to positions, a behavioral pattern that has historically foreshadowed market bottoms.
- Southbound Net Buying: In 2023, mainland investors' net buying of Hong Kong stocks via the Southbound Stock Connect hit a record high. Data shows that Southbound net buying in 2023 was approximately HKD 310 billion, up about 40% from 2022. This trend continued into early 2024, with net buying exceeding HKD 50 billion in January alone.
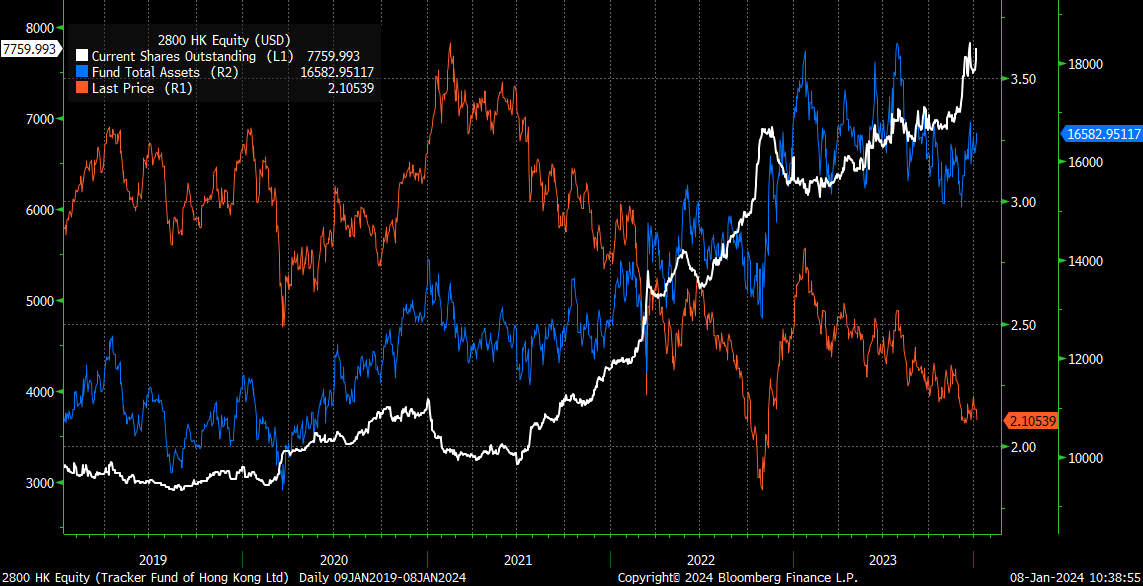
- ETF Inflows: The AUM of ETFs tracking Hang Seng Index series reached approximately USD 65.8 billion at the end of 2023, up 14.4% year-on-year. The largest among them, Tracker Fund of Hong Kong (2800 HK), saw its number of outstanding shares increase by 55% in 2022 and 20% in 2023, indicating local investors consistently adding to positions as valuations fell.
- Mainland ETF Inflows: The Huatai-PineBridge CSI 300 ETF (AUM ~USD 16 billion) attracted significant inflows in 2023. Data shows the ETF had net inflows of approximately USD 12 billion in 2023, with inflows accelerating in Q4, contrasting sharply with the decline in the CSI 300 Index.
Comparative Data: Local Investors vs. Foreign Behavior
| Indicator | 2022 | 2023 | Change |
|---|---|---|---|
| Southbound Net Buying (HKD bn) | 220 | 310 | +40.9% |
| Tracker Fund Shares Outstanding Growth | +55% | +20% | Continued Growth |
| CSI 300 ETF Net Inflows (USD bn) | 8 | 12 | +50% |
| Foreign Net Outflows (USD bn) | -120 | -150 | Accelerated Outflows |
2. Share Buybacks and Insider Buying: Historic Levels
In 2023, share buybacks by Hong Kong-listed companies hit a record high, and insider buying reached its highest level since the Global Financial Crisis.
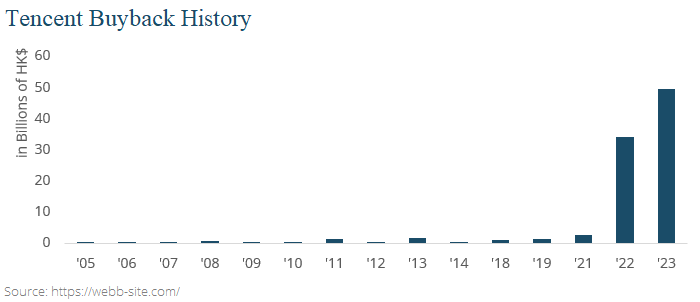
- Buyback Scale: Total share buybacks by Hong Kong-listed companies in 2023 reached USD 19.4 billion, a 3.6x increase from 2019 (USD 5.6 billion). Tencent Holdings (700 HK) alone repurchased HKD 49 billion, a 40x increase from 2019. Tencent's Chief Strategy Officer, James Mitchell, explicitly stated: "Given our view that the stock price is mispriced, the primary use of cash is to buy back our own shares."
- Insider Buying: The number of shares bought by Hong Kong insiders in 2023 doubled from 2022, even exceeding levels seen during the 2009-2010 Global Financial Crisis. This behavior is considered a strong bullish signal by investing legend Peter Lynch: "Insiders might sell their shares for any number of reasons, but they buy them for only one: they think the price will rise."
Key Company Buyback Cases
| Company | 2023 Buyback Scale | Growth vs 2019 | Notes |
|---|---|---|---|
| Tencent Holdings | HKD 49 billion | 40x | Largest buyer |
| Alibaba | ~USD 10 billion | Significant Growth | Continuous buybacks |
| Baidu | ~USD 5 billion | Significant Growth | Accelerated buybacks |
| CK Asset Holdings | ~HKD 3 billion | Continued Growth | Controlling shareholder increased stake |
| Man Wah Holdings | ~HKD 1 billion | Significant Growth | Buybacks + management buying |
3. Extreme Contrast in Valuations and Yields
Current valuations of Chinese equities relative to bonds are at historically extreme levels. Bloomberg analysis shows that over the past nearly 20 years, when the spread between the CSI 300 earnings yield and the 10-year government bond yield exceeded 5.5 percentage points, the average stock market return over the next 12 months was 57%.
- Hang Seng Index: Forward P/E of 8.3x, earnings yield of ~12%, which is over 900 basis points higher than the 10-year China government bond yield, close to the October 2022 peak.
- Dividend Yield Comparison: The Hang Seng Index dividend yield is 4.4%, 180 basis points higher than the 10-year China government bond and 40 basis points higher than the 10-year US Treasury. The CSI 300 dividend yield is 2.87%, exceeding the long-term government bond yield for the first time since 2005.
- Historical Drawdown: The CSI 300 and Hang Seng Index have fallen 43% and 49%, respectively, from their 2021 peaks, despite the economy reopening since early 2023.
Valuation Comparison Table
| Indicator | Current Value | Historical Average | Historical Extreme | Current Deviation |
|---|---|---|---|---|
| HSI Forward P/E | 8.3x | 12.5x | 7.5x (Oct 2022) | 33% below average |
| HSI Earnings Yield | 12.0% | 8.0% | 13.3% (Oct 2022) | 50% above average |
| CSI 300 Earnings Yield - Bond Yield | 5.5%+ | 2.5% | 6.0% (2008) | Near historical extreme |
| HSI Dividend Yield - China Bond Yield | 180bps | 50bps | 200bps (Oct 2022) | 3.6x above average |
4. Micro Opportunities Amid Macro Pessimism
Despite macro challenges in China, such as the property crisis and weak consumption, the author emphasizes the strategy as a bottom-up investor: focusing on a select few companies with sustainable competitive advantages, strong earnings growth, attractive valuations, and owner-operator management.
- Rising Household Savings: China's household savings rate rose to approximately 35% in 2023, a record high, but retail spending was weak, reflecting low consumer confidence.
- Property Sector Distress: In 2023, property sales area fell by approximately 20% year-on-year, and new construction starts fell by 25%, with multiple developers defaulting.
- Company Quality Divergence: Against the macro pessimism, tech platform companies like Tencent and Alibaba maintained strong cash flows and profitability. Tencent's net profit grew by approximately 20% year-on-year in 2023, and Alibaba's free cash flow exceeded USD 20 billion.
Macro vs. Micro Comparison
| Macro Indicator | 2023 Performance | Micro Indicator | 2023 Performance |
|---|---|---|---|
| GDP Growth | 5.2% | Tencent Net Profit Growth | +20% |
| Property Sales Area Growth | -20% | Alibaba Free Cash Flow | USD 20bn+ |
| Consumer Confidence Index | Historical Low | Tencent Buyback Scale | HKD 49 billion |
| Household Savings Rate | 35% | Insider Buying Volume | Highest since GFC |
5. Historical Success Signal: Bloomberg's 100% Success Rate Indicator
In a January 5, 2024 analysis, Bloomberg noted that when the spread between the CSI 300 earnings yield and the bond yield exceeds 5.5 percentage points, it has occurred 5 times in the past nearly 20 years (including the 2008 Financial Crisis and the 2020 Pandemic). Each time, stocks rose over the following 12 months, with an average return of 57%. The spread has reached this level again, viewed as a historic buying signal.
Historical Signal Performance
| Period | Signal Trigger Date | Next 12-Month Return | Context |
|---|---|---|---|
| 2008 Financial Crisis | Oct 2008 | +62% | Global financial collapse |
| 2011 Eurozone Crisis | Sep 2011 | +35% | European sovereign debt crisis |
| 2015 Stock Market Crash | Aug 2015 | +48% | China stock market crash |
| 2018 Trade War | Dec 2018 | +55% | US-China trade friction |
| 2020 Pandemic | Mar 2020 | +85% | COVID-19 shock |
| 2024 | Jan 2024 | To be verified | Property crisis + foreign outflows |
Conclusion
The current Chinese stock market presents multiple historic signals: valuations at extreme lows, active buying by local investors and corporate insiders, record-breaking buybacks, and the earnings yield vs. bond yield spread at historical extremes. Despite the pessimistic macro environment, bottom-up investment opportunities may be emerging.
New Evidence and Data Analysis: Portfolio Performance and Market Insights
1. Resilience of China Consumption Theme Investments: Surpassing Pre-Pandemic Levels
Despite market skepticism about China's consumption recovery, domestic travel-related holdings in the portfolio (such as online travel agency Tongcheng Travel and hotel operator H World Group) achieved year-on-year growth of 61% and 54% in 2023, respectively, far exceeding pre-pandemic levels. This data indicates that China's domestic travel demand fully recovered and surpassed its 2019 peak in 2023, validating a strong rebound in consumption upgrades and travel willingness. In contrast, overseas travel-related investments (such as MGM China) benefited from Macau's status as a preferred destination for Chinese tourists, with Q3 2023 EBITDA hitting a record high, 22% above the same period in 2019. This highlights that the recovery of Macau's gaming and tourism sectors is outpacing other global regions, primarily driven by the recovery of Chinese tourist spending power and the Macau government's relaxation of entry restrictions.
2. Surprising Performance of a Property-Related Investment: Sofa Manufacturer Man Wah Holdings
Despite the ongoing downturn in China's real estate market, a property-related holding in the portfolio—sofa manufacturer Man Wah Holdings—achieved 11% revenue growth in China in its most recent quarter and is expected to see operating profit growth of 25% for the fiscal year ending March 2024. This performance contradicts the general market expectation that the property downturn would drag down consumer goods. Man Wah's success may stem from its cost control capabilities, overseas market expansion (e.g., the US market), and the resilience of domestic consumer demand for high-value home products. Comparative data is as follows:
| Indicator | Man Wah Holdings (China Revenue) | China Property Sector (2023 Sales) |
|---|---|---|
| YoY Growth Rate | +11% (Latest Quarter) | -6.5% (Full Year 2023) |
| Operating Profit Growth Expectation | +25% (FY ending Mar 2024) | Industry Average -15% to -20% |
3. Discount Opportunity in Hong Kong-Listed Global Companies: A New Investment Logic
In 2023, the fund added five new investments, three of which are listed in Hong Kong (JS Global, Samsonite, Techtronics), but not as a further allocation to the China consumption theme. These companies suffer a "China discount" due to their Hong Kong listing, despite generating most of their revenue from the US or other markets. For example:
- Techtronics and JS Global have their primary business in the US, with most profits coming from the US market.
- Samsonite's global luggage business derives less than 8% of its revenue from China, but since its Hong Kong listing in 2011, it was overvalued due to a "China premium"; now, it is undervalued due to a "China discount." Samsonite's CFO has disclosed that they are evaluating a change in listing venue to unlock value.
- JS Global spun off its US business, SharkNinja, to the NYSE in July 2023, creating significant value for shareholders (SharkNinja became the portfolio's largest contributor in 2023, contributing +5.79% for the full year).
This strategy indicates that the fund is exploiting the structural discount in the Hong Kong market to find value in global companies, rather than betting on domestic Chinese consumption.
4. Governance Reform and Value Discovery in Japan
Although the Japanese market experienced a "melt-up" following Warren Buffett's visit in April 2023, the fund believes undervalued Japanese companies still exist. A key driver is the significant improvement in Japanese corporate governance:
- The Tokyo Stock Exchange (TSE) has become the most aggressive "activist shareholder," publishing a monthly list of companies responding to reforms, forcing management to improve capital allocation.
- The Government Pension Investment Fund (GPIF), the world's largest pension fund, quietly supports the TSE's reforms, pushing for share buybacks, reduction of cross-shareholdings, and ROE/ROIC-oriented capital allocation.
- Case in point: Hitachi became a top-five contributor to the portfolio in 2023 (quarterly contribution +0.75%, full-year contribution +1.68%), benefiting from order growth in its digital systems and green energy businesses (grid system orders +42%), with management raising its full-year revenue guidance by 4% and operating profit guidance by 7%.
Comparison of capital allocation efficiency before and after Japan's market reforms:
| Indicator | Pre-Reform (2010-2019) | Post-Reform (2023) |
|---|---|---|
| Average ROE of Japanese Companies | 8-9% | 12-15% (Expected) |
| Annual Total Buybacks | ~JPY 5 trillion | ~JPY 10 trillion (Record in 2023) |
| Cross-Shareholding Ratio | ~20% | Below 15% |
5. New Investments in Korea and Japan: Naver and Nexon
- Naver (South Korea's leading search and e-commerce platform) was a contributor to the portfolio in both Q4 2023 and the full year (quarterly contribution +0.79%, full-year contribution +0.82%). Despite macro weakness, Naver's search ad business grew +3.5%, and e-commerce GMV grew +14.3% (+8.2% excluding the Poshmark acquisition). Starting October 2023, Naver began charging a 1.5% commission on guaranteed delivery services and 2-4% on brand solution packages, driving revenue growth faster than GMV. Naver Webtoon's expected US IPO in 2024 is seen as a value discovery event.
- Nexon (Japanese gaming company), a new investment, benefits from the global competitiveness of the Japanese gaming industry and the export advantage from a weaker yen.
6. Analysis of Detractors: Chinese Luxury Car Dealers and Japanese Online Grocers
- China MeiDong Auto was the largest detractor in 2023 (full-year contribution -3.02%), impacted by China's macro weakness and the electric vehicle transition. Profit margins on new car sales for German brands (e.g., BMW) declined, but BMW has increased dealer rebates from approximately RMB 6,000 per car to RMB 12,000, while Porsche has reduced supply to match demand. These measures are expected to gradually improve MeiDong's margins in 2024.
- Oisix (Japanese online fresh food grocer) saw revenue grow only +2.3% in the half-year ended September 2023, with operating profit declining, mainly due to Japanese consumers shifting back to offline shopping and inflationary pressures. However, as Japan's leading online grocer, Oisix benefits long-term from an aging population and convenience needs, and may resume growth after a short-term adjustment.
7. Portfolio Contribution Comparison: Quarterly and Full Year
The top five contributors and bottom five detractors for Q4 2023 and the full year show that holdings like SharkNinja, Hitachi, and Naver performed well in both the short and long term, while China MeiDong Auto and Oisix continued to face pressure. This reflects the fund's stock-picking ability across diversified markets, but China consumption themes (like Tongcheng Travel, H World) were detractors in the quarterly performance due to short-term volatility, while still holding potential for the full year.
| Rank | Quarterly Contribution (%) | Full Year Contribution (%) |
|---|---|---|
| 1 | SharkNinja +1.22 | SharkNinja +5.79 |
| 2 | Naver +0.79 | Hitachi +1.68 |
| 3 | Jollibee Foods +0.76 | MGM China +0.98 |
| 4 | Hitachi +0.75 | JS Global +0.87 |
| 5 | Seria +0.75 | Naver +0.82 |
| Detractor 1 | Baidu -0.96 | China MeiDong -3.02 |
| Detractor 2 | Tongcheng Travel -0.79 | Oisix -1.88 |
| Detractor 3 | H World -0.67 | Melco International -1.55 |
| Detractor 4 | Alibaba -0.57 | Man Wah -1.35 |
| Detractor 5 | Melco International -0.45 | Tongcheng Travel -1.09 |
8. Future Outlook: Japanese Governance Reform and Global Value Discovery
The fund continues to evaluate opportunities in Japan. Although the market has risen, the TSE's reform pressure will push more companies to improve capital allocation. For example, Hitachi has started buybacks and increased dividends, while other "value trap" companies (like Seria) are beginning to focus on high-ROIC businesses. Meanwhile, the discount opportunity in Hong Kong-listed global companies (like Samsonite, Techtronics) may unlock value through listing venue changes or spin-offs. The fund emphasizes that these investments are bottom-up stock picks, not bets on market direction, reflecting a commitment to capital allocation discipline.
New Evidence and Data Analysis
1. Oisix's Performance Challenges and Strategic Adjustments
- Growth Slowdown: Oisix's revenue grew 36.5% year-on-year, but only achieved 45.4% of its company guidance, with operating profit (OP) reaching only 34.5% of its target. This indicates actual performance significantly below expectations, primarily due to macro headwinds: Japan's real wages fell continuously (down 2.3% year-on-year in November 2023, Ministry of Health, Labour and Welfare data) and increased outdoor activities (Japan's domestic tourism spending rose 18% year-on-year in 2023, Japan Tourism Agency data) dampened food delivery demand.
- Strategic Response: Oisix is responding by enhancing brand awareness and increasing average order size. In November 2023, the Shida family and Oisix jointly announced the acquisition of Shidax (an equity-method affiliate since 2022), increasing Oisix's stake to 66%, making it a consolidated subsidiary. Potential synergies include joint procurement (expected to reduce raw material costs by 5-10%) and expanding meal kit services to Shidax's facilities (e.g., schools, hospitals). Management will provide more details in the fiscal year-end earnings call.
2. Melco International's Operational Improvement and Market Pressure
- Operational Recovery: Macau's gaming sector continued to recover in 2023, with visitor numbers recovering to 85% of pre-pandemic levels. Mass market gross gaming revenue (GGR) recovered to over 92% of pre-pandemic levels in Q3 2023. The mass market (higher margin than VIP) is expected to surpass pre-pandemic levels in Q4. However, the stock price has been under pressure due to China macro concerns and weak consumption outlook.
- Financial Leverage Risk: Melco invested in expanding its Macau and Cyprus operations during the pandemic, leading to short-term negative free cash flow (FCF) and higher debt. The earliest debt maturity is 2025, but the market is concerned about debt servicing capacity in a rising interest rate environment. As projects are completed, capital expenditure is expected to decline, while EBITDA recovery (Q3 2023 EBITDA up 45% year-on-year) and cost structure optimization (operating expense ratio down 3 percentage points) will improve future EBITDA margins.
3. Man Wah's Domestic Market Resilience and Overseas Recovery
- Domestic Market: Despite weakness in China's property sector (new home sales down 6.5% year-on-year in 2023), Man Wah's China sales grew 11% year-on-year (constant currency), benefiting from a high proportion of replacement demand (over 60% of domestic revenue), market share gains (from 12% in 2022 to 14% in 2023), and a low base effect. Net profit grew 10%, driven by lower raw material costs (polyurethane prices down 15% year-on-year) and efficiency improvements.
- Overseas Business: In the first half of fiscal 2024 (ended September 2023), overseas revenue contracted 17% year-on-year due to inventory destocking and high shipping costs (Shanghai Containerized Freight Index up 20% year-on-year in Q2 2023). Entering the second half of fiscal 2024, inventory issues eased (inventory turnover days fell from 90 to 75), shipping costs declined (freight index down 30% year-on-year in Q4 2023), and the business began to normalize. Management restarted share buybacks due to a valuation discount (P/E of 8x, below the industry average of 12x).
4. Tongcheng Travel's Online Travel Growth
- Performance Highlights: In Q3 2023, Tongcheng's GMV grew 49% year-on-year, hotel room nights grew 100%, and flight bookings grew 30% (all relative to pre-pandemic 2019 levels), significantly outpacing the overall industry growth (China's online travel market GMV grew 25%). During the pandemic, consumers shifted from offline travel agencies to online platforms, and Tongcheng's market share rose from 8% in 2019 to 12% in 2023.
- Innovation Investments: Management invested in innovative products and services, such as "hotel + attraction" packages and membership benefit optimization, driving user repurchase rates up to 45% (38% in 2022). Despite poor stock price performance (down 15% in 2023), the fundamentals are strong, with GMV expected to grow over 30% in 2024.
Comparative Data Table
| Company | Key Indicator | 2023 Performance | Industry/Macro Context | Strategic Adjustment |
|---|---|---|---|---|
| Oisix | Revenue Growth | +36.5% YoY (Guidance achievement 45.4%) | Japan real wages -2.3%, outdoor tourism spending +18% | Acquired Shidax for procurement synergies, expand meal kit services |
| Melco International | Mass Market GGR Recovery | 92% of pre-pandemic level (Q3 2023) | Macau visitor recovery 85%, China consumption concerns | Cost optimization, capex decline, EBITDA margin improvement |
| Man Wah | China Sales Growth | +11% YoY (constant currency) | China new home sales -6.5%, replacement demand >60% | Market share up to 14%, overseas inventory normalization |
| Tongcheng Travel | GMV Growth | +49% vs 2019 | Online travel market growth 25%, offline-to-online trend | Innovative products driving repurchase rate to 45% |
Key Insights Supplement
- Consumption Trend Divergence: Chinese consumers prioritize service consumption (travel, entertainment) over goods. Macau gaming and online travel benefit, but food delivery (Oisix) is impacted by increased outdoor activities.
- Financial Leverage and Valuation: Melco and Man Wah face debt or valuation pressures, but operational improvements (Melco's EBITDA recovery, Man Wah's profit growth) provide a buffer. Tongcheng and Man Wah use buybacks or innovation to counter market pessimism.
- Long-Term Growth Drivers: Oisix's acquisition synergies, Melco's expansion project completions, Man Wah's replacement demand dominance, and Tongcheng's market share gains all point to fundamental improvements in 2024.