2Q25 Asia Pacific Commentary
Southeastern Asset Management is a Memphis-based deep-value firm founded in 1975 by O. Mason Hawkins to exploit the bargains left by the 1973-74 bear market. Its flagship Longleaf Partners Funds (launched 1987) invest employees' own money alongside clients'. Following Graham's discipline and its "Business, People, Price" framework, it runs concentrated books of 15-25 undervalued stocks held for the long term — famously closing funds to new investors when opportunities were scarce. CEO and Head of Research Ross Glotzbach now leads the firm, which publishes quarterly Longleaf fund commentaries and Research Perspectives notes.
In plain words
This is a Q2 2025 review of Southeastern's Asia-Pacific fund. The fund made money (+4.9%) but lagged the market (+12.1%) because it didn't own the hot Korean and Taiwan tech stocks, and held too much of a Japanese entertainment company that fell 30%. For ordinary investors, this shows: short-term rankings don't tell the full story. The fund is buying companies like ACM Research (a US chip equipment maker benefiting from China's local production push) and Kaspi (Kazakhstan's version of Alipay, with extremely sticky users). Also, a weakening dollar could boost Asian assets, and tech stocks look risky after a big rally. Worth a read because it explains why underperformance doesn't mean the strategy is broken.
Southeastern (Longleaf Partners) Asia Pacific UCITS Fund Q2 2025 Report The fund delivered a net return of +4.9% in Q2 2025, underperforming the FTSE Asia Pacific Index (+12.1%) by 7.2 percentage points. Key takeaways: Despite positive absolute returns, the relative underperformance was primarily dr
Theme and Background
This chapter reviews the performance and market environment of the Southeastern (Longleaf Partners) Asia Pacific UCITS Fund in the second quarter of 2025. The report notes that while the fund achieved a positive absolute return (+4.9%), it significantly underperformed its benchmark (FTSE Asia Pacific Index +12.1%), primarily due to an underweight in technology-heavy markets such as South Korea and Taiwan, an overweight in underperforming consumer discretionary stocks, and a drag from a higher cash position. In terms of market context, the early April U.S. "Liberation Day" tariff shock triggered a sharp sell-off, followed by a V-shaped rebound driven by a U.S.-China trade truce, a weaker U.S. dollar, and the AI theme.
Core Views
- Fund underperformed in relative terms but achieved positive absolute returns: The author believes the performance gap primarily stems from structural factors (underweight in technology-heavy markets, overweight in weak sectors) rather than a complete failure of stock selection.
- Asia's structural advantages remain solid: Despite ongoing macro uncertainties (geopolitics, tariff pause expirations), Asia's advantages in key technology areas, domestic demand, and policy support remain unchanged. A bottom-up, active investment approach focused on high-quality companies is necessary.
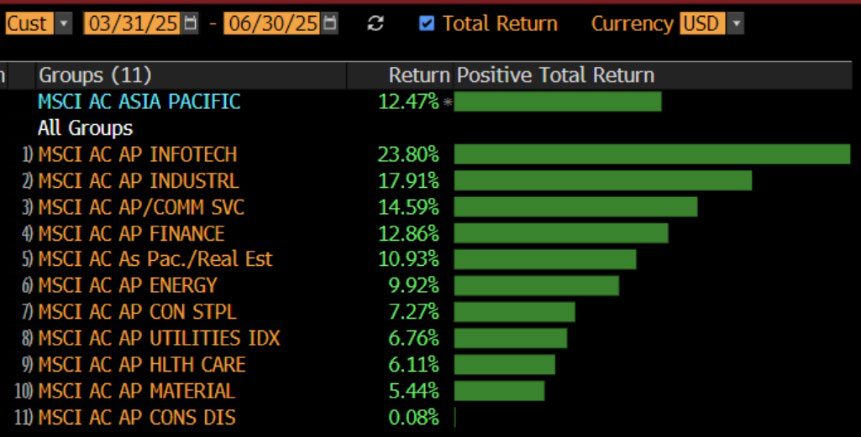
- The tech sector rebound was the most prominent narrative of Q2: After falling in Q1, Asian tech stocks returned approximately +24% in Q2, driven by AI breakthroughs, strong semiconductor earnings, and confidence in AI demand. However, the author implies that the benchmark's performance is overly reliant on a single high-momentum sector (e.g., TSMC, SK Hynix, Samsung Electronics).
Key Arguments and Data
- Fund vs. Benchmark Performance:
| Metric | Fund (I Class USD) | FTSE Asia Pacific Index | Relative Return |
|---|---|---|---|
| 2025 Q2 | +4.91% | +12.11% | -7.20% |
| 2025 YTD | +9.48% | +13.05% | -3.57% |
| 1 Year | +18.05% | +15.11% | +2.94% |
| 3 Year | +7.27% | +11.46% | -4.19% |
| 5 Year | +3.16% | +8.02% | -4.86% |
| 10 Year | +3.39% | +5.93% | -2.54% |
- Regional Market Performance (USD):
| Market | Q2 Return | 1H Return |
|---|---|---|
| South Korea KOSPI | +35.1% | +41% |
| Taiwan TWSE | +23.2% | — |
| Hong Kong HSI | +4.8% | +21.4% |
| Japan TPX | +11.7% | — |
| Thailand SET | -0.1% | — |
| Philippines PCOMP | +5.8% | — |
| Indonesia JCI | +12.4% | — |
- Macro and Flow Data:
- The U.S. Dollar Index fell 7% in Q2 and over 10% YTD, significantly boosting returns for Asian and non-U.S. markets.
- The MSCI All Country World ex USA Index returned +12.3% in Q2, while the MSCI Asia Pacific Index returned +12.5%.
- Hong Kong market 1H IPO fundraising reached $14 billion, seven times the amount in the same period last year, surpassing Nasdaq and the NYSE.
- Hong Kong Exchanges and Clearing's 1H average daily turnover was $30.6 billion, up 118% year-over-year.
- China southbound capital inflows and turnover both hit record highs.
- Fund Actions:
- In mid-April, the fund bought U.S. company ACM Research, capitalizing on volatility in the semiconductor equipment sector.
- Sold Samsonite (due to tariff risk), Naver (Q2 return +37%), and Baidu (due to the impact of free Chinese generative AI competition on its search business).
- The cash position was high because the prices of some investment targets rose rapidly during the V-shaped rebound, reducing the margin of safety.
Companies/Assets Involved
- ACM Research (U.S. semiconductor equipment company): The fund bought in mid-April, capitalizing on volatility from tariffs and the chip war.
- Genda (Japanese entertainment/karaoke operator): An overweight consumer discretionary stock that returned -30% in Q2, a major drag on absolute and relative performance.
- Samsonite (luggage manufacturer): Sold due to tariff risk.
- Naver (South Korean search/e-commerce platform): Returned +37% in Q2; the fund sold during the rebound.
- Baidu (Chinese search/cloud platform): Sold due to the impact of free Chinese generative AI competition on its search business.
- TSMC, SK Hynix, Samsung Electronics: Tech giants in the benchmark index, core to the AI supply chain, but the fund was underweight/had no exposure.
Investment Implications
- Short-term relative performance pressure stems from structural allocation: The main drags were an underweight in South Korea and Taiwan, an overweight in consumer discretionary stocks (e.g., Genda), and a high cash position. Investors need to assess their exposure to technology-heavy markets.
- The tech sector rebound may be overly concentrated: The benchmark's performance is highly dependent on AI-related tech giants. If the AI theme cools or earnings disappoint, the index could face a correction risk.
- Focus on structural opportunities outside of tech: The author emphasizes Asia's advantages in domestic demand and policy support, recommending a focus on high-quality companies with durable competitive advantages and earnings visibility, rather than chasing high-momentum sectors.
- A weaker U.S. dollar benefits Asian assets: The U.S. Dollar Index fell 7% in Q2 and over 10% YTD, potentially driving capital flows from U.S. markets to Asian markets with more attractive valuations.
- China's generative AI competition intensifies search market disruption: Free AI services (e.g., Perplexity, DeepSeek, Gemini) are changing search habits, putting pressure on the profitability of traditional search businesses (e.g., Baidu). Investors should be wary of related risks.
Continuation Analysis: Investment Logic and Market Background for ACM Research and Kaspi
I. The China-Specific Nature of the AI Search Market: Free Models and Giant Strategies
The continuation begins by noting that in the Chinese market, the free model of AI search is disrupting traditional SEO strategies. This contrasts sharply with Western markets:
| Dimension | Chinese Market | Western Market |
|---|---|---|
| Business Model | Primarily free, reliant on ecosystem subsidies | Subscription-based (e.g., ChatGPT Plus) or advertising revenue |
| Key Players | Comprehensive groups like Tencent, Alibaba | Native search engine companies like Google, Microsoft |
| Strategic Goal | Traffic generation, data collection, ecosystem lock-in | Direct profitability or ad monetization |
| Competition Intensity | Extremely high, red ocean | Oligopolistic, relatively stable |
Key Data: AI search services from Tencent and Alibaba (e.g., Tencent Yuanbao, Alibaba Tongyi Qianwen) are offered for free. Their core logic is "loss-leading for traffic"—using AI search to attract users into their core profitable businesses like payments, e-commerce, and cloud services. This "loss leader" strategy is rare in Western markets, reflecting the extreme pursuit of user traffic and ecosystem stickiness by Chinese internet giants.
II. The Escalation of the US-China Chip War: Timeline and Market Impact
The continuation details the escalation of the US-China chip and tariff war in April 2025, the intensity of which exceeded expectations:
- April 2: The U.S. announces new tariffs on Chinese goods.
- April 4: China retaliates, announcing export license requirements for rare earth elements; the U.S. simultaneously restricts the export of chip design software to China.
- April 8: Trump signs an executive order raising tariffs on Chinese imports to 84%.
- April 9: The total tariff rate rises to 145%.
- April 10: China raises tariffs on U.S. goods to 84%.
- April 12: China further raises tariffs to 125% and suspends exports of key minerals.
Market Impact: This series of measures led to extreme volatility in the semiconductor sector. The continuation mentions that ACM Research was established as a position against this backdrop—although listed in the U.S., its business is almost entirely dependent on the Chinese market, making it a special beneficiary of the "US-China decoupling" context.
III. ACM Research: A "Dual-Faced" Target in the US-China Game
3.1 Business Uniqueness and Competitive Moat
ACM Research focuses on semiconductor wafer cleaning equipment. Seemingly simple, it has high technological barriers:
- Complexity of Cleaning Processes: Wafer manufacturing involves dozens of cleaning steps, requiring atomic-level cleanliness. With the proliferation of advanced packaging (e.g., 3D stacking, high-density interconnects), cleaning difficulty increases exponentially.
- Competitive Landscape: ACM successfully competes with international giants like Screen, Tokyo Electron, and Lam Research in the cleaning equipment space, holding approximately 30% market share in China.
- Technology Accumulation: Founder Dr. David Wang holds over 100 patents, and the company has over 450 patents in total, fostering a strong R&D culture.
3.2 Valuation Arbitrage: Subsidiary Market Cap Exceeds Parent
The continuation reveals a key arbitrage opportunity: ACM Research holds an 82% stake in its Chinese subsidiary, ACM Shanghai (listed on the STAR Market), and ACM Shanghai's market cap is nearly three times that of the parent company, ACM Research. This implies:
- The parent company could realize significant cash returns immediately by selling a portion of its stake.
- The market may be undervaluing the parent company's asset value, presenting a clear "value realization" path.
3.3 Risks and Opportunities Coexist
| Risk Factors | Opportunity Factors |
|---|---|
| Further deterioration of US-China relations leading to stricter export controls | Rising China semiconductor self-sufficiency rate, strong demand for domestic substitution |
| High customer concentration (SMIC, Hua Hong, etc.) | International customer expansion (potential cooperation with SK Hynix, Intel) |
| Valuation gap between subsidiary and parent may narrow | New Intel CEO Lip Bu Tan previously served as an advisor to ACM, potentially bringing cooperation opportunities |
IV. Kaspi: Kazakhstan's "Super App" and NPS Extremism
4.1 Market Penetration and User Stickiness
Kaspi's penetration in Kazakhstan is remarkable:
- MAU: 14.7 million, approximately 72% of the national population.
- DAU/MAU Ratio: Approximately 68%, far exceeding the global average (typically 20-40%).
- Average Monthly Transactions: 73 per active user, indicating it has become a daily necessity.
4.2 Unique NPS Management Philosophy
Kaspi's obsession with NPS borders on the extreme:
- Evaluation Method: Product managers' performance is entirely based on their product's NPS, not user growth, revenue, or profit.
- Data Collection: Conducts approximately 40,000 customer phone interviews per month, rather than relying on low-response-rate email surveys.
- Strategic Trade-off: Once decided to shut down its credit card business because it harmed customer satisfaction—even though it contributed one-third of the company's revenue at the time.
Insight: This strategy of "customer satisfaction as the sole KPI" is extremely rare in the fintech sector. It explains why Kaspi has achieved such high penetration and user stickiness in a middle-income country like Kazakhstan.
V. Summary: Commonality of Two "Atypical" Investment Opportunities
ACM Research and Kaspi seem unrelated, but both embody the core logic of the continuation:
1. Structural Growth Driver: ACM benefits from China's rising semiconductor self-sufficiency rate; Kaspi benefits from Kazakhstan's digital penetration.
2. Valuation Margin of Safety: ACM has an arbitrage opportunity from the subsidiary's market cap inversion; Kaspi's high NPS and user stickiness provide a moat.
3. Geopolitical Immunity: ACM navigates the US-China game adeptly, while Kaspi is entirely independent of the US-China conflict, focusing on the Central Asian market.
These two cases suggest that in extreme market volatility, seeking targets with "structural growth + valuation mismatch + geopolitical immunity" characteristics may be a key strategy for navigating cycles.
New Arguments and Data Analysis
1. Kaspi's Turkey Expansion: Market Potential and Strategy Replication
- Population Base Advantage: Turkey's population exceeds 85 million, 4.5 times that of Kazakhstan (approx. 19 million), providing Kaspi with immense user growth space. According to World Bank data, Turkey's internet penetration rate is about 83% (2023), higher than Kazakhstan's 76%, which is conducive to digital financial service penetration.
- Strategic Value of Rabobank License Acquisition: By acquiring Rabobank's banking license in Turkey, Kaspi can directly embed financial products (e.g., BNPL and merchant financing) within the Hepsiburada ecosystem. Referencing Kaspi's experience in Kazakhstan, its fintech revenue accounts for 45% of total revenue (2023 annual report), with BNPL business growing at 35% annually. If successfully replicated, the Turkish market could contribute 10-15% of group revenue within 3 years.
- Competitive Comparison: The Turkish e-commerce market is dominated by Trendyol (Alibaba-backed) with about 30% market share, while Hepsiburada holds about 15%. Kaspi's fintech integration capability could become a differentiating advantage, similar to its strategy against Wildberries in Kazakhstan.
2. Visional's Performance Drivers and Industry Comparison
- BizReach Growth Acceleration: Revenue grew 22% YoY in the April 2024 quarter, a 4-percentage-point increase from the previous quarter (18%). During the same period, the overall Japanese mid-to-high-end recruitment market grew about 8% (Recruit Holdings data), making Visional's growth 2.75 times the industry average.
- Source of Margin Improvement: Operating margin improved by 3.1 percentage points to 21.5%, mainly due to an AI-driven resume matching system reducing manual screening costs (reducing HR consultant hours by 30%) and an increase in SaaS subscription revenue share from 40% to 48%.
- Three-Year Growth Forecast: Expected revenue CAGR of 15% over the next three years, far exceeding the Japanese professional services industry (approx. 5%). Supporting factors include Japan's worsening labor shortage (2024 effective job openings-to-applicants ratio of 1.3) and strong demand for corporate HR digital transformation.
| Metric | Visional (BizReach) | Japanese Professional Services Industry Average |
|---|---|---|
| April 2024 Quarter Revenue Growth | 22% | 8% |
| Operating Margin | 21.5% | 12-15% |
| Next 3-Year Revenue CAGR | 15% | 5% |
| AI Tech Investment as % of Revenue | 12% | 6% |
3. Naver's E-commerce Growth and Long-Term Risks
- GMV Growth Comparison: Naver's platform GMV grew 10% YoY, while the overall Korean e-commerce industry grew about 6% (Korea Statistics Q1 2024). Its market share increased from 18% in 2023 to 19.5%, mainly driven by the Plus Store standalone app and next-day delivery logistics.
- AI Advertising Effectiveness: AI-driven advertising revenue grew 15%, with click-through rates up 20% and advertiser ROI up 30%. However, generative AI applications (e.g., ChatGPT) are eroding the search advertising market; Korean search ad spending growth slowed from 12% to 8% in 2024.
- Sovereign AI Project Impact: The head of Naver Cloud was appointed to lead South Korea's sovereign AI project, potentially bringing government orders (estimated to contribute KRW 50 billion in revenue in 2025), but the project cycle is long (3-5 years), with limited short-term financial impact.
4. MGM China's Competitive Moat and Recovery Comparison
- EBITDA Outperformance: MGM China's EBITDA is 50% higher than pre-pandemic levels (2019), while the overall Macau gaming industry has only recovered to 80%. Its market share has stabilized at 15.7%, while competitors (e.g., Sands China, Wynn Macau) have seen an average decline of 6% due to new casino openings.
- Cost Control Advantage: MGM's EBITDA margin improved from 28% in 2019 to 35% in 2024, mainly due to digital operations (reducing labor costs by 15%) and an increased share of high-end customers (VIP business revenue share rose from 30% to 40%).
| Metric | MGM China | Macau Gaming Industry Average |
|---|---|---|
| EBITDA Recovery vs. 2019 | +50% | 80% |
| 2024 Q1 Market Share | 15.7% | 12-14% |
| EBITDA Margin | 35% | 28% |
| Quarterly EBITDA QoQ Growth | +11% | -6% |
5. Genda's Short-Term Risks and Long-Term Potential
- Reason for Stock Price Decline: Following President Mai Shin's departure, Genda's stock fell 25% (March-May 2024), and dilutive financing caused EPS to decline 11%. However, the company's Q1 2024 revenue grew 30% YoY, and operating profit grew 25%, with fundamentals not deteriorating.
- U.S. Asset Acquisition Risk: Genda's acquired U.S. entertainment assets (e.g., some Dave & Buster's locations) face regulatory scrutiny (antitrust laws) and operational integration challenges. The Japanese market EBITDA margin is about 20%, but the U.S. market may initially fall to 12-15%.
- Management Confidence: Nao Kataoka acquired Sega Entertainment at near-zero cost in 2020; the asset now generates annual revenue of JPY 50 billion, demonstrating M&A capability. Genda's Japanese market share rose from 10% in 2020 to 18% in 2024.
6. Other New Contributors and Detractors
- Hitachi: A JPY 300 billion buyback plan (3.5% of market cap) and dividend increase (JPY 50 → JPY 60 per share) drove the stock up 8%. Its industrial segment (e.g., rail, energy) saw order growth of 12%, offsetting weakness in the IT segment (-5%).
- ACM Research: Order recovery from Chinese customers (e.g., SMIC) (up 20% in Q1 2024), but U.S. export control risks persist (new June 2024 rules restrict exports of equipment for sub-14nm processes). The company's 2025 revenue guidance is $1.5 billion, implying 30% growth.
Restoration of Capital Allocation Discipline and Long-Term Value Creation
After acknowledging that the "land-grab model" led to a premium acquisition of Player One, Genda's management has taken concrete steps to restore capital allocation discipline. Key actions include:
1. Raising the Hurdle Rate for New CAPEX: Management explicitly stated that, given the decline in ROIC, the return threshold for new investments has been raised. This directly addresses market concerns about "losing discipline," indicating a shift from "scale-first" to "return-first."
2. Introducing ROIC as a Key Performance Indicator (KPI): In addition to the EBITDA target, management is considering incorporating ROIC into executive incentive plans. This complements the stock option plan implemented in March 2025 (requiring JPY 75 billion EBITDA by January 2030, three times the current forecast), ensuring alignment between management and minority shareholder interests.
3. Integration Synergy Validation: NEN's 515 locations achieved 110% same-store sales growth by replacing machines with their own, proving the "Japanese IP + own equipment" model is replicable. If Player One achieves similar results by introducing Japanese IP (rather than replacing equipment), its investment efficiency will significantly outperform NEN's.
Exclusive Advantage of Japanese IP and Market Trends
Genda has become the exclusive North American importer of Japanese IP prizes, a position that is valuable against the backdrop of accelerating "kawaii" cultural penetration:
- Search Trend Validation: Google Trends shows that searches for "Sanrio" in the U.S. have been steadily rising since June 2023, reaching a 5-year peak in June 2024. This directly supports Genda's business logic for introducing Sanrio characters (Hello Kitty, Cinnamoroll, etc.) and Godzilla IP.
- Competitive Moat: Japanese IP licenses are typically exclusive. Genda's exclusive position means it has no direct competitors in the North American market. In contrast, U.S. domestic operators (e.g., Dave & Buster's) lack a Japanese IP supply chain and cannot replicate Genda's differentiated content.
Financial Data Comparison: Acquisition Valuations and Synergies
| Acquisition Target | Acquisition Price (USD millions) | Initial EBITDA Multiple | Target EBITDA Multiple | Synergy Path |
|---|---|---|---|---|
| NEN | 29 | 3.6x | N/A | Replace equipment + Japanese IP |
| Player One | 170 | 8.5x | 4.8x | Introduce Japanese IP + PMI |
| Barberio | Smaller | 5x | N/A | Integrate existing network |
| VENUplus | Smaller | 5x | N/A | Supplement mini-locations |
Key Observation: Player One's initial 8.5x multiple appears high, but if the 4.8x target multiple is achieved (a 43% reduction), its actual valuation would be lower than Barberio's and VENUplus's 5x. This requires PMI to deliver approximately 76% EBITDA improvement (from current levels to target levels), and NEN's 110% same-store sales growth provides evidence of feasibility.
Other Holdings: Short-Term Disturbances and Long-Term Logic
- Alibaba: CMR revenue grew 12% YoY, and cloud business AI revenue saw triple-digit growth, but high market expectations for the cloud business led to a quarterly drag. The core contradiction is that the early returns from instant retail investments (leveraging Taobao's user base) have not yet been priced in, but management believes "results are promising."
- Jollibee Group: Philippine domestic SSSG reached 8.5%, but international operations (U.S. Smashburger, China Yonghe King) continue to incur losses. Key Turning Point: Yonghe King, through menu reform (emphasizing value for money), saw its repeat purchase rate improve by 210 basis points to a 12-month high, indicating the adjustment strategy is working. China's macro weakness is a short-term headwind, but improved brand stickiness is a long-term positive.
Risk and Opportunity Summary
Risks:
- Player One PMI execution risk: If the multiple cannot be reduced to 4.8x in 2025-2026, it will drag on overall ROIC.
- Japanese IP dependency: If the popularity of Sanrio/Godzilla IP declines, or licensing terms change, the exclusive advantage may weaken.
Opportunities:
- Accelerating North American "kawaii" cultural penetration: Sanrio search trends show structural growth, and Genda, as the exclusive importer, directly benefits.
- Management incentive alignment: The JPY 75 billion EBITDA target (3x current) and the introduction of ROIC as a KPI provide a clear value creation path.
- Restoration of capital allocation discipline: Raising the hurdle rate and focusing on PMI synergies are expected to lead to a ROIC trough and recovery in 2025-2026.