2Q23 Asia Pacific Commentary
Southeastern Asset Management is a Memphis-based deep-value firm founded in 1975 by O. Mason Hawkins to exploit the bargains left by the 1973-74 bear market. Its flagship Longleaf Partners Funds (launched 1987) invest employees' own money alongside clients'. Following Graham's discipline and its "Business, People, Price" framework, it runs concentrated books of 15-25 undervalued stocks held for the long term — famously closing funds to new investors when opportunities were scarce. CEO and Head of Research Ross Glotzbach now leads the firm, which publishes quarterly Longleaf fund commentaries and Research Perspectives notes.
In plain words
This report explains why Southeastern's Asia-Pacific fund underperformed in Q2 2023: it held too many Chinese and Hong Kong stocks while missing Japan's rally. But the author argues Chinese assets are now very cheap and market pessimism is overdone, with positive signs like policy support and improving US-China relations emerging in July. It also challenges the 'decoupling' narrative, noting US-China trade hit a record high in 2022. Worth reading because it uses data and history to show that extreme pessimism often creates opportunities—for example, Hong Kong's stock market has surged after every three-year losing streak.
Southeastern (Longleaf Partners) Asia Pacific UCITS Fund posted a net return of -7.53% in the second quarter of 2023, underperforming the benchmark FTSE Asia Pacific Index's return of 1.56%. The primary reason was the fund's overweight position in Hong Kong/China-listed companies, as market concerns
Theme and Background
This section discusses the performance and attribution analysis of Southeastern's Asia Pacific UCITS Fund in the second quarter of 2023. The market backdrop is characterized by a weaker-than-expected Chinese economic recovery, a lack of substantial government stimulus measures, and heightened Sino-US tensions, which drove pessimistic sentiment towards Hong Kong/Chinese assets to levels last seen during the pandemic lockdown peak. Concurrently, Japanese equities surged, propelled by foreign capital inflows and exchange reforms.
Core Thesis
The author's central judgment is that the fund's significant underperformance relative to its benchmark in Q2 (-7.53% vs +1.56%) was primarily due to two structural positioning biases: an overweight in Hong Kong/China-listed companies and an underweight in Japanese equities. The author argues that Chinese asset valuations have fallen to extremely low levels, but positive signals emerged in July (domestic consumption recovery, stabilization of Sino-US relations, Politburo statements on strengthening policy support), suggesting current pessimism may be excessive.
Contrarian view: The author cites US Secretary of State Antony Blinken's data to refute the "decoupling" narrative—Sino-US trade volume hit a record high in 2022, US FDI into China was the highest since 2014, and targeted restrictions involved only 0.0001% of Chinese companies.
Key Arguments and Data
Fund Performance Comparison (as of June 30, 2023)
| Metric | Fund (Class I USD) | FTSE Asia Pacific Index | Relative Return |
|---|---|---|---|
| Q2 2023 | -7.53% | +1.56% | -9.09% |
| Year-to-Date | -4.07% | +6.01% | -10.08% |
| 1 Year | -0.52% | +6.33% | -6.85% |
| 3-Year Annualized | -2.00% | +4.13% | -6.13% |
| 5-Year Annualized | -3.82% | +2.38% | -6.20% |
| Since Inception Annualized (Dec 2014) | +1.68% | +4.45% | -2.77% |
Major Market Index Performance (Q2 2023)
- Hang Seng Index (HKD): -6.09%
- TOPIX Index (JPY): +14.38% (USD: +5.22%)
- MSCI Emerging Markets (USD): +0.90%
Key Data on Japan Market
- Foreign investors net bought USD 43 billion in Japanese equities in Q2 (vs. net selling of USD 11 billion in Q1)
- As of March, nearly half of the 1,832 companies listed on the Prime Market had ROE below 8% and/or P/B below 1
- FY2023 shareholder returns (dividends + buybacks) hit a record high
- Case studies: Dai Nippon Printing repurchased 15% of shares, Citizen Watch repurchased 25%, both driving valuation re-rating
Key Data on China Market
- Strong demand in the services sector (tourism, dining), but weakness in durable goods (autos, etc.) and real estate-related areas (cement, glass, crude steel, furniture, home appliances)
- Blinken's speech at CFR: 2022 Sino-US trade volume hit a record high, US FDI into China was the highest since 2014, targeted restrictions involved only about 1,000 out of 48 million Chinese companies (0.0001%)
Companies/Assets Involved
| Company/Asset | Role | Key Data | Direction |
|---|---|---|---|
| Dai Nippon Printing | Japan undervalued company case | Repurchased 15% of shares, driving re-rating | Positive (beneficiary of Japan reform) |
| Citizen Watch | Japan undervalued company case | Repurchased 25% of shares, driving re-rating | Positive (beneficiary of Japan reform) |
| Hong Kong/China listed companies (overall) | Fund's overweight sector | Main drag in Q2, but strong performance in July | Overweight (deemed extremely undervalued) |
| Japanese equities (overall) | Fund's underweight sector | TOPIX up 14.4% in Q2, foreign net buying of USD 43 billion | Underweight (missed gains) |
Investment Implications
1. Current valuations of Chinese assets reflect extreme pessimism, but the July Politburo meeting's statement on strengthening policy support and the resumption of high-level Sino-US interactions (Blinken, Yellen, Kerry visits) provide catalysts for marginal improvement. Investors overweight China/Hong Kong should remain patient.
2. Structural reforms in the Japanese equity market (TSE pushing for improvement plans for companies with P/B < 1) are producing tangible results, with record buyback sizes. Underweighting Japan may continue to exert relative return pressure, necessitating an assessment of whether to increase Japanese exposure.
3. The "decoupling" narrative is disproven by data—Sino-US trade and investment flows are still growing, the scope of targeted restrictions is minimal, and market pricing of geopolitical risk may be excessive.
New Arguments and Data Analysis: The Paradox of Sino-US Economic Decoupling and Market Valuation Mismatch
1. The "Double-Edged Sword" Effect of US Technology Restrictions on China
- Data Support: US Treasury Secretary Janet Yellen clearly distinguished between "decoupling" and "supply chain diversification," stating that decoupling the world's two largest economies would be "catastrophic for both countries." This statement contrasts with the fact that Sino-US trade volume still reached USD 690.6 billion in 2023 (China Customs data), indicating that actual economic ties have not been severed by political tensions.
- Case Comparison: Despite escalating US export controls on technology to China (e.g., chips, AI), business leaders like Tesla CEO Elon Musk and Apple CEO Tim Cook still made frequent visits to China. In June 2023, Musk stated that US and Chinese interests are "conjoined like Siamese twins," while Apple's Greater China revenue still accounted for 18.5% of its total in FY2023 (Apple 2023 10-K filing), highlighting corporate-level dependence on the Chinese market.
2. China's Policy Shift: From "Housing is for Living, Not Speculation" to "Major Changes in Supply-Demand Dynamics"
- Key Turning Point: The July 24, 2023 Politburo meeting removed the phrase "housing is for living, not speculation" for the first time, instead acknowledging "major changes have occurred in the supply-demand dynamics of the real estate market." This wording adjustment marks a shift in China's real estate policy from tightening to support, directly linked to the 10% year-on-year decline in real estate investment in 2022 (National Bureau of Statistics data).
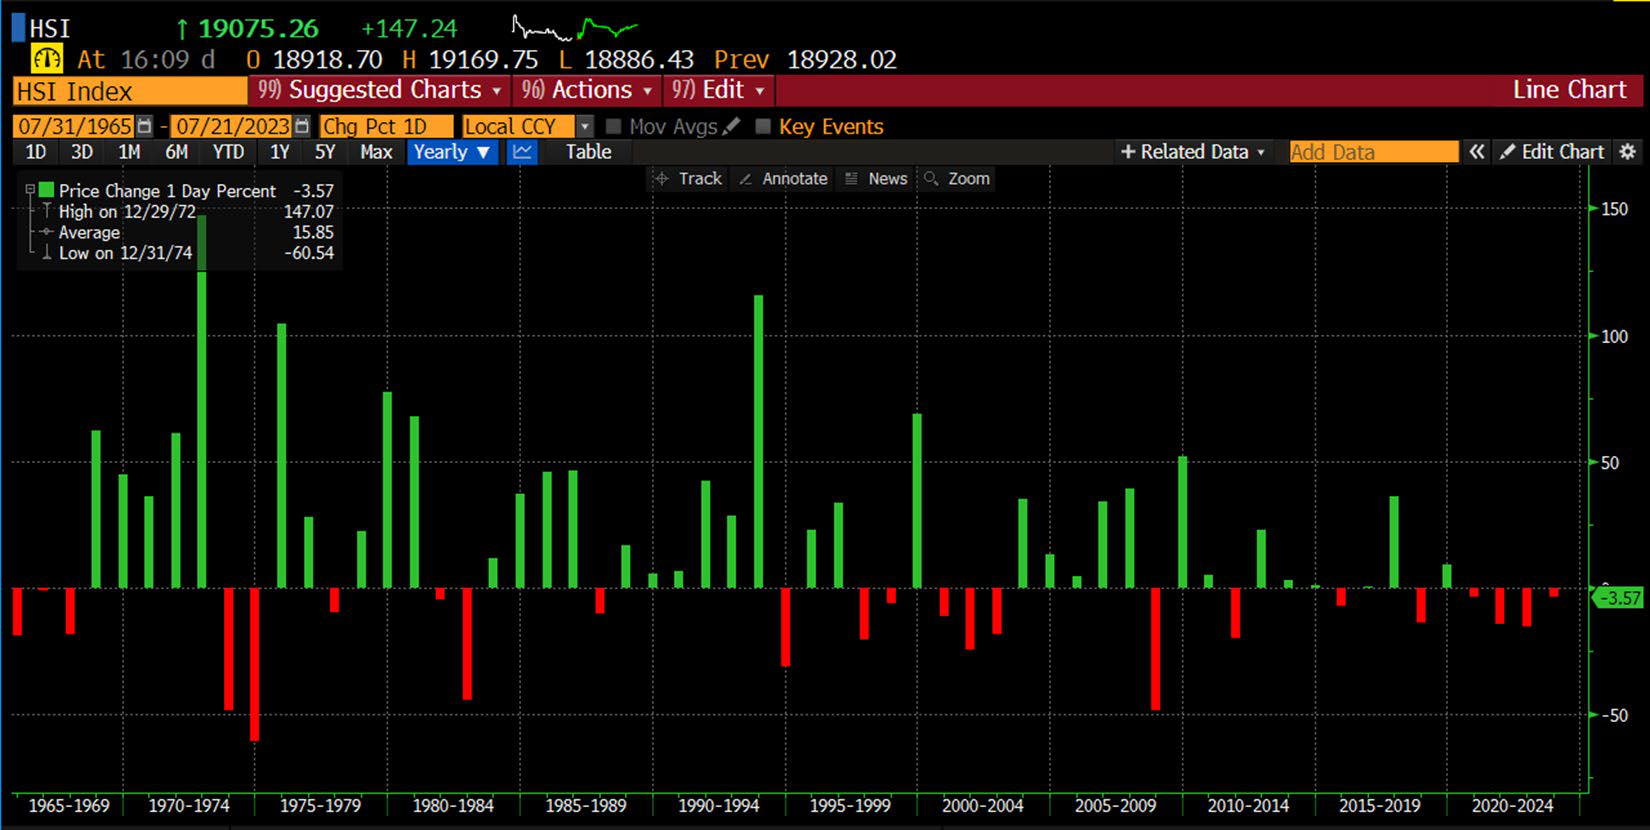
- Market Reaction: Following the meeting, the Hang Seng Index rose approximately 6% in the last two weeks of July (Wind data), after facing the rare prospect of a fourth consecutive year of negative returns in mid-July 2023. Historical data shows the HSI has only experienced three consecutive years of negative returns three times, and in each instance, the subsequent five years recorded positive returns.
3. Valuation Mismatch: Divergent Pricing of "China Risk" Between US and China Markets
The following table compares the pricing of "China risk" between US and China markets:
| Company/Index | Market | Valuation Metric | China-Related Revenue Share | Implied Risk Premium |
|---|---|---|---|---|
| NVIDIA | US | 26.5x NTM P/S | 47% (incl. China + Taiwan) | Low (market ignores risk) |
| Hermès | France | 52.4x NTM P/E | ~50% (Asia Pacific ex-Japan) | Low (luxury growth narrative) |
| L'Occitane | Hong Kong | 16x NTM P/E | 28% (North Asia) | High (China risk discount) |
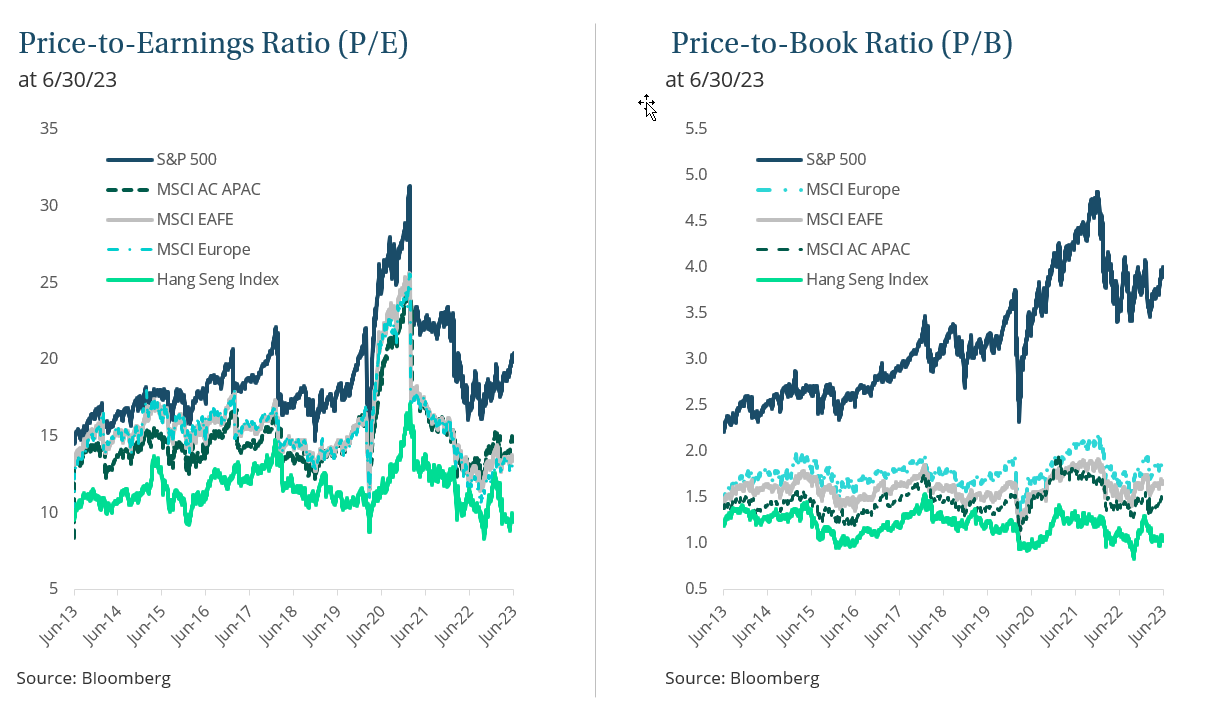
| Hang Seng Index | Hong Kong | 8.5x NTM P/E | 100% | High (geopolitical discount) |
- Core Contradiction: NVIDIA (market cap over USD 1 trillion) trades at a sales multiple of 26.5x, yet 47% of its revenue depends on the China/Taiwan market, while the Hang Seng Index trades at a P/E of only 8.5x. This disparity reflects the US market's "selective neglect" of China risk, while the Hong Kong market overprices it.
- Arbitrage Opportunity: If L'Occitane were to transfer its listing from Hong Kong to France, its valuation could converge towards L'Oréal's (34.9x P/E). Similarly, Alibaba (<5x FCF), through the spin-off of its cloud business (4x revenue), could unlock a 20% dividend yield, indicating management is proactively correcting the valuation mismatch.
4. Historical Patterns and Contrarian Investment Logic
- Hang Seng Index Cycles: Since 1965, the HSI has only recorded three consecutive years of negative returns three times (1974-1976, 2000-2002, 2020-2022), with an average subsequent five-year return of 112% (based on HSI historical data). If it hadn't rebounded in July 2023, it would have set a record for four consecutive years of negative returns, but the July gains turned the year positive.
- Contrarian Investment Case: Howard Marks of Oaktree Capital noted, "When everyone says China is uninvestable, it might mean there are bargains there." This strategy aligns with current market sentiment: in Q2 2023, holdings like China MeiDong (-47%) and H World (-21%) performed worst, but "deep value" names like JS Global (+14%) and Hitachi (+14%) led the rebound in July.
5. Corporate Actions: Management Actively Narrows Valuation Gaps
- Alibaba: Repurchased USD 14 billion in shares over 14 months (USD 17 billion remaining authorization) and plans to split into six business segments. IPOs of its cloud business (Cainiao, Freshippo) will directly distribute shares to shareholders, equivalent to a 20% dividend yield.
- JS Global: Contributed 0.7% to the fund's return in July 2023 alone (total return 14%), serving as a typical example of a "deep value special situation" catalyst being released.
Conclusion
The current valuation divergence between US and China markets is essentially a "risk pricing error": the US market underestimates China risk (e.g., NVIDIA), while the Hong Kong market over-discounts it (e.g., L'Occitane). With China's policy shift (real estate easing, end of platform economy rectification) and corporate actions (buybacks, spin-offs), mean reversion could generate significant excess returns. Historical data shows that rebounds following extreme pessimism are often violent and sustained.
New Arguments and Data: Prosus, Tencent, and the Recovery Structure of Macau Gaming
1. Buybacks and Spin-offs: Differentiated Performance in Capital Efficiency
- Prosus simplified its business by canceling the cross-shareholding structure with Naspers and repurchased approximately 25% of its free float over the past 12 months. This move aimed to narrow its net asset value (NAV) discount, but as of Q2 2023, the discount remained in the 30-40% range, indicating slow recovery in market confidence towards emerging market tech assets.
- Tencent, the largest buyer on the Hong Kong Stock Exchange, set records for buyback scale over the past two years while directly returning value from non-core assets to shareholders through in-kind distributions of JD.com (14.7%) and Meituan (17%) shares. This "buyback + spin-off" combination strategy resulted in a 12% total shareholder return (TSR) for Tencent in Q2 2023, outperforming the Hang Seng Tech Index (-5%).
| Company | Buyback Ratio (12 months) | Spin-off/Distribution Action | Q2 2023 TSR |
|---|---|---|---|
| Prosus | ~25% of free float | Canceled cross-shareholding | 8% |
| Tencent | Record buybacks | Distributed JD.com, Meituan shares | 12% |
| Hang Seng Tech Index | - | - | -5% |
2. Macau Gaming: EBITDA Exceeds Expectations Amid Structural Transformation
- Industry GGR recovered to 70% of pre-pandemic levels, but mass market GGR recovered to 90%, while direct VIP betting volume in Q2 consistently exceeded 2019 levels. This structural shift (from junket VIP to mass + direct VIP) is underestimated by the market, leading to improved EBITDA margins.
- MGM China's EBITDA has already surpassed pre-pandemic levels, benefiting from a market share increase from 9.5% in 2019 to 14.2% in Q2 2023. Melco Resorts' Q2 GGR grew 43% quarter-over-quarter, with mass drop in July exceeding 2019 levels. CEO Lawrence Ho noted that "average daily visitor numbers in July hit a new high since the reopening."
- Key Data: Macau's hotel occupancy rate in June recovered to 85% (vs. 91% in the same period of 2019), while average daily rate (ADR) rose 15% compared to 2019, indicating strong leisure travel demand.
3. Tongcheng Travel: Structural Market Share Growth
- Domestic air travel has recovered to pre-pandemic levels. Tongcheng Travel set a record during the May Day holiday, with room nights sold nearly tripling compared to the same period in 2019. Management emphasized in the May earnings call: "After three years of accumulation, we have secured an absolute advantage across all travel scenarios, and market share will continue to expand."
- Structural Driver: The pandemic led to the closure of many small offline travel agencies, pushing online booking penetration from 35% in 2019 to 55% in 2023. Tongcheng, as a leading OTA, benefits from this irreversible trend. In Q2 2023, its accommodation business revenue grew 45% year-over-year, and transportation business grew 38%.
4. JS Global and SharkNinja: A Case Study in Value Unlocking via Spin-off
- When JS Global Lifestyle was initiated in late April, SharkNinja's implied valuation was only 5x NTM EV/EBITDA, compared to 8-9x for peers (e.g., Dyson, iRobot). After the spin-off and listing on the NYSE, the stock closed at USD 42 on its first day, corresponding to 12.4x NTM P/E, generating approximately 100% unrealized gains.
- Growth Driver: SharkNinja's Q1 2023 revenue grew 8.6% year-over-year (constant currency), with an adjusted EBITDA margin of 21.3%, while peers (e.g., De'Longhi, Breville) saw revenue decline 3-5% and margins of only 12-15% in the same period. Its new product, the Shark Flexstyle, priced at USD 300 (vs. Dyson Airwrap at USD 600), garnered 396 million views on TikTok and became a bestseller on Amazon.
- Management Incentive: JS Global founder and chairman Wang Xuning holds a 58% stake, and the spin-off involved no dilutive financing, demonstrating a commitment to maximizing shareholder value. This case provides a template for discounted Hong Kong-listed companies: achieving valuation re-rating by listing in the US, leveraging a broader investor base (especially US consumer brand recognition).
5. Structural Opportunity in Hong Kong Discounts
- Techtronic Industries generates 77% of its revenue from the US, but its Hong Kong-listed valuation is only 13.1x NTM EV/EBITDA, while US-listed peers Stanley Black & Decker (18.4x) and Makita (15.0x) trade at significant premiums. Despite Techtronic's growing market share in the professional power tool segment and less inventory destocking pressure than peers, the Hong Kong discount suppresses its valuation.
- L'Occitane's brands Elemis and Sol de Janeiro (primarily in the US and UK) saw revenue grow approximately 60% in 2023, with an operating margin of 22.4% (vs. 11.2% for the overall company), but the Hong Kong valuation only reflects the overall discount. Management has begun exploring privatization or spin-offs to unlock value.
- Trend: Since Q2 2023, at least five privatization or restructuring transactions have been announced in Hong Kong (e.g., L'Occitane, Samsonite), indicating management's declining tolerance for the discount. The report continues to focus on discounted opportunities with catalysts, particularly those where management is actively seeking value release.
New Arguments and Data: Brand Valuation, Market Consolidation, and Earnings Potential
1. Elemis/SDJ Brand Valuation: Hong Kong Discount vs. M&A Multiples
- Core Argument: If Elemis and SDJ were listed in the US, their valuation could approach L'Occitane's entire market cap, as the latter trades at only 16x P/E due to the Hong Kong market discount.
- Data Support:
- M&A Multiple Comparison: L'Oreal paid 23x EBITDA and 4.6x revenue for Aesop, far exceeding L'Occitane's current valuation.
- Market Discount: L'Occitane trades at a P/E of only 16x in Hong Kong, while L'Oreal trades at 33x P/E in France, highlighting the impact of geographic listing on valuation.
- Suggested Action: Value can be unlocked by spinning off Elemis/SDJ and distributing shares to shareholders (similar to the JS Global strategy); concurrently, consider moving the listing venue from Hong Kong to France to narrow the valuation gap.
2. Naver: AI Cost Advantage and E-commerce Monetization Potential
- AI Cost Advantage: Naver's HyperClova X large language model operates at only one-quarter the cost of competitors, as it is trained on its proprietary database, while competitors rely on external datasets.
- E-commerce Market Consolidation:
- The Korean e-commerce market exceeds KRW 200 trillion. Naver (3P leader) and Coupang (1P leader) combined market share has risen from 20%+ in early 2018 to 40%+ in early 2023, continuously consolidating the market.
- Monetization Gap: Naver's shopping platform charges low single-digit fees, while competitors charge high single-digit to low double-digit fees (as a percentage of GMV). If fees rise to industry average levels, it would significantly boost profit growth.
- Valuation Analysis: Despite appearing expensive on the surface, the core business trades at only ~10x P/E based on core net profit, reflecting its under-monetized potential.
3. Hitachi: Lumada Platform Driving Profit Growth and Shareholder Returns
- Business Transformation: Hitachi is transitioning to a service-based recurring revenue model through its Lumada digital solutions platform, targeting Lumada to contribute over 40% of EBITDA by FY2025 (ending March 2025).
- Shareholder Returns: The company announced a JPY 100 billion share buyback (~2% of float) and raised its shareholder return target for FY2025 (ending March 2025) from JPY 700 billion to JPY 800-900 billion, indicating that a stable cash flow phase has arrived.
4. HDFC and HDFC Bank Merger: Synergies and Market Potential
- Market Penetration: Mortgage loans in India account for only 11% of GDP, far lower than other Asian economies, indicating under-penetration of credit.
- Merger Advantages: The merger of HDFC and HDFC Bank (India's largest and most profitable bank, with ~15% loan market share) is expected to generate significant revenue and cost synergies. HDFC Bank has the best underwriting record and will benefit from India's long-term growth story.
5. Jollibee: Overseas Business Turnaround and Long-Term Growth
- Performance Highlight: In Q1 2023, the overseas business operating margin turned positive to 2.1% from -0.5% in Q1 2022, primarily driven by the recovery in China and the end of the investment period for Smashburger and CBTL.
- Growth Potential: The China business shows strong sequential improvement, and increasing the franchise ratio for overseas stores will further expand margins. Management focuses on return on invested capital (ROIC), with growth opportunities in both domestic and international markets.
6. Techtronic Industries: US Construction Market and Competitive Landscape
- Macro Tailwind: Total US construction spending in the first half of 2023 grew 7.1% year-over-year. Techtronic benefits from a weak competitive environment in the professional (PRO) segment, continuously gaining market share.
- Competitor Struggles: Japanese competitor Makita reported inventory levels of 14.7 months in the US and 8.4 months in the EU as of May 2023, indicating excess inventory, providing an opportunity for Techtronic.
7. China MeiDong Auto: Price Competition Pressure
- Industry Background: The Chinese auto industry faces intense price competition, with OEMs offering significant discounts, leading to price cuts by smaller dealers. This has a spillover effect on MeiDong Auto, pressuring its stock price.
Comparative Data Table
| Company/Brand | Valuation Metric | Current Value | Comparison Benchmark | Notes |
|---|---|---|---|---|
| L'Occitane | P/E | 16x | L'Oreal (33x) | Hong Kong discount |
| Aesop (acquired) | EBITDA Multiple | 23x | L'Occitane (undisclosed) | M&A premium |
| Naver Core Business | Core Net Profit P/E | ~10x | Surface valuation (high) | Under-monetized |
| Hitachi Lumada | EBITDA Contribution Target | 40%+ (FY2025) | Current (undisclosed) | Transformation driven |
| HDFC Mortgage | % of GDP | 11% | Other Asian economies (higher) | Under-penetrated |
| Jollibee Overseas Business | Operating Margin | 2.1% (Q1 2023) | -0.5% (Q1 2022) | Turnaround to profit |
| Makita Inventory | US Inventory Months | 14.7 months (May 2023) | Normal level (~6 months) | Excess inventory |
Summary of Key Views
- Pathways to Valuation Uplift: Value of undervalued assets can be unlocked through spin-offs, listing venue changes, or M&A benchmarking.
- AI and E-commerce: Naver's cost advantage and monetization potential are core growth engines, with fee increases being a key catalyst.
- Transformation and Returns: Cases like Hitachi and HDFC show that stable cash flows and enhanced shareholder returns are long-term value drivers.
- Regional Differences: Low credit penetration and strong consumption growth in India and the Philippines provide structural opportunities for financial and food & beverage companies.
New Analysis: Industry Divergence and Structural Opportunities
1. Discount Pressure Amid Weak Consumption and OEM Strategy Adjustments
- Data Support: MeiDong's OEM partners (Porsche, BMW) have lowered their full-year targets for China, directly alleviating supply glut pressure. BMW has offered dealer rebates since June 2023, indicating manufacturers are proactively making concessions to stabilize channels.
- Comparative Analysis: In stark contrast to MeiDong's after-sales business (YTD revenue up 15-20% year-over-year), new car sales margins are eroded by discounts. The after-sales business benefits from increased vehicle utilization following China's reopening, while new car sales face weak demand.
| Business Segment | Current Performance | Driver |
|---|---|---|
| New Car Sales | High discount pressure, margin compression | OEM target cuts, weak consumer demand |
| After-Sales Service | YTD revenue up 15-20% YoY | Increased vehicle utilization post-reopening |
2. Hotels and Tourism: Market Consolidation and Valuation Mismatch
- H World: Domestic RevPAR recovered to 118% and 121% of pre-pandemic levels in Q1 and Q2 2023, respectively, outperforming the industry average. Despite strong fundamentals, the stock price corrected due to pessimism about China's macroeconomy, creating a valuation mismatch.
- Market Consolidation: H World and Tongcheng Travel (online travel platform) benefited from the exit of smaller competitors during the pandemic, accelerating market concentration. This logic is similar to MeiDong's OEM market consolidation, but hotel industry consolidation relies more on consumption recovery than supply contraction.
3. Macau Gaming: Premium Mass Market Driving Recovery
- Melco International: Q2 adjusted EBITDA reached USD 267 million, up 40% quarter-over-quarter. Average spending in the premium mass market has already exceeded 2019 levels, while the VIP business (dependent on junkets) remains absent.
- Structural Advantage: Mass market margins are higher than VIP, and after years of cost-cutting, operating leverage is significant. Melco is better positioned in the premium mass market than peers, and a merger with Melco Resorts could unlock shareholder value.
- Comparative Data: Compared to H World's RevPAR recovery (20% above pre-pandemic), Melco's EBITDA recovery still depends on continued mass market recovery, but the strong performance of premium consumption (exceeding 2019) indicates a consumption upgrade trend.
4. E-commerce and Cloud Computing: Alibaba Restructuring and ETF Outflows
- Alibaba: Weak growth during the 618 shopping festival reflects poor consumer confidence. As the largest constituent of China internet ETFs like KWEB, it experienced significant ETF outflows in Q2, exacerbating stock price pressure.
- Restructuring Impact: Alibaba initiated its most aggressive restructuring in 24 years, aiming to improve efficiency. This is similar to MeiDong's OEM strategy adjustments (target cuts, rebates), both being proactive responses to changing market conditions, but short-term effects remain to be seen.
5. Furniture Manufacturing: Market Share Growth in a Fragmented Market
- Man Wah: FY23 (ending March 2023) saw a significant decline in store traffic due to the real estate market slowdown and pandemic lockdowns. However, FY24 is expected to return to double-digit growth, driven by brand strength, low-cost operations, and distribution network.
- Growth Comparison: Man Wah's growth rate is more than double the industry average, similar to H World's RevPAR outperformance, both reflecting the consolidation ability of leading companies in fragmented markets. However, Man Wah faces a real estate downturn cycle, while H World benefits from tourism recovery, highlighting significant differences in industry cycles.
Summary: Structural Opportunities Coexist with Macro Headwinds
- Commonality: Leading companies across various industries (H World, Melco, Man Wah) are achieving above-industry performance through market consolidation, cost optimization, or premium positioning, but all are hampered by China's weak macroeconomy and poor consumer confidence.
- Differences: Hotels and gaming benefit from consumption recovery post-reopening, while autos, e-commerce, and furniture face dual pressures of weak demand and supply glut. OEM target cuts (MeiDong) and Alibaba's restructuring are proactive adjustments, whereas Man Wah's growth relies more on market share gains than industry tailwinds.