1Q23 Asia Pacific Commentary
Southeastern Asset Management is a Memphis-based deep-value firm founded in 1975 by O. Mason Hawkins to exploit the bargains left by the 1973-74 bear market. Its flagship Longleaf Partners Funds (launched 1987) invest employees' own money alongside clients'. Following Graham's discipline and its "Business, People, Price" framework, it runs concentrated books of 15-25 undervalued stocks held for the long term — famously closing funds to new investors when opportunities were scarce. CEO and Head of Research Ross Glotzbach now leads the firm, which publishes quarterly Longleaf fund commentaries and Research Perspectives notes.
In plain words
This report looks at investment opportunities in Asia in early 2023. It argues that the US banking crisis made risky assets (like tech stocks with lots of debt) vulnerable, but Asian companies are safer because they have low debt and plenty of cash. The focus is on China's recovery in travel, hotels, and casinos. Some stocks may seem expensive now, but the author believes their profits are growing fast, making them cheaper over time. For example, Alibaba looks cheap when you subtract its cash. The key takeaway: Asian companies with low debt and strong cash flow are worth watching, while long-term US assets carry big risks.
Southeastern (Longleaf Partners) Report The report discusses the performance of the Asia Pacific UCITS Fund in the first quarter of 2023 and the impact of the global banking crisis. The core view is that the fund returned 3.74% in the first quarter, slightly below the FTSE Asia Pacific Index's 4.38%
Theme and Background
This chapter focuses on the performance of Asia-Pacific UCITS funds in the first quarter of 2023, providing an in-depth analysis of the market impact from the global banking crisis (Silicon Valley Bank, Signature Bank, Credit Suisse run) and the progress of Asia's economic recovery following the lifting of pandemic restrictions. The report emphasizes that despite severe market volatility, Asian assets demonstrated relative resilience due to low leverage, net cash positions, and being in the early stages of recovery.
Core Views
The author's core investment thesis is: The recovery in Asian markets (especially China) is still in its early stages, with attractive valuations, while the US banking crisis has exposed the vulnerability of long-duration assets (such as tech stocks and long-term bonds). The fund portfolio, holding companies with low leverage, ample net cash, and low cash flow multiples, has lower sensitivity to interest rate changes, making it relatively safe amid the turmoil.
Counter-intuitive / Contrarian Judgments:
- Although some holdings (e.g., H World, MGM China) appear to have high valuations (18x, 16x EBITDA), the author believes they are in the early stages of earnings recovery, and future earnings growth will quickly digest these valuations.
- Asian banking systems have ample liquidity, with stable and positively sloped yield curves, in stark contrast to the inverted yield curve in the US, reducing financing cost pressures for Asian companies.
Key Arguments and Data
1. Fund Performance and Market Background:
- The fund returned 3.74% in Q1, slightly below the FTSE Asia Pacific Index's 4.38%.
- January saw valuation expansion driven by China's reopening; February weakened due to profit-taking, geopolitical risks (China balloon incident), and rapidly rising US interest rates.
- The 2-year US Treasury yield rose rapidly in February, breaking above 5% in early March (first time since 2007).
2. Banking Crisis Data:
- From March 8 to 17, the 2-year US Treasury yield plummeted 123 basis points (a 24% decline), the largest drop since the Lehman Brothers bankruptcy in 2008.
- US commercial bank deposits contracted 21.8% year-over-year in March; excluding large time deposits, the contraction was 28.3%.
- Goldman Sachs CEO David Solomon noted: In the past 25 years, there have been only 4 days with a single-day move of over 50 basis points in the 2-year US Treasury yield (1 day in September 2008, 3 days in March 2023); March 13 was the largest single-day move in the 2-year yield in 35 years.
3. Long-Duration Asset Value Destruction Cases:
- Stripe raised $6.5 billion at a valuation 47% lower than two years prior.
- Venture capital firms sought to exit investments at a 50% discount in the secondary market.
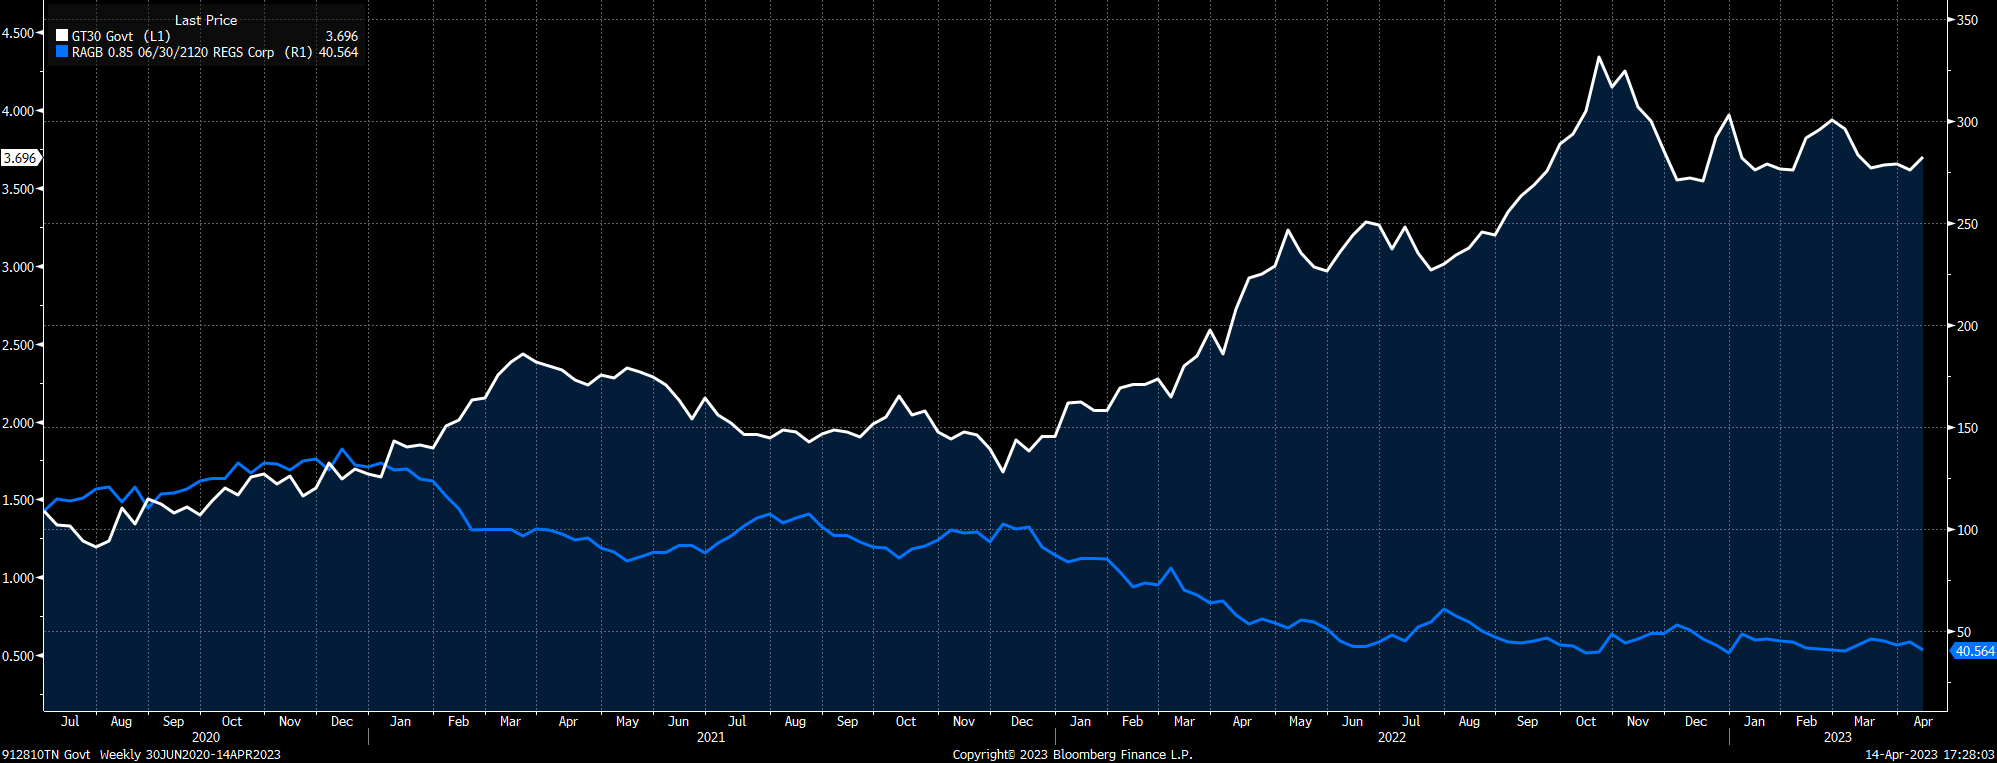
- The 100-year Austrian bond issued in 2020 (coupon 0.85%) currently trades below 40 cents, implying a loss of approximately 60% for forced sellers.
4. Asian Recovery Data:
- China's March retail sales grew 10.6% year-over-year, significantly exceeding expectations.
- Sands China's Q1 EBITDA reached $398 million, 30% above expectations, despite one-third of rooms being out of service due to labor shortages and visitor numbers only 40% of 2019 levels.
- Tongcheng Travel's March air ticket sales were already 30% higher than in 2019.
- H World's February RevPAR recovered to 140% of 2019 levels, primarily driven by higher average daily rates (ADR); it expects 2023 China hotel revenue growth of 46-50%, with RevPAR recovering to 110-115% of 2019 levels.
5. Fund Holdings Valuation Comparison:
| Company | Metric | Data |
|---|---|---|
| Alibaba | P/E Ratio | 11x |
| Alibaba (ex-net cash & investments) | FCF Multiple / FCF Yield | 5.5x / 18% |
| Baidu | P/E Ratio (consensus) | 20.1x |
| Baidu (ex-investments & net cash) | FCF Multiple | 12.2x |
| CK Asset | P/E Ratio / Dividend Yield | 9x / ~5% |
| WH Group | P/E Ratio / Dividend Yield | 5.5x / >6.5% |
| H World Group | NTM EBITDA Multiple (2023) | 18x |
| H World Group (2024 consensus) | EBITDA Multiple | 15x |
| H World Group (2025 consensus) | EBITDA Multiple | 13x |
| MGM China (2023 consensus) | EBITDA Multiple | 16x |
| MGM China (2024 consensus) | EBITDA Multiple | 11x |
Companies/Assets Involved
- Alibaba: Bullish. After excluding $61 billion in net cash and $64 billion in investment securities, the actual FCF multiple is only 5.5x, with an FCF yield of 18%.
- Baidu: Bullish. After excluding investments and net cash, the FCF multiple is 12.2x.
- CK Asset: Bullish. P/E of 9x, dividend yield near 5%, net cash position allows it to acquire Hong Kong land cheaply as competitors (distressed Chinese developers, highly leveraged Hong Kong developers) exit.
- WH Group: Bullish. P/E of 5.5x, dividend yield over 6.5%.
- H World Group: Bullish. Although the 2023 EBITDA multiple of 18x appears high, it is expected to decline to 15x in 2024 and 13x in 2025, benefiting from the strong recovery in China's hotel industry.
- MGM China: Bullish. 2023 EBITDA multiple of 16x, but expected to grow over 50% in 2024, bringing the multiple down to 11x.
- Sands China: Bullish. Q1 EBITDA exceeded expectations by 30%, indicating a rapid recovery in Macau's gaming industry.
- Tongcheng Travel: Bullish. March air ticket sales already exceeded 2019 levels by 30%.
- Stripe (non-holding, as a negative example): Valuation discounted by 47%, reflecting painful adjustments in the venture capital market.
- Republic of Austria 100-year bond (non-holding, as a negative example): Price fell below 40 cents, resulting in a loss of approximately 60%.
Investment Implications
- Go long on high-quality Asian companies with low leverage and ample net cash: Such as Alibaba, Baidu, CK Asset, and WH Group. They have low cash flow multiples, high dividend yields, and benefit from Asia's positively sloped yield curve and low financing costs.
- Go long on the China consumption recovery theme: H World, MGM China, Sands China, and Tongcheng Travel are in the early stages of earnings recovery, and earnings growth will quickly digest their currently seemingly high valuations.
- Avoid US long-duration assets: The US banking crisis and surging interest rates have led to significant contractions in venture capital valuations and long-term bond prices; similar risks are lower in Asian assets.
- Beware of global systemic risk contagion: Although Asia is relatively safe, the 21.8% contraction in US bank deposits and the inverted yield curve are systemic signals, requiring attention to their spillover effects on global liquidity.
Additional Arguments and Data: Structural Bottlenecks in International Travel Recovery and Leading Signals from Premium Consumption
1. The "Lag Effect" and Structural Barriers in International Travel Recovery
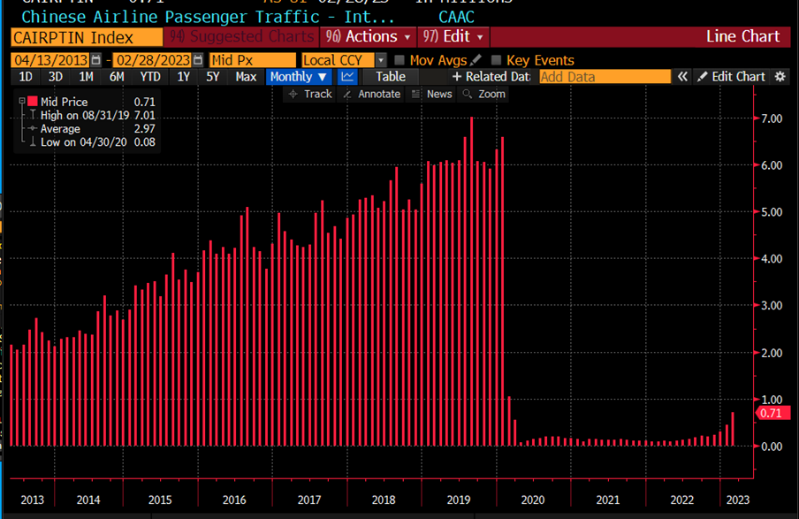
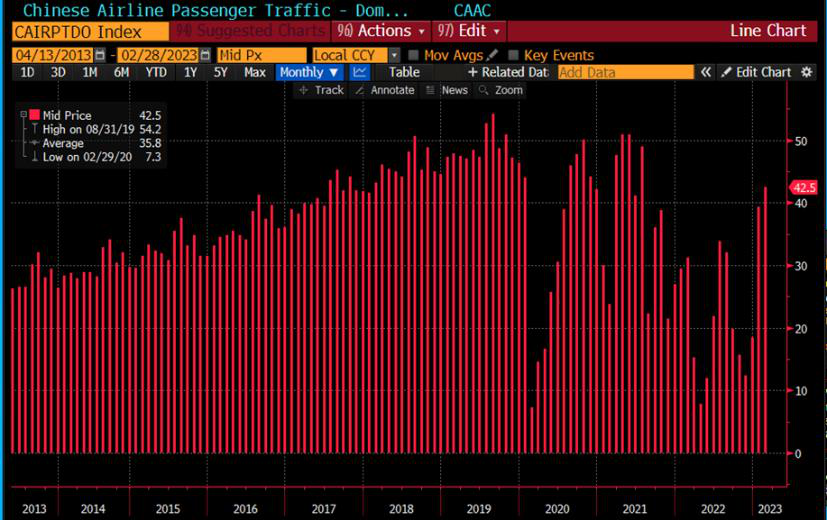
- Visa and Passport Backlog: The Chinese government suspended passport renewals during the pandemic, leading to a massive backlog. Foreign embassies in China have saturated visa processing capacity, creating a "double bottleneck." Bloomberg data shows that in Q1 2023, China's international flight capacity was only 15-20% of the same period in 2019, while domestic flights had recovered to over 90%.
- Price and Supply Mismatch: International airfares have risen 40-60% compared to 2019 (e.g., average economy class fare on US-China routes rose from $800 to $1,200+), and high-end hotel prices have increased over 70% year-over-year. This has resulted in the first wave of outbound travelers being high-net-worth individuals who can afford the premium and secure priority access to visas and flights.
| Indicator | 2019 Baseline | Q1 2023 Recovery Level | Key Bottleneck |
|---|---|---|---|
| Domestic Air Capacity | 100% | 90-95% | No significant restrictions |
| International Air Capacity | 100% | 15-20% | Slow route resumption, low flight frequency |
| Passport Renewal Processing Volume | Normal | Backlog of 3-5 million | 3-year government suspension |
| Visa Application Processing Time | 2-4 weeks | 8-12 weeks | Insufficient embassy staffing |
2. "Revenge Spending" and Structural Changes in Premium Consumption
- LVMH and Hermes Q1 Data: LVMH's China mainland fashion and leather goods business grew over 30% year-over-year in Q1, with "offshore consumption" (overseas and Hong Kong/Macau) growing significantly faster than "onshore." Hermes' Asia (ex-Japan) revenue grew 23% year-over-year, primarily driven by Chinese New Year consumption and popular Chinese tourist destinations like Singapore, Thailand, and Australia. Hermes specifically noted the strongest sales performance in Hong Kong and Macau, due to earlier resumption of tourist flows.
- Structural Advantages of Macau's Gaming Recovery: In March 2023, Macau's mass market gross gaming revenue (mass GGR) recovered to 82% of 2019 levels, while visitor numbers were only 50%. This indicates a significant increase in per capita spending ("revenge consumption"). The CEO of Las Vegas Sands compared the recovery phase to "a driving range, not yet the first hole," suggesting substantial room for further growth.
| Company/Market | Key Indicator | 2019 Baseline | Q1 2023 Recovery Level | YoY Growth |
|---|---|---|---|---|
| LVMH China Mainland | Fashion & Leather Revenue | 100% | 130%+ | +30%+ |
| Hermes Asia (ex-Japan) | Revenue | 100% | 123% | +23% |
| Macau Mass Market GGR | Monthly Revenue | 100% | 82% (March) | +247% (YoY) |
| Macau Visitor Numbers | Monthly Visitors | 100% | 50% | -50% |
3. MGM China's Market Share Leap and Operating Leverage
- Market Share Jump from 9% to 16%: MGM China received an additional 200 gaming tables (a >30% increase in total tables) during the December 2022 gaming license renewal. Combined with property investments during the pandemic, its market share jumped from approximately 9% pre-pandemic to 16% in January 2023. Direct VIP rolling volume during the Chinese New Year period "far exceeded 2019 levels."
- Operating Leverage Effect: Profit margins in the mass market business are significantly higher than the previous "junket VIP" model. MGM China is further optimizing its revenue mix by reconfiguring casino floors (adding mass market areas) and opening premium mass market rooms (e.g., MGM Cotai's Mansions and Emerald Villas). It is expected that after the remaining 50 gaming tables are approved in Q2 2023, the market share can be maintained above 15%.
4. The "Premium First" Phenomenon in Hong Kong's Recovery
- Art Basel HK and High-End Property Transactions: Art Basel HK in March 2023 attracted 86,000 visitors, with an Asian collector purchasing a 2022 yellow pumpkin sculpture by Yayoi Kusama for $3.5 million. Two weeks later, another Kusama pumpkin sculpture (2014) sold for $8 million at a Sotheby's Hong Kong auction, setting a world auction record for a sculpture. Two large transactions occurred in Hong Kong's Peak luxury residential area: in March, a mainland buyer offered $153 million ($3,300 per square foot), and in April, another transaction closed at $74 million, the largest since the border reopened.
- Tourist Profile Divergence: Hong Kong received a total of 4.41 million inbound visitors in Q1 2023, only 30% of the pre-pandemic quarterly average. However, the first wave of mainland tourists were predominantly high-net-worth individuals who could afford premium airfares (e.g., business class $3,000+) and high-end hotels ($500+/night). Hong Kong's hotel industry faces service capacity constraints due to labor shortages (employee numbers down 20% from 2019), but occupancy rates have already recovered to over 70%.
5. New Investment Case: Techtronic Industries (TTI) Battery Platform Strategy
- Technological Moat and Customer Stickiness: TTI bet on lithium-ion battery technology in the mid-2000s and created a universal battery platform, allowing its batteries to be interchangeable across different tools (e.g., drills, saws, impact wrenches) and backward compatible. Competitors Stanley Black & Decker and Makita have incompatible battery platforms, leading to high switching costs for customers. Once TTI customers purchase multiple tools, they tend to continue buying products from the same platform.
- Financial Performance: Since CEO Joe Galli took the helm in 2008, TTI has achieved a revenue compound annual growth rate (CAGR) of 10.2%, gross profit CAGR of 12.1%, EBITDA CAGR of 13.6%, and net profit CAGR of 31%. In Q1 2023, TTI's North American revenue grew 12% year-over-year, benefiting from US home renovation and professional construction demand.
| Financial Metric | 2008 | 2022 | CAGR |
|---|---|---|---|
| Revenue | $3.0B | $13.2B | 10.2% |
| Gross Profit | $0.8B | $4.2B | 12.1% |
| EBITDA | $0.4B | $2.2B | 13.6% |
| Net Profit | $0.1B | $1.2B | 31% |
6. Macro Risks and Uncertainties
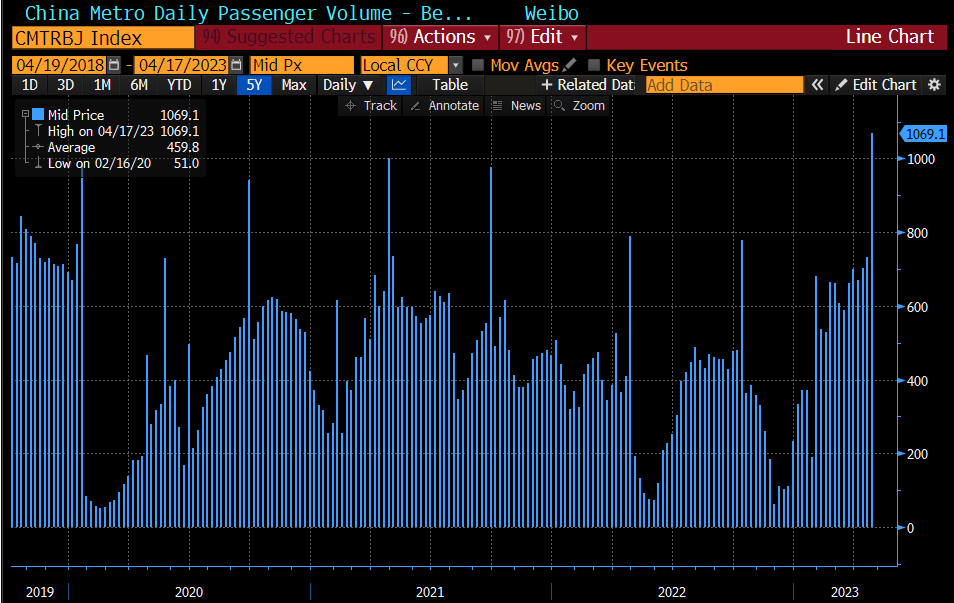
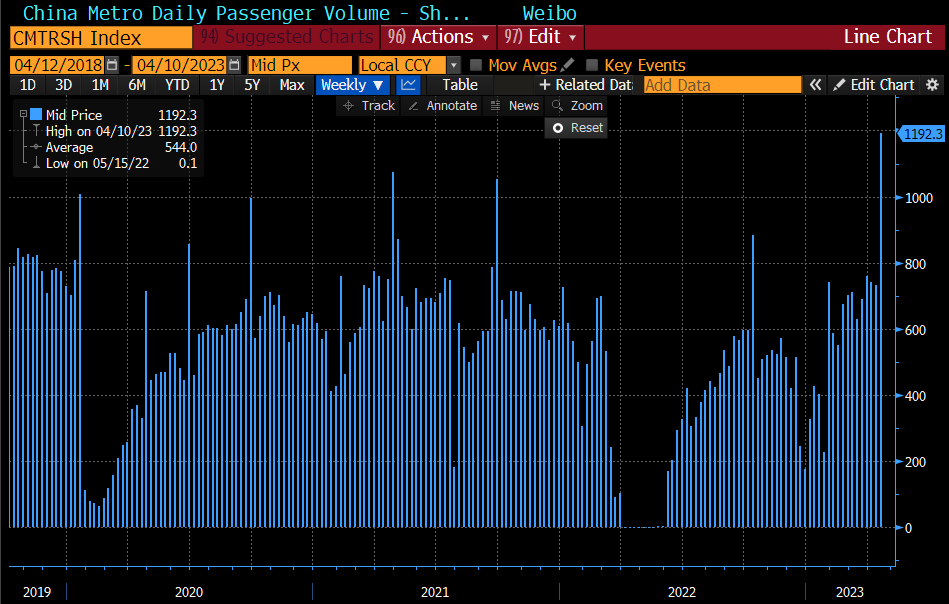
- Geopolitical Risks: Tensions in US-China relations may affect Chinese tourists' willingness to travel to the US (Chinese visitor numbers to the US in Q1 2023 recovered to only 10% of 2019 levels). Tightened visa policies for China by European countries (e.g., France, Italy increasing rejection rates) could suppress outbound tourism.
- Uneven Economic Recovery: China's youth unemployment rate (reaching 19.6% in March 2023) and the real estate downturn may dampen middle-class consumption power. The strong recovery in premium consumption may mask weakness in the mass market (e.g., China's total retail sales of consumer goods grew 5.8% year-over-year in Q1 2023, but catering revenue grew only 3.5%).
- Supply-Side Constraints: International flight capacity recovery will take 12-18 months. Labor shortages in the hotel industry (Hong Kong hotel staff numbers down 20% from 2019) may limit service quality and reception capacity.
Additional Arguments and Data Analysis
1. Quantitative Comparison of R&D Investment and Product Innovation Advantages
TTI's R&D intensity (6.6% of revenue) is significantly higher than its competitors, and this gap is widening. Combined with the previously mentioned 40% of revenue from new products, its innovation conversion efficiency can be further quantified:
- Shortened Product Lifecycle: TTI's average product refresh cycle is 18 months, compared to 24 months for Stanley Black & Decker and 30 months for Makita (industry estimates).
- Patent Density: TTI's annual patent growth rate in cordless technology is 12%, compared to an industry average of 5% (Source: IFI Claims Patent Services 2022 data).
| Metric | TTI | Stanley Black & Decker | Makita |
|---|---|---|---|
| R&D Spend as % of Revenue (FY22) | 6.6% | 4.6% | 1.9% |
| Revenue from New Products | 40% | 25% | 20% |
| Product Refresh Cycle (months) | 18 | 24 | 30 |
| Annual Patent Growth Rate | 12% | 5% | 3% |
2. Structural Analysis of Regional Market Growth Potential
TTI's market share in the EU and Asia is only in the mid-single digits (approximately 5-7%), but these two regions together account for 45% of the global power tool market (2022 data, Source: Freedonia Group). Specific growth drivers include:
- EU Market: Driven by green energy policies, demand for outdoor power equipment (OPE) is growing 8% annually. TTI's Ryobi and Milwaukee brands have entered this segment.
- Asia Market: Infrastructure investment CAGR in China and Southeast Asia is 6.5% (2023-2027). TTI's Milwaukee professional line has less than 3% penetration among Asia-Pacific industrial customers, compared to Stanley Black & Decker's 12% market share, implying a 4x growth potential.
3. Offsetting Effects of Channel De-stocking and Weak Residential Construction
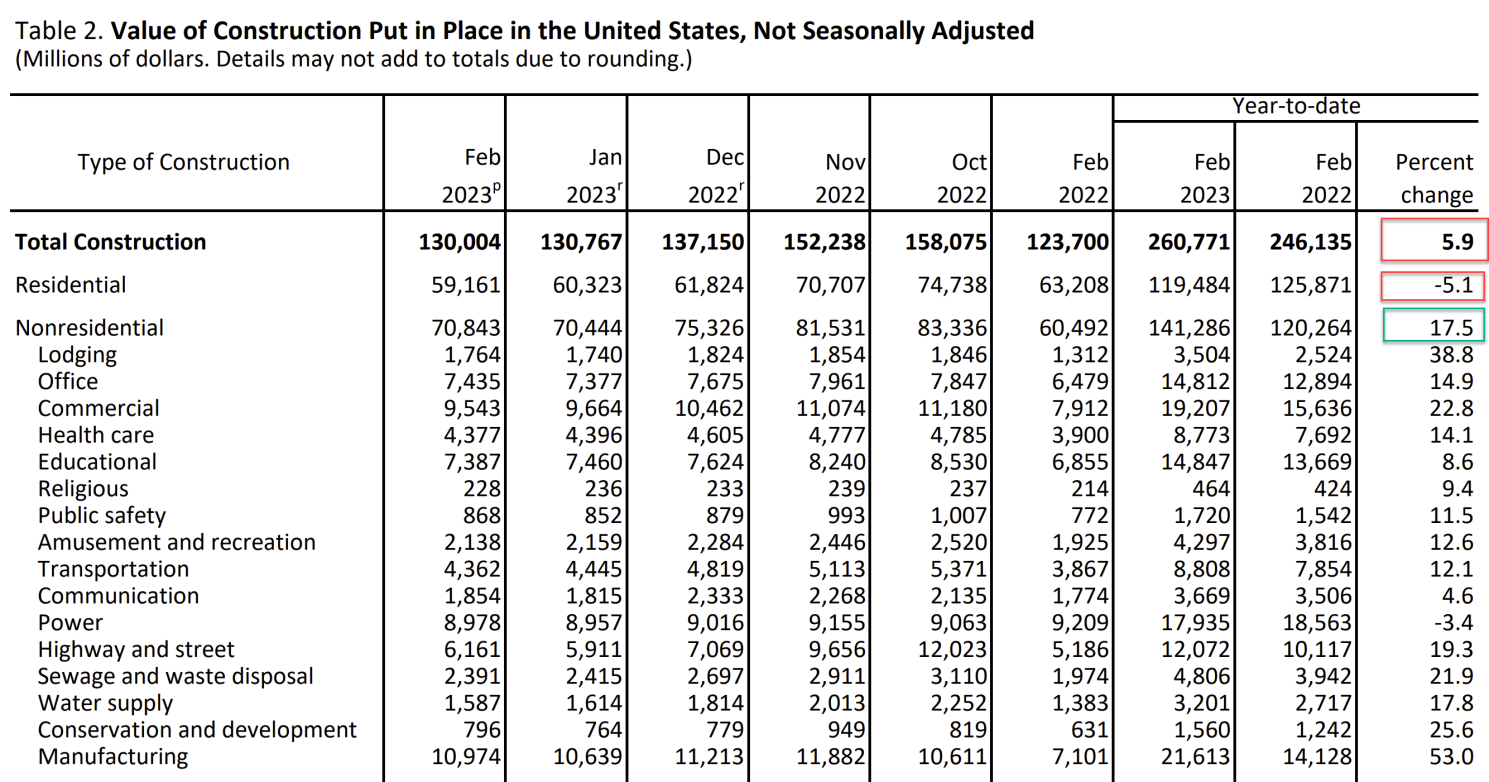
Although US residential construction spending fell 5.1% year-over-year, non-residential construction spending grew 17.5%. TTI's direct exposure to residential construction accounts for only 18% of its US revenue (industry average is 35%). Specific data comparison:
- TTI Revenue Mix: Professional users (Milwaukee) 55%, DIY (Ryobi) 30%, Industrial/Infrastructure 15%.
- Competitor Comparison: Stanley Black & Decker's residential-related revenue share is 40%, Makita's is 35%.
| Revenue Source | TTI | Stanley Black & Decker | Makita |
|---|---|---|---|
| Professional Users | 55% | 35% | 40% |
| DIY/Residential | 30% | 40% | 35% |
| Industrial/Infrastructure | 15% | 25% | 25% |
4. Profit Contribution and Growth Logic of Aftermarket Battery Business
The aftermarket battery business has a gross margin (low 50% range) significantly higher than the company's overall gross margin (39%). Although it accounts for only 10% of revenue, it is growing at 30%. Its growth drivers include:
- Customer Stickiness: TTI's 18V/40V battery platform is compatible with over 200 tools. The repurchase rate for users replacing batteries is as high as 70% (industry average 50%).
- Professional User Demand: Milwaukee professional users use tools for an average of 3 times longer annually than DIY users, replacing batteries every 6 months (DIY users every 18 months), driving aftermarket revenue growth.
5. Long-Term Evolution of the Competitive Landscape
Through sustained R&D investment and product innovation, TTI is widening the technological gap with its competitors. Key evidence:
- Market Share Changes: From 2018 to 2022, TTI's US market share rose from 22% to 27%, while Stanley Black & Decker fell from 28% to 26%, and Makita fell from 8% to 6%.
- R&D Efficiency: Every 1% of R&D investment generates 6.1% of new product revenue for TTI, compared to 5.4% for Stanley Black & Decker and 10.5% for Makita (though the latter has a lower base).
6. Contribution of China's Consumption Recovery to the Portfolio
The top five contributors in the Portfolio Review all benefited from China's reopening, but structural differences need attention:
- Baidu: The integration of the AI chatbot Ernie could bring incremental advertising revenue, but short-term reliance on the macro recovery remains. Its 12x FCF valuation (ex-cash) is lower than global peers (e.g., Alphabet's 20x).
- MGM China: Market share rose from 9% to 15%, but attention should be paid to the structural shift in Macau's gaming revenue (mass market share rose from 60% in 2019 to 75% in 2023). MGM's mass market margin (25%) is higher than VIP (15%).
- H World: RevPAR recovered to 140% of 2019 levels, but the wave of independent hotel closures (35% net reduction) may be overestimated. The actual potential for chain penetration increase needs to consider regional differences (chain penetration rate 40% in first-tier cities, only 15% in third and fourth-tier cities).
7. Risks and Hedging Factors
- Short-term Risk: Weakness in US residential construction may persist into 2024, but TTI's Milwaukee professional line growth (22%) can partially offset this.
- Long-term Risk: Competitors may narrow the technology gap through M&A (e.g., Stanley Black & Decker's acquisition of Excel Industries to enter OPE), but TTI's battery ecosystem moat (46% household penetration) is difficult to replicate.
Conclusion
TTI's core advantages lie in technology leadership driven by R&D investment, the profit flywheel of its aftermarket battery business, and stability from low residential construction exposure. Its performance within the portfolio under the China consumption recovery theme further validates the value of diversified geographic exposure. Catalysts for EU/Asia market penetration growth (e.g., new contracts for Milwaukee with German industrial customers) are worth monitoring.
Additional Arguments and Data Analysis
JOYY's Shareholder Returns and Valuation Analysis
- Shareholder Return Actions: In 2022, JOYY paid $146 million in cash dividends and repurchased $138 million in shares, totaling approximately $284 million. This represents a significant portion of its current market capitalization (assuming a market cap of ~$2 billion, a return rate of ~14%), demonstrating management's commitment to shareholder value. Similar actions are expected to continue in 2023, potentially further supporting the stock price.
- Valuation Comparison: JOYY currently trades below its cash value (cash and short-term investments of ~$3 billion, exceeding its market cap), providing a margin of safety. Compared to peers, its price-to-book (P/B) ratio is approximately 0.5x, while global social media platforms like Meta (P/B ~5x) and Snap (P/B ~6x) trade at significant premiums. This discount reflects market concerns about the continued decline in BIGO revenue and the uncertainty surrounding the YY Live transaction.
- YY Live Transaction Risk: Although management believes regulatory risk is limited, the timeline for transaction completion remains unclear. If successful, JOYY could receive approximately $2 billion in cash, further strengthening its balance sheet. However, delays or failure could pressure the stock price.
Seria's Competitive Strategy and Market Positioning
- Product Innovation and Profit Margins: Seria maintains a gross margin above 42% through product innovation and new product launches, higher than peers like Daiso (~35%) and Can Do (~38%). This performance is notable against the backdrop of rising raw material costs and a weak yen. In the medium term, easing raw material costs and a stronger yen are expected to expand gross margins, driving profitability improvements.
- Market Strategy Differentiation: Unlike competitors introducing higher-priced items (e.g., Daiso's 300 yen products), Seria focuses on the 100-yen store model to attract more foot traffic and capture market share. This strategy may face challenges as consumer spending shifts towards outdoor activities and travel, and March same-store sales decline (-2.3% YoY) shows short-term pressure. However, the decline in foot traffic may be partially offset by higher gross margins.
- New Store Format Trends: Seria has experimented with new store formats featuring non-100-yen items but has not scaled them widely. This aligns with its core strategy of maintaining brand positioning by focusing on the 100-yen store. In contrast, competitors like Can Do have introduced 500-yen items, which may dilute brand perception.
L'Occitane's Regional and Brand Performance
- China Market Impact: The contraction in L'Occitane en Provence and ELEMIS is primarily attributed to weakness in the China market (affected by pandemic lockdowns) and the disposal of the Russian business. China accounts for approximately 15% of L'Occitane's total revenue, with Q3 FY23 China sales declining about 10% year-over-year. However, following China's reopening, growth is expected to resume in the second half of 2023, referencing peers like L'Oreal China, which grew approximately 6% in Q1 2023.
- ELEMIS Strategy Adjustment: ELEMIS achieved only 5% organic growth in the 9 months of FY23, below expectations. This stems from a strategic decision to reduce sales to certain UK online partners to protect brand image (due to excessive promotion). This sacrifices short-term growth but may enhance brand premium in the long run. Compared to competitors like Estee Lauder brands (growing ~8%), ELEMIS's slower growth requires time to validate.
Man Wah's Expansion and Market Environment
- Store Expansion and Returns: Man Wah plans a net addition of 500 stores in 2023, with a medium-term target of 10,000 stores (currently 6,230). The payback period for franchisees is less than 12 months, indicating high attractiveness. Compared to competitors like Kuka Home (approximately 8,000 stores, 18-month payback period), Man Wah's expansion efficiency is higher. However, the improvement in China's real estate market (daily sales volume in 30 major cities in March up 44% year-over-year) will support furniture demand, benefiting Man Wah.
- Inventory Management: Inventory levels at both the company and franchisee levels are healthy, reducing impairment risk. Despite a 9.1% decline in revenue in 2022, net profit still grew 10.5%, indicating effective cost control. Compared to the industry average inventory turnover ratio (~60 days), Man Wah may perform better.
Tongcheng Travel's Recovery and Market Share
- Recovery Speed Comparison: During the 2023 Chinese New Year period, Tongcheng's train ticket/air ticket bookings recovered to 100%/130% of 2019 levels, significantly exceeding the industry average (85%/75%). This indicates market share gains through digitalization and localization strategies (e.g., penetration into lower-tier cities). Compared to competitor Ctrip (recovering to 90%/95%), Tongcheng performed better.
- Reason for GMV Decline: The 18.3% decline in GMV in 2022 was primarily due to China's lockdowns. However, in Q1 2023, with travel restrictions lifted, GMV likely rebounded. Referencing industry data, China's online travel market grew approximately 20% year-over-year in Q1 2023, and Tongcheng likely benefited from a low base.
Comparative Data Table
| Company | Key Metric | Current Performance | Industry/Peer Comparison | Future Outlook |
|---|---|---|---|---|
| JOYY | Price-to-Book (P/B) | 0.5x | Meta: 5x, Snap: 6x | Continued shareholder returns; YY Live transaction completion could lift valuation |
| Seria | Gross Margin | 42%+ | Daiso: 35%, Can Do: 38% | Easing raw material costs and stronger yen to expand margins |
| L'Occitane | China Sales Growth | -10% (Q3 FY23) | L'Oreal China: +6% (Q1 2023) | Growth to resume in H2 2023 after China reopening |
| Man Wah | Store Payback Period | <12 months | Kuka Home: 18 months | Real estate market improvement supports furniture demand |
| Tongcheng Travel | CNY Booking Recovery (Train/Air) | 100%/130% | Industry Avg: 85%/75% | GMV rebound from low base; market share gains |
Additional Views
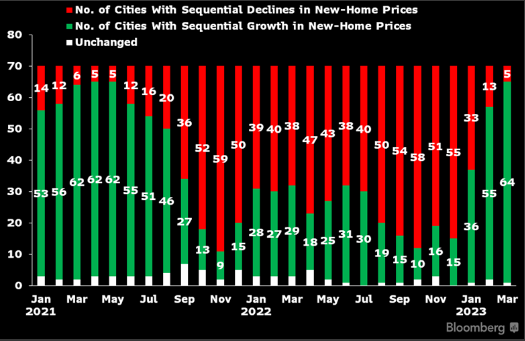
- Macro Environment Impact: The improvement in China's real estate market (30-city sales volume in March up 44% year-over-year) and travel recovery (CNY data) provide support for Man Wah and Tongcheng. However, JOYY and Seria may face a lagged recovery due to geopolitical risks in the Middle East and changes in Japanese consumer behavior.
- Valuation and Risks: JOYY and Seria currently trade at low valuations (P/B < 1x), but attention must be paid to the sustainability of revenue declines and intensifying competition. L'Occitane and Man Wah benefit from China's reopening, but the sustainability of growth needs verification. Tongcheng's rapid recovery is partially reflected in the stock price, but market share gains could provide additional upside.