Robotti & Company Advisors YE 2025 Letter
Robotti & Company is a New York deep-value boutique founded by Bob Robotti in 1983, specializing in left-for-dead cyclical industries — energy services, building products, shipping — with multi-year holding periods and occasional activist letters. It manages about $650m; Bob is regarded as one of the most steadfast Graham-tradition cyclical value hunters.
In plain words
This investment letter explains that markets often ignore improving fundamentals until a tipping point, then prices jump quickly. The author focuses on beaten-down industries like offshore energy and European banks, arguing they've become healthier after years of pain—weaker players gone, balance sheets fixed. But most investors still avoid them, creating opportunities for patient ones. Example: a stock fell from over $100 to $39, yet the company bought back shares aggressively, signaling deep undervaluation. Worth reading for a contrarian take on hidden value.
Robotti’s 2025 annual report centers on economist Dornbusch’s theorem, arguing that markets are not always efficient, and that there is a lag between changes in economic fundamentals and market perception, which creates opportunities for investors. The report emphasizes that prolonged downturns forc
Theme and Background
This chapter centers on economist Rudiger Dornbusch’s famous thesis as a core framework, discussing the limitations of market efficiency: economic fundamentals change slowly, but markets ignore these changes for extended periods, only to adjust rapidly once a tipping point is reached. The author argues that this "time lag between fundamental evolution and market perception" is precisely the source of opportunity for active investors.
Core Thesis
The author’s core investment argument is that cyclical industries following prolonged downturns are undergoing structural transformations, not merely short-term rebounds. Specifically:
- Prolonged downturns force industry consolidation, eliminate excess capacity, improve capital discipline, and shift cyclical industries from "persistent oversupply" to "structural scarcity."
- The widespread market mentality of "won’t get fooled again" keeps investors skeptical of improving industries, creating opportunities for those willing to look beyond the next quarter and across market cycles.
- Counterintuitive insight: Industries widely shunned as "bad businesses" may precisely be at the most favorable inflection points.
Key Arguments and Data
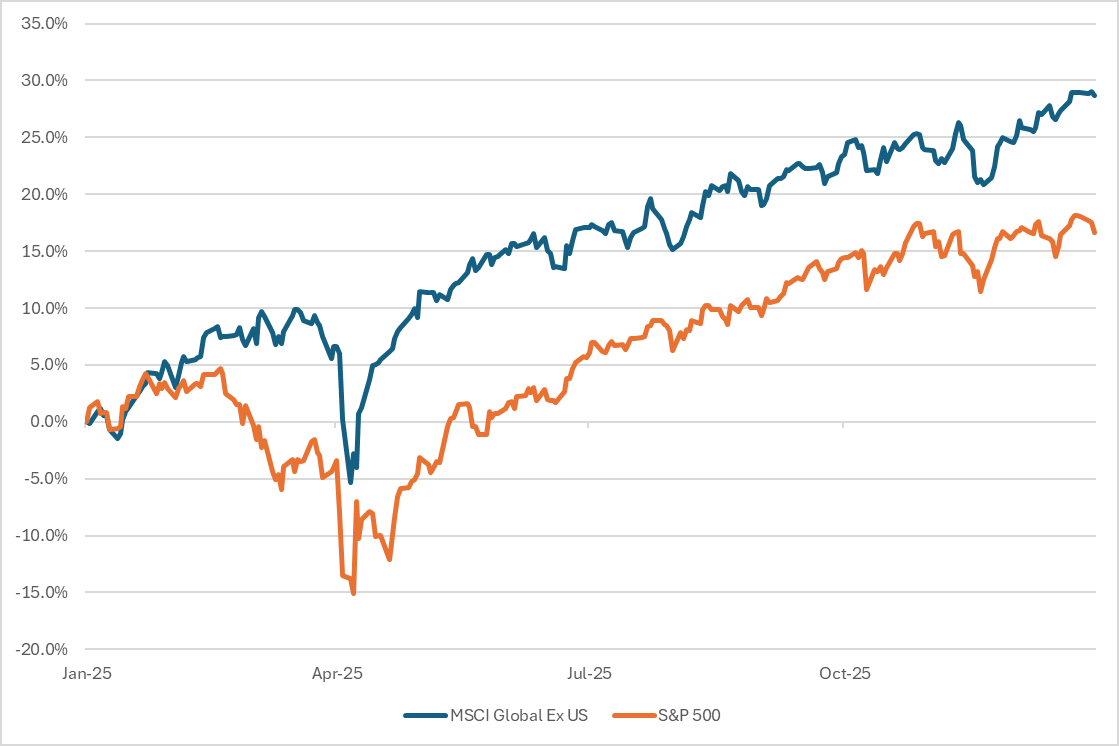
1. 2025 Market Validates Dornbusch’s Theorem
| Asset/Index | 2025 Performance | Context |
|---|---|---|
| MSCI World ex-USA | +31.9% | Outperformed S&P 500, reversing years of U.S. exceptionalism trend |
| S&P 500 | +17.4% | U.S. market relatively lagging |
| Nikkei 225 | +26.2% (2025); ~+100% over past 3 years | Revaluation of a market long viewed as a "capital graveyard" |
| STOXX Europe Banks Index | +67% (strongest since 1987) | Post-financial crisis restructuring, improved balance sheets, rising rates driving cash flows |
2. Gold and Bitcoin Rally Logic
- U.S. use of the dollar’s reserve currency status as an economic and political lever (expanding sanctions, restricting capital flows) prompts sovereign and institutional entities to seek politically neutral stores of value.
- Growing demand for non-sovereign monetary assets (Bitcoin), initially expected as "stable money," results in "significantly appreciating assets."
- Persistent global inflation and perceptions of unsustainable fiscal discipline drive safe-haven allocations.
3. Market Structure Issues
- Passive flows, algorithmic trading, and narrative-driven market structures accelerate excessive price reactions in both directions.
- Asset allocation has evolved into "asset concentration": capital is concentrated in a few popular asset classes, draining funds from historically underperforming areas.
- The author believes this positions fundamental-focused stock pickers favorably.
4. Case Study: Overreaction to Policy Comments
- Trump’s remarks that Fannie Mae/Freddie Mac might need to buy more MBS triggered a single-day surge in housing-related stocks: Builders FirstSource soared, and Home Depot added tens of billions in market cap in one day.
- The author questions whether these companies truly became more valuable overnight.
5. Author’s Personal Experience: Offshore Energy Sector
- Stocks like Tidewater rapidly revalued from deeply discounted levels over several months, reflecting much of the expected multi-year earnings growth.
- The rapid rise was built on years of underinvestment and industry consolidation.
Companies/Assets Involved
| Company/Asset | Role | Key Data | View |
|---|---|---|---|
| Builders FirstSource | Housing supply chain | Single-day surge after policy comments | Example of narrative-driven overreaction |
| Home Depot | Housing retail | Tens of billions added in market cap in one day | Same as above |
| Tidewater | Offshore energy services | Rapid revaluation from deep discount over months | Author’s personal case, validating structural shift after prolonged downturn |
| Gold | Safe-haven asset | Sustained rally | Bullish: rising demand for politically neutral stores of value |
| Bitcoin | Non-sovereign monetary asset | Significant appreciation | Bullish: growing demand for non-sovereign assets |
| Japanese equities (Nikkei 225) | Long-neglected market | +26.2% in 2025, ~+100% over 3 years | Bullish: revaluation underway |
| European banks (STOXX Europe Banks Index) | Industry once written off as "structurally broken" | +67% in 2025 | Bullish: earnings potential unleashed after restructuring |
Investment Implications
1. Focus on abandoned industries: Seek areas where capital has largely exited but fundamentals are improving (e.g., housing, offshore energy, data storage mentioned by the author). These industries often undergo consolidation, cost discipline improvements, and balance sheet repair.
2. Accept non-linear recovery paths: Cyclical recoveries are rarely straight-line upward, but long-term direction can be predicted. Investors need patience, not a chase for short-term narratives.
3. Exploit market overreactions: When policy comments or narratives trigger sharp but fundamentally unsupported price moves, it presents contrarian positioning opportunities.
4. Beware of asset concentration risk: Under current market structure, passive capital is concentrated in a few popular assets, making neglected areas potentially offer better risk-adjusted returns.
This is an analysis of the continuation of the "Introduction" section, maintaining the previous style while adding new arguments, data, and perspectives without repeating previously analyzed content.
3. Patient Capital and Non-Linear Value Realization: From Historical Templates to Current Cases
The core argument of the continuation is that the path to investment returns is non-linear, and patient capital is the only guarantee to navigate this non-linearity. Through historical cases and current holdings, the author demonstrates a significant time lag between fundamental improvement and market perception, which is precisely the source of excess returns.
3.1 Historical Template: Building Materials Distribution Post-2009
Using the building materials distribution industry after the 2009 housing crash as an example, the author provides a classic template of "industry cleansing – structural improvement – non-linear recovery." Key data points for this case include:
- Depth of Industry Cleansing: The 2009 crisis was not a simple cyclical downturn but a "prolonged and severe downturn," forcing "deep structural changes." This included capacity rationalization, balance sheet repair, exit of weak competitors, and industry consolidation (M&A).
- Non-Linearity of Recovery: Even the best operators (e.g., Builders FirstSource) experienced multiple "nearly 50 percent" drawdowns in their stock prices. This powerfully refutes the simplistic logic that "fundamental improvement equals linear stock price appreciation."
- Core Insight: The author explicitly states that these drawdowns "were not signs of failure, but part of the process." This reinforces the necessity of patient capital—only capital that can withstand 50% drawdowns can ultimately capture the value return after industry cleansing.
3.2 Current Case: The "Non-Linear Runway" of Offshore Energy Services
The author applies the above historical template to the current offshore energy services industry, providing more detailed logic and data support.
Industry Cleansing and Structural Reset:
- Supply-Side Shock: Between 2020 and 2024, the prolonged downturn "permanently removed a meaningful portion of global supply." This is the most fundamental change on the supply side.
- Cost-Side Improvement: Surviving companies achieved "substantial efficiency gains" through "rightsizing and operational discipline," making many offshore projects economical even at oil prices well below recent levels.
- Demand-Side Resilience: The author emphasizes that current activity growth is not driven by "speculative enthusiasm" but by the "economic necessity of offsetting natural production declines and replacing existing supply." This provides solid fundamental support for demand sustainability.
Market Perception vs. Fundamentals Divergence:
- Investor Behavior: The author observes that investor behavior is "far less disciplined." The sector was "enthusiastically embraced" in 2023 and early 2024, then "abruptly abandoned" in the second half of 2024 due to cyclical concerns. This "capitulation" contrasts sharply with the "remained intact" fundamentals.
- Pricing Signal: The author notes that current price levels are "still insufficient to incentivize new supply." This means supply tightness is unlikely to ease in the near term, providing room for future price increases.
Quantitative Analysis of the Tidewater Case:
Using Tidewater as an example, the author vividly illustrates "Mr. Market’s" "manic-depressive behavior" and how patient capital can exploit such volatility.
| Metric | Author’s Action/Observation | Company Action | Market Implication |
|---|---|---|---|
| Stock Price > $100 | Reduced exposure ("reduced exposure") | Not mentioned | Market sentiment overheated, valuation may have priced in excessive optimism |
| Stock Price ≈ $39 (Early 2025) | Not mentioned, but implied as a buying opportunity | Aggressively repurchased shares ("aggressively repurchased shares") | Company believes its value is significantly undervalued; management and market perception diverge sharply |
| Free Cash Flow Yield | Consistently generated "double-digit free cash flow yields" | Used capital to "increase per-share value" | Company fundamentals are strong, and capital allocation discipline is sound, ensuring value creation |
Key Insight: The author reduced holdings when the stock price was above $100, while the company aggressively bought back shares at around $39. This divergence in "contrarian action" precisely illustrates the tug-of-war between patient capital and market sentiment. The author believes that as industry activity continues to increase, earnings will "reaccelerate," and market perception will "once again be forced to adjust."
4. Conclusion: Potential Rotation in Market Leadership and Recurring Patterns
In the conclusion, the author elevates the above specific cases into a universal investment philosophy.
- Recurring Pattern: The author believes these cases reflect a "broader and recurring pattern": Unpopular industries undergo a "cathartic period" and then re-emerge "stronger, more disciplined, and structurally improved." This is not unique to 2025.
- Market Leadership Rotation: The author notes that the current market is characterized by the "prolonged success of a relatively narrow set of sectors." This phenomenon of capital being highly concentrated in a few "perceived winners" inevitably creates valuation extremes in other areas ("areas where capital has been slow to return despite improving fundamentals"). The author views this "delayed recognition" as "part of a repeatable pattern" and potentially signaling the "early stages of a broader rotation in market leadership."
- Diversification and Patience: In a world that is "quickly and profoundly changing," the emergence of new winners is highly probable, inevitably leading to "dispersion of investment performance." This further reinforces the importance of "disciplined, fundamental research and patience."
Summary: Through a comparison of historical and current examples, the continuation constructs a complete investment logic loop: Industry cleansing → Structural improvement → Lagging market perception → Non-linear value realization → Patient capital profits. The author not only argues for the necessity of "patience" but also, through the quantitative Tidewater case, demonstrates how to use "patience" for contrarian positioning during extreme market sentiment. Ultimately, the author elevates this pattern to a prediction of market leadership rotation, serving as the theoretical foundation for the long-term effectiveness of their investment strategy.