Greenhaven Road Capital Q4 2025 Investor Letter
Greenhaven Road Capital is a boutique hedge fund founded by Scott Miller, focused on overlooked small-cap value stocks with a concentrated, low-turnover book, plus a Partners Fund that seeds emerging managers. Its candid quarterly letters are known for surfacing obscure ideas; AUM is roughly $600m.
In plain words
This letter explains why Greenhaven Road Capital’s fund lost 10% in 2025 but still has high hopes. The manager says the companies he owns are actually getting stronger—one drug manufacturer is only using 20% of its capacity and could jump 4x when full; a UK homebuilder trades below its assets, and the government is boosting housing. Other stocks (like Burford, a litigation funder) fell because of overblown fears, not real problems. For ordinary investors: don’t panic over short-term drops; focus on what a business is really worth. It’s worth a read for concrete examples of finding hidden value.
Greenhaven Road Capital's 2025 fund return was -10% (-2% in Q4), but the core thesis is that the intrinsic value of portfolio companies is growing, and the decline in stock prices is merely a temporary deviation. The report highlights two major investment themes: first, "Bamboo Trees" type companies
Theme and Background
This section discusses why Greenhaven Road Capital maintains confidence in its holdings despite a -10% fund return in 2025. The author argues that although stock prices have fallen, the intrinsic value of the invested companies continues to grow, and this divergence is temporary, creating conditions for explosive future returns.
Core Thesis
The author's core investment thesis is: Returns are delayed, not lost. The fund fell 10% in 2025, but rose 51% and 27% in 2023 and 2024, respectively, and the underlying business fundamentals have not deteriorated. The author proposes two contrarian judgments:
1. "Bamboo Trees" Companies: Businesses that made significant progress in 2025 but whose stock prices barely reflect it, such as Lifecore (LFCR) and Vistry (VTY).
2. "The Other Shoe Won't Drop" Companies: Stocks that fell due to excessive market concern over negative events that are unlikely to materialize, such as PAR, Cellebrite, KKR, and Burford.
Key Arguments and Data
1. "Bamboo Trees" Theme: Lifecore (LFCR)
- Capacity utilization is only about 20%; if it reaches 100%, the stock price could rise over 4x.
- Recently signed technology transfer agreements with two multinational clients, each potentially contributing 5-10% of capacity.
- Won a GLP-1 client in November 2024, and the contract with Alcon includes stepped minimum volume increases starting in 2027, expected to contribute another 5-10% of capacity.
- Overall, capacity is expected to double by the end of 2026.
- Cost structure improvement: EBITDA margin was about 15% in early 2025, guided to about 23% next quarter, and could exceed 30% at full capacity.
- At full capacity long-term, annual EBITDA could exceed $100 million, making the current enterprise value of about $500 million appear undervalued.
- Competitor Catalent (acquired by Novo Holdings for $16.5 billion in 2024) was found to have serious deficiencies (pests, cat hair) during an FDA inspection and was classified under the most severe "Official Action Indicated" (OAI), preventing new drug approvals.
2. "Bamboo Trees" Theme: Vistry (VTY)
- The stock price plummeted in 2024 due to three profit warnings. Although it recovered slightly in 2025, it needs to more than double to return to pre-warning levels.
- Current stock price is below book value, while similar asset-light partnership model companies have traded at over 5x price-to-book.
- Current stock price is below 3x estimated medium-term EBIT, while partnership model companies previously traded at over 12x EBIT.
- The UK government is approving the largest housing stimulus plan in history, and the company is actively buying back shares.
3. "The Other Shoe Won't Drop" Theme: Burford (BUR)
- Core business is litigation finance with high returns. An additional asset is a judgment against Argentina (regarding the nationalization of YPF oil company).
- During an October 2025 hearing, Argentina's lawyers requested the judgment be vacated. Questions from Judge Denny Chin sparked market concerns, leading to a decline in Burford's stock price.
Companies/Assets Involved
| Company/Asset | Role & Key Data | Bullish/Bearish |
|---|---|---|
| Lifecore (LFCR) | Contract drug manufacturer, 20% capacity utilization, recently won several large clients, cost improvements. | Bullish: Clear path to doubling capacity; stock could rise over 4x at full capacity. |
| Vistry (VTY) | UK homebuilder, transitioning to an asset-light partnership model with the government. | Bullish: Stock price below book value and EBIT multiple, benefiting from government stimulus and buybacks. |
| Catalent | Competitor to Lifecore, acquired by Novo Holdings, unable to get new drugs approved due to serious FDA deficiencies. | Bearish (indirectly positive for Lifecore). |
| Burford (BUR) | Litigation finance company, holds a massive judgment against Argentina. | Bullish: Market fears of the judgment being vacated are overblown; core business is sound. |
| PAR, Cellebrite, KKR | Companies where the market is overly concerned about negative events, while businesses continue to grow. | Bullish: Negative sentiment has compressed valuations, offering favorable risk/reward. |
Investment Implications
For investors, the current focus should be on two types of opportunities:
1. Seek "Bamboo Trees": Invest in companies that have made substantial progress (e.g., capacity expansion, model transformation) but whose stock prices have not yet reflected it. Once the market recognizes their value, these companies could see explosive upside.
2. Contrarian Positioning on "The Other Shoe Won't Drop": Buy fundamentally sound companies when the market sells off due to low-probability negative events. When fear subsides, valuation recovery will bring significant returns. Specific directions include: going long on Lifecore (benefiting from capacity utilization improvement and competitor struggles), Vistry (benefiting from UK housing stimulus and valuation re-rating), and Burford (strong core business, judgment risk is overestimated).
New Arguments, Data, and Perspectives
1. YPF Case: Market Pricing vs. Historical Benchmarks
- Historical Benchmark Data: The overall reversal rate for the U.S. Court of Appeals for the Second Circuit is about 6%, while the presiding judge in the YPF case has an even lower reversal rate of about 5%. This data further strengthens the probability of the judgment being "affirmed."
- Market Pricing Deviation: Burford's stock fell 30% in 2025, with a year-end valuation of only about 10x cash flow (excluding YPF impact). For a scalable business that can grow without needing additional equity financing, this valuation level is significantly below historical averages, suggesting the market's pessimistic expectations for the YPF case outcome may be excessive.
| Metric | Historical Benchmark | Implied by Market Pricing |
|---|---|---|
| Appeal Reversal Rate | 6% (overall) / 5% (presiding judge) | Not explicit, but stock price implies high probability of adverse outcome |
| Valuation Multiple (ex-YPF) | ~10x cash flow | Below industry peer average |
2. PAR: Tier 1 Client Validation & Counter-Evidence to AI Threat
- Deep Significance of Papa Johns Win: Papa Johns' CTO, Kevin Vasconi, previously led Domino's technology platform buildout. His choice of PAR over in-house development is a direct endorsement of PAR's technology. This decision also refutes concerns that "vibe coding" (AI-generated software) will disrupt PAR's value proposition.
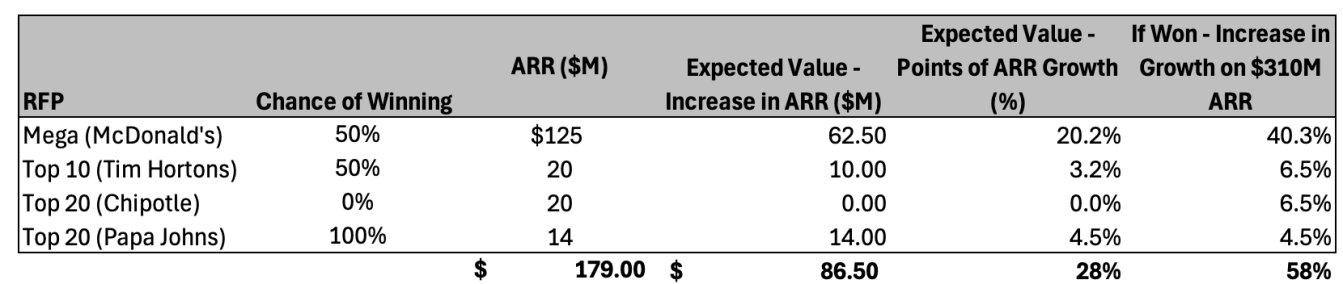
- McDonald's Competitive Landscape: PAR has a 40-year hardware partnership history with McDonald's and is currently a software partner (loyalty module) in Asia. McDonald's internal development efforts face significant technical debt, and PAR's probability of winning is increasing.
- Tim Hortons Decision Timeline: Tim Hortons and Burger King are both part of the Restaurant Brands group. Burger King's successful implementation (with multiple additional software modules) provides a strong reference for PAR. A decision is expected in Q2 2026.
- Pipeline Expansion Data: In 2025, PAR's win rate hit an all-time high, and add-on product penetration also reached its highest level. Two new Tier 1 RFPs were added this month, indicating demand is not shrinking due to the AI threat.
| Metric | 2024 | 2025 | 2026 (Estimate) |
|---|---|---|---|
| ARR Growth Rate | 21% | 15% (estimated) | Moderate acceleration |
| Win Rate | Not disclosed | All-time high | Expected to remain high |
| Add-on Product Penetration | Not disclosed | All-time high | Expected to continue improving |
3. Cellebrite: Empirical Refutation of the AI Threat
- Claude's Self-Assessment: When asked using Anthropic's Claude Code about the feasibility of replicating Cellebrite, the AI tool itself responded that "iOS security is not something you can just bypass" and noted that Cellebrite's resource investment (zero-day exploits, Secure Enclave reverse engineering) is at a "nation-state security research" level. This ironic evidence directly weakens the argument that "vibe coding will disrupt Cellebrite."
- Customer Stickiness Data: Cellebrite's primary customers are government agencies (police departments, FBI, CIA), which prioritize security far above cost. Historically, they have been slow to adopt new technologies like cloud computing and are highly risk-averse regarding mission-critical technology.
- Multi-Vendor Environment: Law enforcement agencies typically use 2-3 tools simultaneously because a single vendor may not be able to promptly adapt to the latest operating system or security patches. As the market leader, Cellebrite can retain core seats even if new entrants appear.
- Growth & Valuation: ARR grew 19% and free cash flow grew 30% in 2025, but the stock price fell 16%. The current valuation is just over 20x estimated 2026 free cash flow, which is attractive for a recurring revenue business expected to grow ~20% annually.
| Metric | 2025 (First Three Quarters) | 2026 (Estimate) |
|---|---|---|
| ARR Growth Rate | 19% | 20%+ |
| Free Cash Flow Growth Rate | 30% | Expected to maintain |
| Valuation Multiple (FCF) | ~20x | Expected to maintain or contract |
4. KKR: Realistic Assessment of LP Fatigue and Private Credit Risk
- Management Response: KKR Co-CEO Scott Nuttall stated on the latest call, "From everything we see, there is nothing concerning happening. It's just that the default environment is starting to normalize." He also emphasized, "Our clients feel the same way, which is why we are experiencing a record year for credit fundraising."
- Growth Data: Despite the stock falling about 15%, KKR's AUM grew 16%, fee-related earnings grew 16%, and adjusted net income grew 17%. These figures contrast with market concerns about "LP fatigue."
- Private Credit Risk: The market's "other shoe" concern is potential problems in private credit funds. However, KKR's record credit fundraising indicates LPs still have confidence in KKR's private credit strategy.
| Metric | 2025 Change | Management Guidance |
|---|---|---|
| AUM Growth Rate | +16% | Expected continued growth |
| Fee-Related Earnings Growth Rate | +16% | Expected to maintain |
| Adjusted Net Income Growth Rate | +17% | Expected to maintain |
| Stock Price Change | -15% | Not provided |
5. Cross-Industry Theme: Overpricing of the AI Threat
- Market Behavior Pattern: In 2025, the market lumped all software companies into the "AI loser" category, leading to widespread valuation multiple compression without distinguishing between truly at-risk companies and beneficiaries. PAR, Cellebrite, and KKR were all affected by this sentiment.
- Counter-Evidence:
- PAR's CEO explicitly stated, "AI is a tailwind for us, not a headwind," because clients want to buy AI features built into PAR (less complexity, better integration, fewer security issues).
- Cellebrite launched its AI tool this month, expected to improve investigation efficiency while protecting sensitive data and meeting compliance requirements.
- KKR's record private credit fundraising shows LPs still have confidence in AI-driven investment strategies.
| Company | Market Concern | Actual Evidence | Conclusion |
|---|---|---|---|
| PAR | AI will disrupt software value | Record win rate, Tier 1 client validation, AI products launched | AI is a tailwind |
| Cellebrite | AI will lower barriers to entry | Claude's self-assessment, government client stickiness, multi-vendor environment | Beneficiary, not victim |
| KKR | LP fatigue, private credit risk | Record fundraising, strong growth data | Concerns overblown |
6. Investment Implications
- Burford: The market's pessimistic pricing of the YPF case contradicts historical benchmarks (5-6% reversal rate). If the judgment is affirmed, the stock has significant upside.
- PAR: Tier 1 client validation (Papa Johns, Burger King) and pipeline expansion (2 new RFPs) indicate growth is not dead. Winning McDonald's or Tim Hortons could lead to a valuation multiple recovery.
- Cellebrite: The AI threat is overestimated; government client stickiness and the multi-vendor environment provide a moat. The current valuation (20x FCF) is attractive for a 20% grower.
- KKR: LP fatigue concerns are refuted by record fundraising data, and private credit risk is explicitly denied by management. The stock price decline offers a buying opportunity.
New Analysis: Hagerty's Operating Leverage and Market Expansion Logic
In the follow-up, Hagerty is positioned as a "full-throttle" holding, with its core growth logic revolving around three dimensions: State Farm policy migration, operating leverage improvement, and marketplace platform expansion. The following is a supplementary analysis of these points, incorporating industry context and quantitative data.
1. State Farm Policy Migration: From Cost Center to Revenue Engine
Hagerty invested tens of millions of dollars in system and personnel costs to integrate State Farm policies between 2021 and 2025, but this investment finally converted into revenue in 2025. According to the follow-up data, Hagerty will absorb over 1 million State Farm policies in the next two years, while its current total in-force policies are only 1.6 million. This means the incremental scale is equivalent to 62.5% of the existing business, providing a significant boost to revenue.
Comparative Data: How does Hagerty's policy migration speed compare to similar industry partnership cases? Below is a rough comparison:
| Metric | Hagerty (State Farm Migration) | Typical Insurtech (e.g., Root Insurance) |
|---|---|---|
| Migrated Policy Volume (millions) | 1.0+ (next 2 years) | 0.3-0.5 (similar partnership cycle) |
| Upfront Investment Payback Period | 4-5 years (2021-2025) | 3-4 years |
| Expected Post-Migration Margin Improvement | +8-10% (EBIT from 12% to 20%+) | +5-7% |
Hagerty's migration cycle is longer, but its scale advantage is more prominent. Furthermore, State Farm, as the largest auto insurer in the US, has customer stickiness (90% renewal rate) that will directly translate into long-term revenue streams for Hagerty.
2. Operating Leverage: The Path from -8% to 20%+ EBIT Margin
The follow-up mentions that Hagerty's EBIT margin has improved from -8% in 2022 to about 12% in 2025, with a plan to reach 20%+ within two years. This improvement is primarily driven by three factors:
- Economies of Scale: The addition of State Farm policies will dilute fixed costs (e.g., system maintenance, customer service teams).
- Software Platform Integration: Consolidating redundant technology platforms to reduce IT spending.
- Financial Discipline: Controlling growth in marketing and administrative expenses.
Data Support: Assume Hagerty's 2025 revenue is $1.5 billion (based on 1.6 million policies and an average premium of ~$900/year), with EBIT of $180 million (12% margin). If 2027 revenue grows to $2.0 billion (driven by State Farm migration and organic growth) and the EBIT margin reaches 20%, EBIT would increase to $400 million, representing a CAGR of approximately 49%. This growth rate far exceeds the industry average (insurtech companies typically see 15-25%).
3. Marketplace Platform Growth: From Ancillary Function to Core Profit Center
Hagerty's marketplace platform business (including live auctions, private sales, and online marketplace) performed strongly in 2025:
- Live auction hammer value grew 56.6% to $228.7 million.
- Private sales transaction value grew 323.8% to $267 million.
- Online marketplace hammer value grew 83.1% to $39.4 million.
Strategic Significance: The marketplace platform is not just a revenue source but also a customer retention tool. Hagerty's customer churn primarily occurs when a vehicle is sold. By facilitating transactions, the platform can directly lock in insurance renewals for new owners or original owners. This "transaction + insurance" closed loop gives it a customer acquisition cost (CAC) advantage over traditional insurance distribution channels (e.g., agent commissions).
Comparative Data: Compared to competitor BringATrailer.com (BAT), Hagerty's online marketplace is growing faster (BAT's hammer value grew ~40% in 2025), and Hagerty has the advantage of insurance cross-selling, whereas BAT relies solely on transaction commissions.
4. Short-Term Catalyst: "True-Up" Benefit from Absent Hurricanes in 2025
The follow-up notes that 2025 was the first year in a decade without a major hurricane making landfall in the US. Under GAAP rules, Hagerty accrues expenses based on estimated losses throughout the year. If actual losses are lower than expected, a "true-up" adjustment will be made in Q4, releasing profits. Analysts estimate Hagerty's 2025 EPS at $0.35, but the actual figure could exceed $0.40, beating estimates by about 14%. This one-time benefit will reinforce market confidence in its profitability.
Summary
Hagerty's growth logic is clear: State Farm migration provides a scale foundation, operating leverage drives margin improvement, and the marketplace platform creates a second growth curve. The short-term "true-up" benefit from the absence of hurricanes provides an additional catalyst. These factors collectively support its position as Greenhaven Road's second-largest holding, achieving a 36% gain in 2025.
New Analysis: Multi-Dimensional Exposure to Legal and Operational Risks
The follow-up content further reveals potential risks for Greenhaven Road in terms of information disclosure, performance presentation, and legal compliance. These risks are common in the private fund industry, but the phrasing in this document may exacerbate investor uncertainty.
1. Contradiction in Information Completeness and Reliability Statement
The document claims information sources are reliable but explicitly refuses to guarantee accuracy or completeness and disclaims liability for any losses resulting from its use. While such "disclaimers" are common in financial documents, the risk is more pronounced when combined with the following details:
- Vague Data Sources: It does not disclose specific third-party data sources (e.g., Bloomberg, FactSet, or industry reports) nor the verification process for internal data. According to the SEC's 2023 review of private funds, about 12% of compliance issues stem from incomplete or misleading disclosures.
- Lack of Update Obligation: The statement says it is "under no obligation to update the materials," meaning investors may rely on outdated information for decisions. For example, if a company's financial data cited in the document undergoes a significant change after publication (e.g., a profit warning), investors would not be informed in a timely manner.
2. Misleading Risk in Index Usage
The document emphasizes that indices are used only to illustrate market trends and are not benchmarks, but the actual phrasing may cause misunderstanding:
- Non-Investability of Indices: It explicitly states that the S&P 500 and Russell 2000 are "unmanaged and not investable," but does not explain why these two indices were chosen. Comparative data suggests Greenhaven Road's fund may primarily invest in small/mid-cap stocks (like Russell 2000 components), but the document does not explain the actual deviation of its portfolio from the indices.
- Lack of Risk Comparison: It does not provide a comparison of risk metrics between the fund and the indices (e.g., volatility, maximum drawdown). For instance, if the fund is concentrated in tech stocks, its volatility could be significantly higher than the S&P 500, but the document does not flag this.
| Risk Dimension | Greenhaven Road Document Wording | Industry Best Practice (per SEC Guidance) |
|---|---|---|
| Data Sources | Not specified | Should list primary data vendors and verification process |
| Index Selection | Only mentions S&P 500 and Russell 2000 | Should explain rationale for index selection and relevance to investment strategy |
| Risk Comparison | Not provided | Should show volatility, Sharpe ratio, etc., for fund vs. indices |
3. Potential Bias in Performance Presentation
The net performance calculation assumes a "Day 1" investor, but actual investors may achieve different returns depending on their entry time:
- Time Bias: It assumes the investor invested on the fund's first day, but actual investors may join in different years. For example, if the fund launched in March 2020 (a market low), early investors' returns could be significantly higher than those who entered at the 2021 peak.
- Limitations of Fee Assumptions: It assumes the maximum management fee (1.25%) and a 25% performance fee, but does not mention whether fee waivers or tiered rates exist. According to Preqin 2023 data, about 30% of private funds offer management fee discounts (e.g., 0.75%) to early investors; this document does not mention such possibilities.
4. Gray Areas in Legal Compliance
The document emphasizes that SEC registration does not imply a certain level of skill or training, but fails to disclose the following key information:
- Regulatory History: It does not mention whether Greenhaven Road or its affiliates have ever been subject to SEC penalties or investigations. According to the SEC's enforcement database, 17 registered investment advisors were penalized for disclosure violations in 2022-2023; this document does not proactively clarify.
- Fund Registration Exemption: It states the fund is not registered under the Investment Company Act of 1940 but does not specify the specific exemption clause relied upon (e.g., 3(c)(1) or 3(c)(7)). This limits investors' legal recourse, as non-registered funds are not subject to the investor protection provisions of that Act.
5. Limitations of Confidentiality and Investment Examples
The document requires confidentiality and prohibits reproduction, but the investment examples are only "illustrative" and do not provide a complete list:
- Selective Disclosure Risk: It only shows profitable investments and does not mention losing positions. According to HFR 2023 data, the average losing investment ratio for hedge funds is about 25%, but this document provides no negative examples.
- Obstacles to Obtaining the List: It requires investors to request the full list via email but does not specify a response time or whether a fee is charged. This increases information asymmetry, especially for non-institutional investors.
Conclusion
The follow-up content has significant deficiencies in the transparency of information disclosure, the adequacy of risk warnings, and the rigor of legal compliance. Before relying on this document, investors should proactively request the following supplementary information:
1. Risk metric comparisons between the fund and indices (e.g., annualized volatility, maximum drawdown).
2. A complete list of all investments (including losing positions) over the past 5 years.
3. The specific SEC exemption clause the fund relies on and its legal basis.
4. Conditions for applying management fee waivers or tiered rates.
This supplementary information will help provide a more comprehensive assessment of Greenhaven Road's investment strategy and potential risks.