Robotti & Company Advisors Q1 2014 Letter
Robotti & Company is a New York deep-value boutique founded by Bob Robotti in 1983, specializing in left-for-dead cyclical industries — energy services, building products, shipping — with multi-year holding periods and occasional activist letters. It manages about $650m; Bob is regarded as one of the most steadfast Graham-tradition cyclical value hunters.
In plain words
This is a letter from Robotti fund to clients in early 2014. They don't try to predict natural gas prices next week. Instead, they bet on a long-term trend: America's energy revolution makes gas cheap, and many companies will benefit. Two years ago, when gas prices hit bottom, most investors ran away. Robotti bought energy service companies instead. Now prices have recovered, and their bet paid off. For regular investors, the lesson is: don't panic over short-term ups and downs. Focus on companies with real advantages that can make money for years.
Robotti’s first-quarter 2014 report shows that its Value Equity Composite posted a net return of 4.28%, outperforming the benchmark (Russell 2500 Value Index) return of 3.52%. The core view of the report is to adhere to a long-term investment strategy, refraining from predicting short-term fluctuati
Theme and Background
This chapter is the opening section of Robotti’s first-quarter 2014 letter to clients, primarily reviewing the fund’s performance and articulating its core investment philosophy—avoiding predictions of short-term natural gas price fluctuations and instead focusing on long-term trends and companies’ durable competitive advantages. The market backdrop is that North American natural gas prices have rebounded from one-eighth of the energy-equivalent value of oil two years ago to one-quarter currently, with investor sentiment shifting from avoiding natural gas risk to seeking companies with unhedged exposure.
Core Views
- Performance: The Robotti Value Equity Composite delivered a net return of 4.28% in the first quarter, outperforming the benchmark (Russell 2500 Value Index) at 3.52%.
- Investment Philosophy: The author explicitly states an inability to predict short-term natural gas price movements but firmly believes the U.S. energy revolution is a long-term trend, positioning the portfolio accordingly.
- Contrarian Judgment: When natural gas prices were at historic lows, most investors sought to hedge risk, while Robotti took the opposite approach, heavily investing in energy service companies and businesses benefiting from low-cost energy. The recent price recovery validates the effectiveness of this long-term strategy.
Key Arguments and Data
- Performance Comparison:
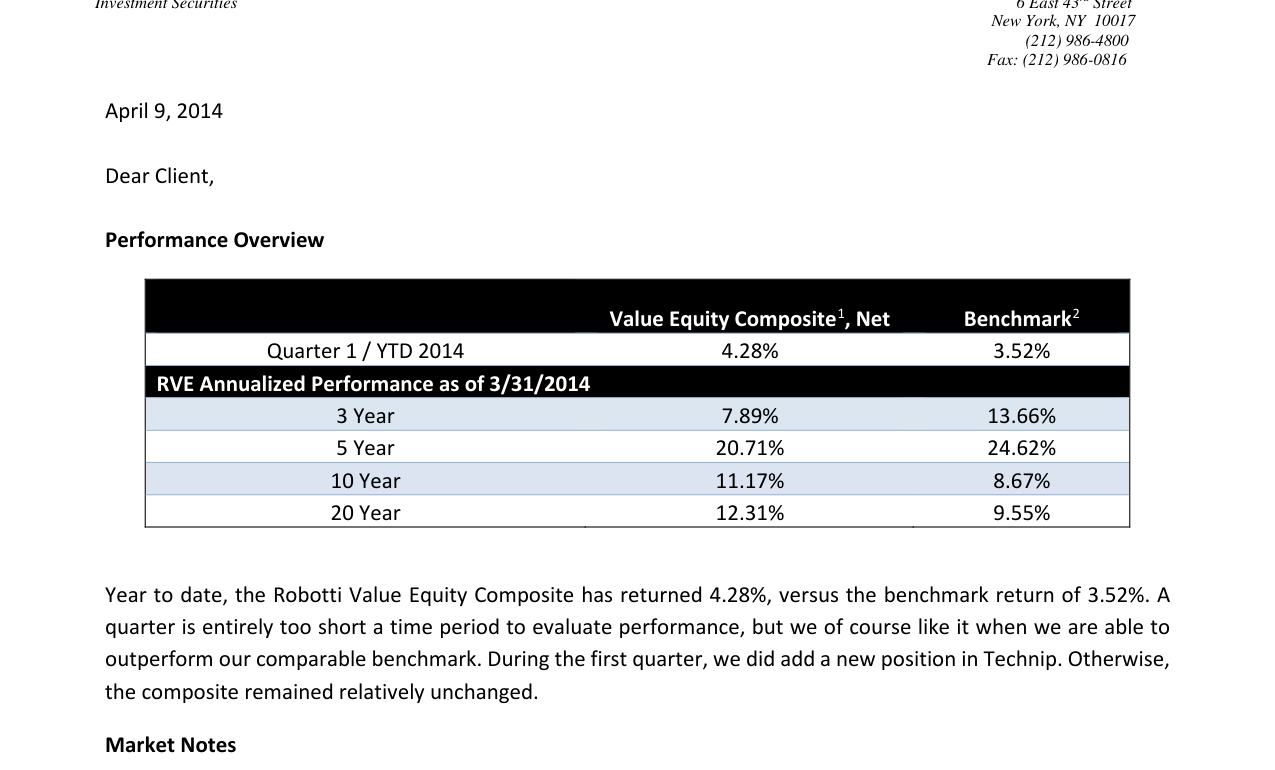
The Robotti Value Equity Composite returned 4.28% in the first quarter of 2014, outperforming the benchmark at 3.52%, and achieved a 20-year annualized return of 12.31% versus the benchmark’s 9.55%
| Metric | Robotti Value Equity Composite (Net) | Benchmark (Russell 2500 Value Index) |
|---|---|---|
| Q1 2014 / YTD | 4.28% | 3.52% |
| 3-Year Annualized | 7.89% | 13.66% |
| 5-Year Annualized | 20.71% | 24.62% |
| 10-Year Annualized | 11.17% | 8.67% |
| 20-Year Annualized | 12.31% | 9.55% |
- Natural Gas Price Changes: Two years ago, North American natural gas prices were only one-eighth of the energy-equivalent value of oil; recently, they have rebounded to one-quarter. The author believes that even with the narrowing spread, there is still significant room to go (“miles left to go”).
- Investment Positioning: The fund has heavily invested in energy service companies and businesses benefiting from low-cost U.S. energy. The author argues that the recovery in natural gas prices will highlight the systemic advantages of these companies.
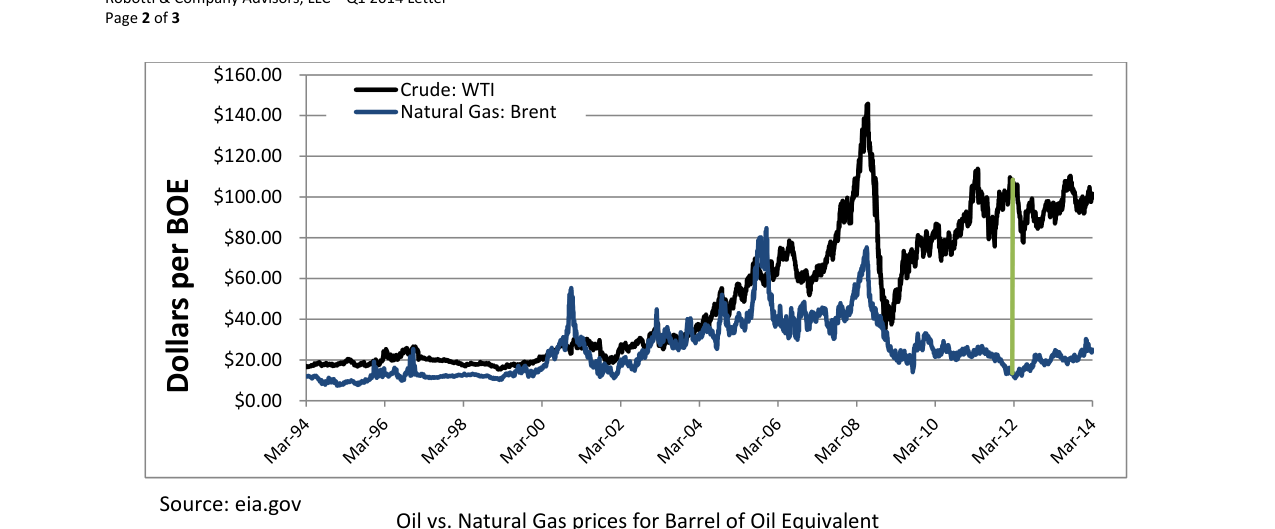
From 1994 to 2014, WTI crude oil prices rose from under $20 to around $100, while natural gas prices remained below $30 for an extended period, with the spread diverging significantly after 2008
Companies/Assets Involved
- Technip: A new position added in the first quarter. No further details are provided, but it indicates the author’s positive outlook on its prospects.
- Energy Service Companies: The fund has made significant investments, though no specific names are mentioned. The author believes these companies will benefit from the U.S. energy revolution.
- Businesses Benefiting from Low-Cost Energy: Again, no specific names are given, but the logic is that these companies gain a competitive advantage from the U.S. energy cost advantage.
Investment Insights
- Adhere to a Long-Term Strategy: The author emphasizes that short-term fluctuations (e.g., weather-driven changes in natural gas prices) are unpredictable and should be viewed as buying or selling opportunities rather than systemic shifts. Investors should focus on long-term trends (such as the U.S. energy revolution) and companies with durable competitive advantages.
- Monitor the Natural Gas/Oil Spread: Although the spread has narrowed recently, the author believes there is still substantial room. Investors should focus on companies with unhedged natural gas exposure that directly benefit from the widening spread.
- Leverage Market Sentiment: When most investors avoid risk due to low prices, it is the time for contrarian positioning. Robotti invested heavily when natural gas prices were low, and the current price recovery validates this strategy.