Robotti & Company Advisors Q2 2015 Letter
Robotti & Company is a New York deep-value boutique founded by Bob Robotti in 1983, specializing in left-for-dead cyclical industries — energy services, building products, shipping — with multi-year holding periods and occasional activist letters. It manages about $650m; Bob is regarded as one of the most steadfast Graham-tradition cyclical value hunters.
In plain words
This letter explains how to profit from buying cheap stocks that the market has abandoned. The key example is Builders FirstSource (BLDR), a construction company. In 2014, its stock price dropped sharply even though the business was fine. The author bought more shares, and later BLDR bought a big competitor, nearly doubling the stock price. For ordinary investors, the lesson is to stay patient and not panic over short-term bad news. If the company is solid, its price will eventually reflect its true value. Worth reading for a real-world case of contrarian investing and long-term holding.
Robotti's research report discusses a strategy for achieving long-term excess returns by investing in low-priced stocks. The core argument is that bad news is typically already priced into cheap stocks, and investors should control their emotions and focus on business fundamentals rather than waitin
Theme and Background
This chapter is a quarterly letter from Robotti & Company to its partners, focusing on a strategy of achieving long-term excess returns by investing in low-priced stocks. The author uses Builders FirstSource (BLDR) as an example to illustrate the investment logic of buying during an industry downturn and patiently holding until industry consolidation materializes. The market backdrop is the deep depression in the U.S. housing market after 2008, yet a structural demand gap persists.
Core Views
- Good Things Eventually Happen to Low-Priced Stocks: Bad news is typically already priced in, while upside potential is often overlooked. Investors should control their emotions and focus on business fundamentals rather than waiting for uncertainty to dissipate.
- The Future of Cyclical Businesses Is Highly Predictable: Cycles will eventually reverse, but the timing is uncertain. Patiently holding discounted shares of high-quality companies can avoid permanent capital loss.
- Contrarian Judgment: The author argues that "volatility = risk" is a misconception. Short-term price declines actually create opportunities, as long as long-term conviction remains unchanged.
Key Arguments and Data
1. BLDR Case:
- In Q3 2014, when the stock price fell over 30%, the author believed its economic value far exceeded the market price, based on industry dynamics, competitive position, and normalized earnings potential.
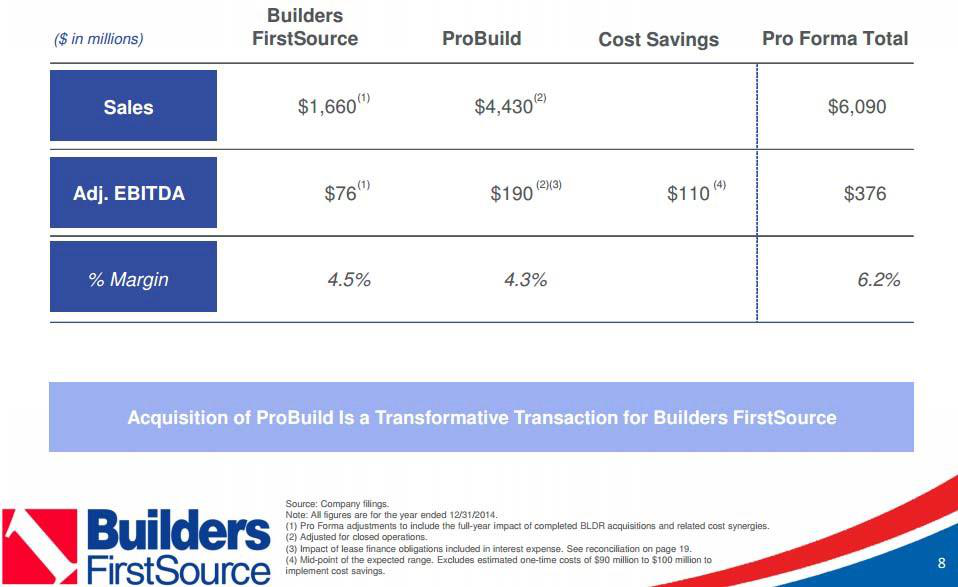
- On April 13, 2015, BLDR acquired ProBuild Holdings for $1.63 billion. The stock price surged from $6.90 on April 10 to $11.57 on April 13, nearly doubling.
- The author's Q3 2014 letter forecast for BLDR at normalized (non-peak) levels: revenue of $2.5 billion, EBITDA of at least $150 million, and 100 million shares outstanding ($1.50 per share). Post-merger new forecast: revenue of at least $10 billion, EBITDA of at least $800 million, and 110 million shares outstanding (EBITDA grows 5x, shares increase only 10%).
- The average cost in managed accounts was approximately $2.50. The closing price on June 30, 2015, was $12.84, up nearly 100% from Q3 2014 and 5x the initial investment.
2. Housing Market Data:
- In November 2013, single-family housing starts reached an annualized 710,000 units (the highest since March 2008), but then fell 4.9% in December and another 13.6% in January to 583,000 units, indicating a non-linear recovery.
3. Comparison Data Table:
| Metric | Q3 2014 Forecast (Pre-Merger) | Post-Merger New Forecast (2015) |
|---|---|---|
| Normalized Revenue | $2.5 billion | $10 billion |
| Normalized EBITDA | $150 million | $800 million |
| Shares Outstanding | 100 million | 110 million |
| EBITDA per Share | $1.50 | $7.27 |
Companies/Assets Involved
- Builders FirstSource (BLDR): Core case, bullish. After acquiring ProBuild, it became the largest LBM company in the U.S. The author believes there is still significant upside.
- Norbord (TSX:NBD): Another housing sector target with a similar opportunity yet to materialize, bullish.
- Ainsworth Lumber, Gibraltar Industries, Cavco Industries, UMH Properties: Other companies in the housing-related portfolio, bullish.
- Energy Sector Companies: The author believes the energy recovery will be in full swing over the next three years, and survivors will have growth potential, with current valuations extremely low.
Investment Insights
- Precision Is Not a Prerequisite for Investment When the Gap Between Price and Value Is Large: Investors should focus on "margin of safety" and "the vast difference between economic value and market value," rather than short-term volatility.
- Patience and Discipline Are Key: Identifying a company is only half the battle; investors also need the temperament to stick to their convictions and not be scared off by market noise.
- Industry Consolidation Is a Catalyst: The BLDR case shows that survivors in cyclical industry downturns can significantly enhance profitability and valuation through M&A. Investors should look for similar companies in consolidation phases (e.g., the energy sector).
Continuation Analysis: Market Sentiment, Long-Term Trends, and Value Anchoring
I. Price Volatility vs. Value Divergence: Data Revealing Irrationality
The continuation uses the stock price volatility of Builders FirstSource (BLDR) as a starting point to show how market sentiment causes short-term disconnects between price and value. From April to September 2014, BLDR's stock price plunged 45% from its 52-week high of $9.40 to $5.104, yet the company's fundamentals did not deteriorate — in fact, it added $43 million in revenue through three acquisitions, and net debt only increased slightly from $290 million to $319 million. Enterprise value (EV) plummeted from $1.2 billion to $830 million, a decline of 31%, while both revenue and earnings improved over the same period.
Key Data Comparison:
| Metric | April 4, 2014 | September 29, 2014 | Change |
|---|---|---|---|
| Diluted Shares Outstanding | 97.6 million | 100.8 million | +3.3% |
| Net Debt | $290 million | $319 million | +10% |
| Enterprise Value (EV) | $1.2 billion | $830 million | -31% |
| Revenue (TTM) | ~$1.55 billion | ~$1.6 billion (incl. acquisitions) | +3.2% |
| EBITDA Margin | 4.1% | 4.4% | +30bp |
Conclusion: The market discounted the same company by 31% in six months, while fundamentals did not deteriorate. This confirms Graham's assertion: short-term price fluctuations are the emotional outbursts of "Mr. Market," not a true reflection of intrinsic business value.
II. The Consensus Trap: Reflexivity of Forecast Uniformity
The continuation points out that when forecasters reach a consensus, that outcome is often the least likely to occur. In 2012-2013, the market consensus was that U.S. real estate had entered a "rebound mode," but after new home starts declined in early 2014, the consensus quickly reversed. This "all-or-nothing" mindset is a classic manifestation of the "anchoring effect" and "herd behavior" in behavioral finance.
Historical Data Support:
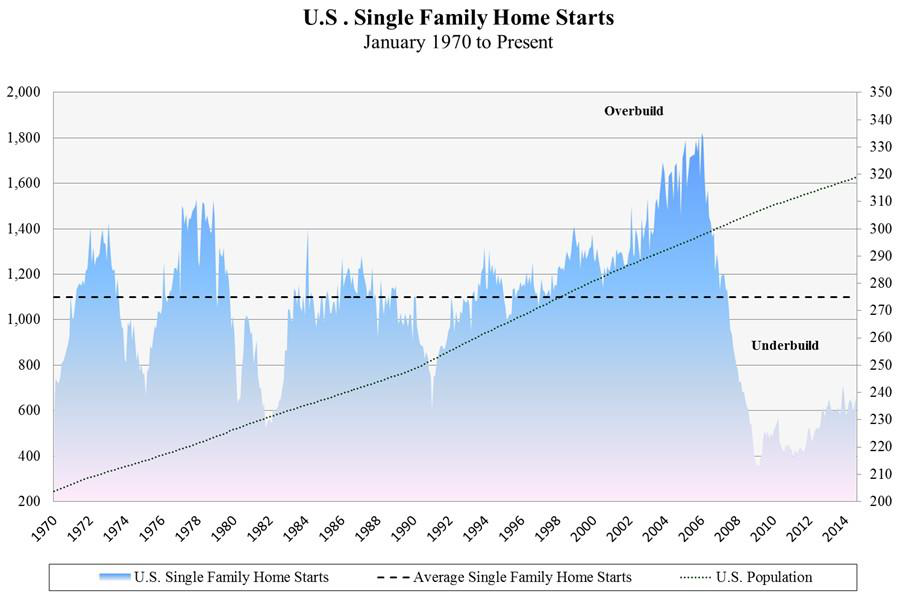
- In January 2006, U.S. new home starts peaked at an annualized 2.3 million units, then plunged 80% to 478,000 units in April 2009.
- Single-family home starts fell from a peak of 1.8 million units in November 2005 to 353,000 units in March 2009.
- After the 2008 financial crisis, the market consensus was bearish on real estate for a long time, but the rebound in 2012-2013 proved the consensus could be wrong.
Insight: When the market is uniformly bearish, it often means pessimistic expectations are fully priced in, and contrarian investing at that point can yield excess returns. BLDR's low point in September 2014 was a value trough following extreme market pessimism.
III. Long-Term Trends: Mean Reversion and Structural Growth
The continuation uses long-term data to argue that current single-family home starts (643,000 units) are far below the post-1970 average (1.05 million units/year), and the U.S. population has grown 56% (1970-2014), with the number of households increasing 46% (1980-2010). This means that even without considering a cyclical rebound, mere mean reversion could drive at least a 60% increase in starts.
Key Assumptions and Calculations:
- Conservative Scenario: Single-family home starts return to 1.05 million (30-year average), BLDR revenue would reach $2.5 billion (based on $2,399 per start revenue efficiency).
- Normalized EBITDA Margin: 6% (4.1% in 2013, 4.4% TTM), corresponding to pre-tax earnings per share of approximately $1.05.
- Valuation Comparison: At the October 10, 2014 closing price of $4.92, the P/E ratio was only 4.7x, far below the reasonable valuation for non-capital-intensive distribution companies (typically 10-15x).
Industry Consolidation Dividend: The top five companies in the building distribution industry (ProBuild, 84 Lumber, BLDR, BMC, Stock Building Supply) hold only a 25% market share. Long-term consolidation will drive revenue growth beyond the industry cycle. BLDR's revenue per start increased from $1,534 in 2009 to $2,399 in 2013, a CAGR of 11.8%, with consolidation effects already evident.
IV. Time Arbitrage: The Competitive Advantage of a Long-Term Perspective
The continuation introduces the concept of "time arbitrage" — when most investors focus on 3-6 month short-term fluctuations, long-term investors with a 3-5 year horizon can gain a significant advantage. The BLDR case is a practical application of this strategy: the market sells off due to short-term pessimism, while long-term investors buy based on mean reversion and industry consolidation logic.
Historical Case Support:
- Cal-Maine Foods: In 2013-2014, egg price volatility caused sharp stock price swings, but the company's industry leadership and cost advantages delivered strong long-term returns.
- Skechers: In Q3 2013, the market sold off on growth slowdown concerns, but the company's product innovation and overseas expansion led to a doubling of the stock price over the next two years.
Core Logic: Short-term uncertainties (e.g., interest rate policy, quarterly earnings) are unpredictable, but long-term structural trends (e.g., population growth, industry consolidation) can be grasped. When the price is below intrinsic value, the margin of safety is wide enough to invest without precise valuation.
V. Margin of Safety: Vague Correctness Over Precise Error
The continuation emphasizes that the BLDR investment opportunity was not based on precise valuation, but on the vague judgment that "the gap between price and value is large enough." In September 2014, BLDR's EV/EBITDA was only about 5x (based on TTM EBITDA), while comparable distribution companies (e.g., Fastenal, W.W. Grainger) typically trade at 10-15x. Even under conservative assumptions, BLDR's intrinsic value was far above its $830 million EV.
Quantified Margin of Safety:
- If normalized EBITDA is $150 million (based on $2.5 billion revenue × 6% margin), EV/EBITDA is 5.5x, while the industry average of 12x corresponds to an EV of $1.8 billion, implying potential upside of 117%.
- Even if the EBITDA margin only holds at 4.4%, normalized EBITDA is $110 million, and an EV/EBITDA of 7.5x is still below the industry average.
Conclusion: When the gap between price and value is vast, investors do not need to calculate intrinsic value precisely. As Graham said: "Price is what you pay; value is what you get." The BLDR case proves that when market sentiment causes a significant price deviation, long-term investors should use "time arbitrage" to capture excess returns.