Is This Purgatory, Or Is It Hell?
GMO is a Boston asset manager co-founded in 1977 by Jeremy Grantham with Richard Mayo and Eyk Van Otterloo, known for valuation-driven dynamic asset allocation built on long-horizon mean reversion. Grantham is famous for calling historic bubbles, warning publicly ahead of both the 2000 dot-com crash and the 2008 financial crisis. Flagship publications include the GMO Quarterly Letter (now written by Asset Allocation co-heads Ben Inker and John Pease), Grantham's Viewpoints essays and the 7-Year Asset Class Forecast.
In plain words
This piece explores two possible futures for markets: a temporary low-return 'purgatory' or a permanent low-return 'hell.' For everyday investors, it means your traditional stock-and-bond mix (like 65% stocks, 35% bonds) might deliver less than you expect. In a 'hell' scenario, your retirement savings could end up 21% smaller. It also explains why some strategies, like selling put options (a bet that markets won't crash), can beat expensive hedge funds in certain conditions. Worth reading because it shows why you can't just rely on old investment habits—you need to think about which path we're on.
In GMO's Q3 2014 report, Is This Purgatory or Hell?, analyst Ben Inker points out that despite the S&P 500 rising 8.3% year-to-date, the MSCI World Index gaining 3.7%, and the Barclays U.S. Aggregate Bond Index increasing 4.1%, the current market faces two paths: one is "Purgatory"—a temporary state
Theme & Background
This chapter discusses the two paths currently facing financial markets — "Purgatory" and "Hell" — and their profound implications for long-term investment returns and asset allocation. Author Ben Inker notes that despite the S&P 500 rising 8.3%, the MSCI World Index gaining 3.7%, and the Barclays U.S. Aggregate Bond Index advancing 4.1% in the first three quarters of 2014, the market's forward-looking signals are far more concerning than historical performance. The core question is: Is the current state of low returns temporary (Purgatory) or permanent (Hell)?
Core Thesis
The author's central judgment is that the market stands at a fork between two distinctly different paths, and investors cannot actively choose which path to take — they can only react passively. The counterintuitive conclusion is:
- If in "Hell" (permanently low returns), the traditional 65% stock / 35% bond portfolio remains reasonable, but expected returns will be several percentage points lower than historical levels.
- If in "Purgatory" (temporarily low returns), neither stocks nor bonds are sufficiently attractive; allocations should be reduced in favor of cash or more niche risk assets.
Key Arguments & Data
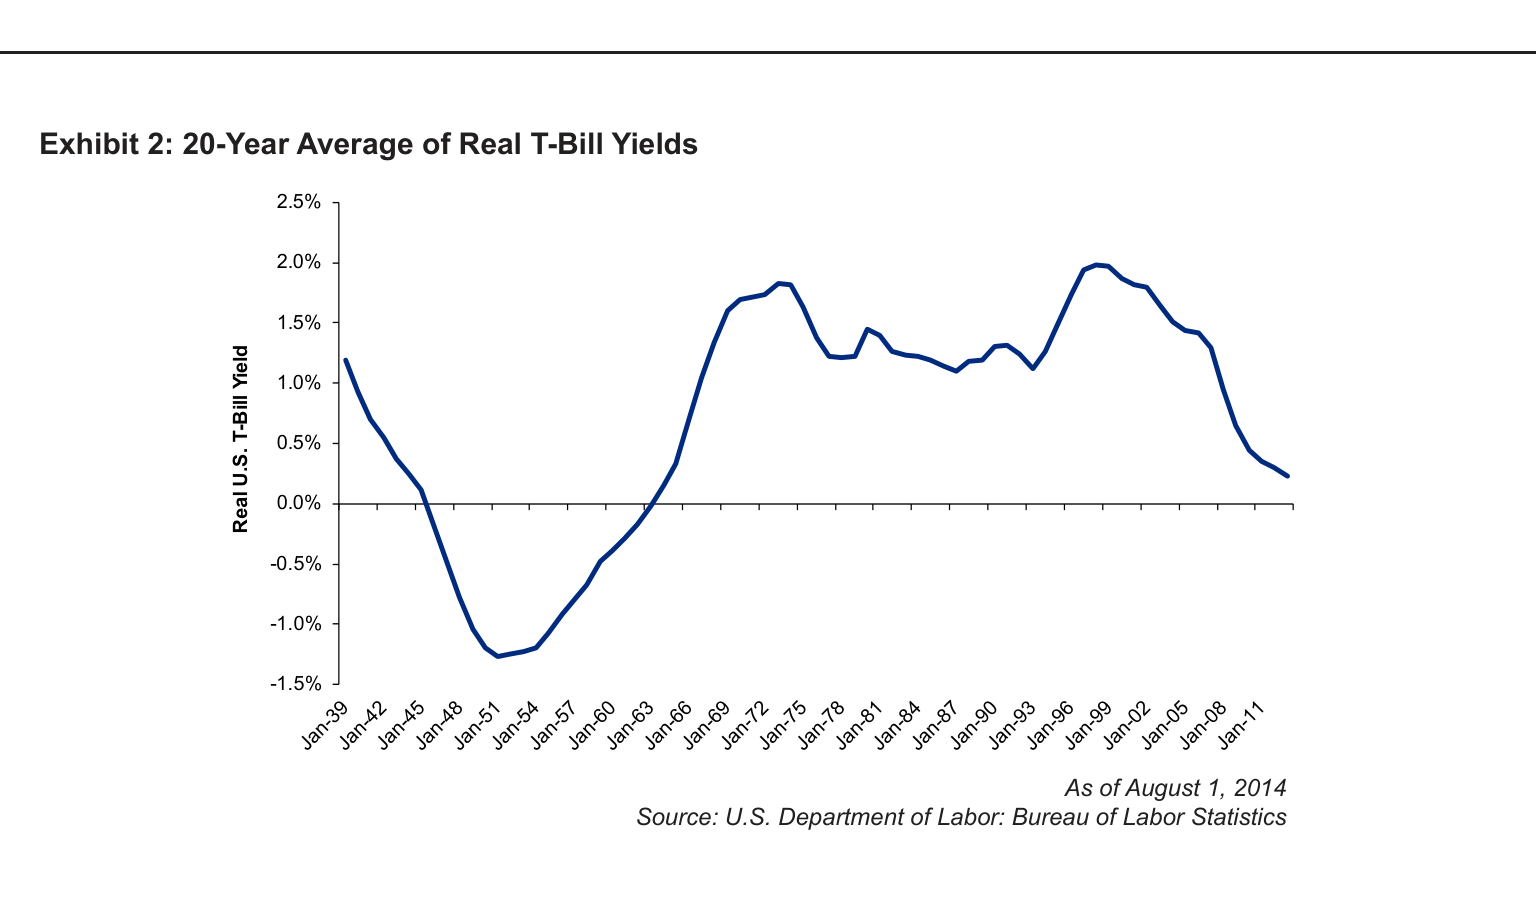
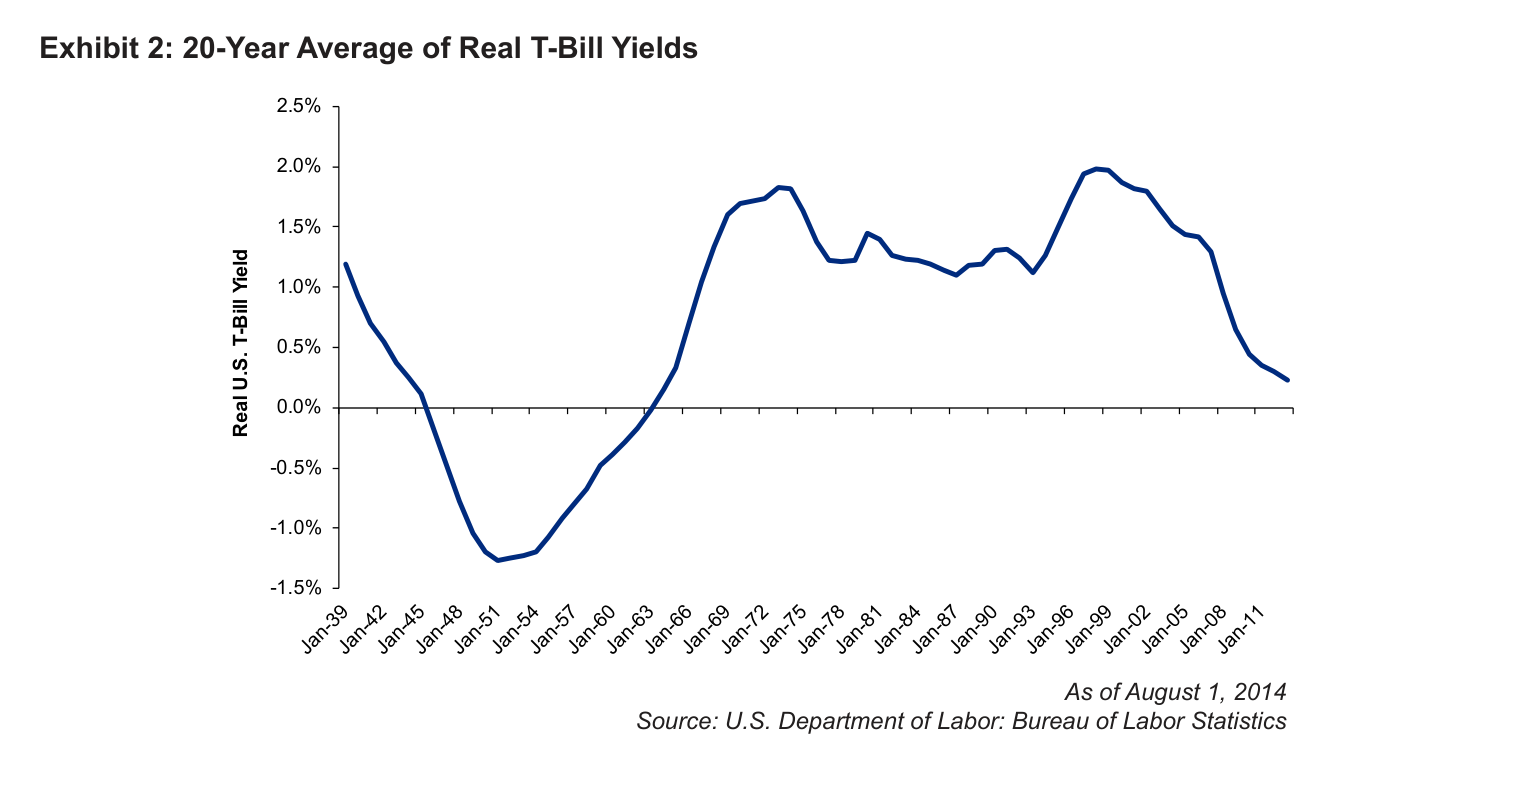
1. Long-Term Uncertainty of Cash Rates: Using historical data, the author shows that the 20-year moving average of U.S. T-Bill real yields still fluctuates between -1% and +2%. This range has a massive impact on fair value estimates:
- If the long-term cash rate rises from -1% to +2% real yield, the fair P/E ratio of the stock market would fall from 29x to 15x.
- This range of fluctuation makes asset valuations based on cash rates almost "useless."
2. Internal GMO Disagreement on Cash Rates: At an internal investment meeting in September 2014, the GMO team was nearly split on the consensus for long-term cash rates:
- Base case: Developed market real cash rates average approximately 1.25% over the long term.
- Secular stagnation case: Real cash rates average approximately 0% over the long term.
- The post-meeting survey average was 0.75%, but nearly half of the members believed rates would remain near zero for an extended period.
3. Return Estimates Under the "Hell" Scenario: If the long-term cash rate is 0% real yield, then:
- The expected real return of a 65% stock / 35% bond portfolio would fall from 4.7% to 3.4%.
- This implies a 28% decline in sustainable spending, effectively wiping out all gains from this portfolio since September 2010.
| Scenario | Long-Term Real Cash Rate | Expected Real Return of 65/35 Portfolio | Change in Sustainable Spending |
|---|---|---|---|
| Base Case | 1.25% | 4.7% | Baseline |
| Secular Stagnation (Hell) | 0% | 3.4% | -28% |
Companies/Assets Involved
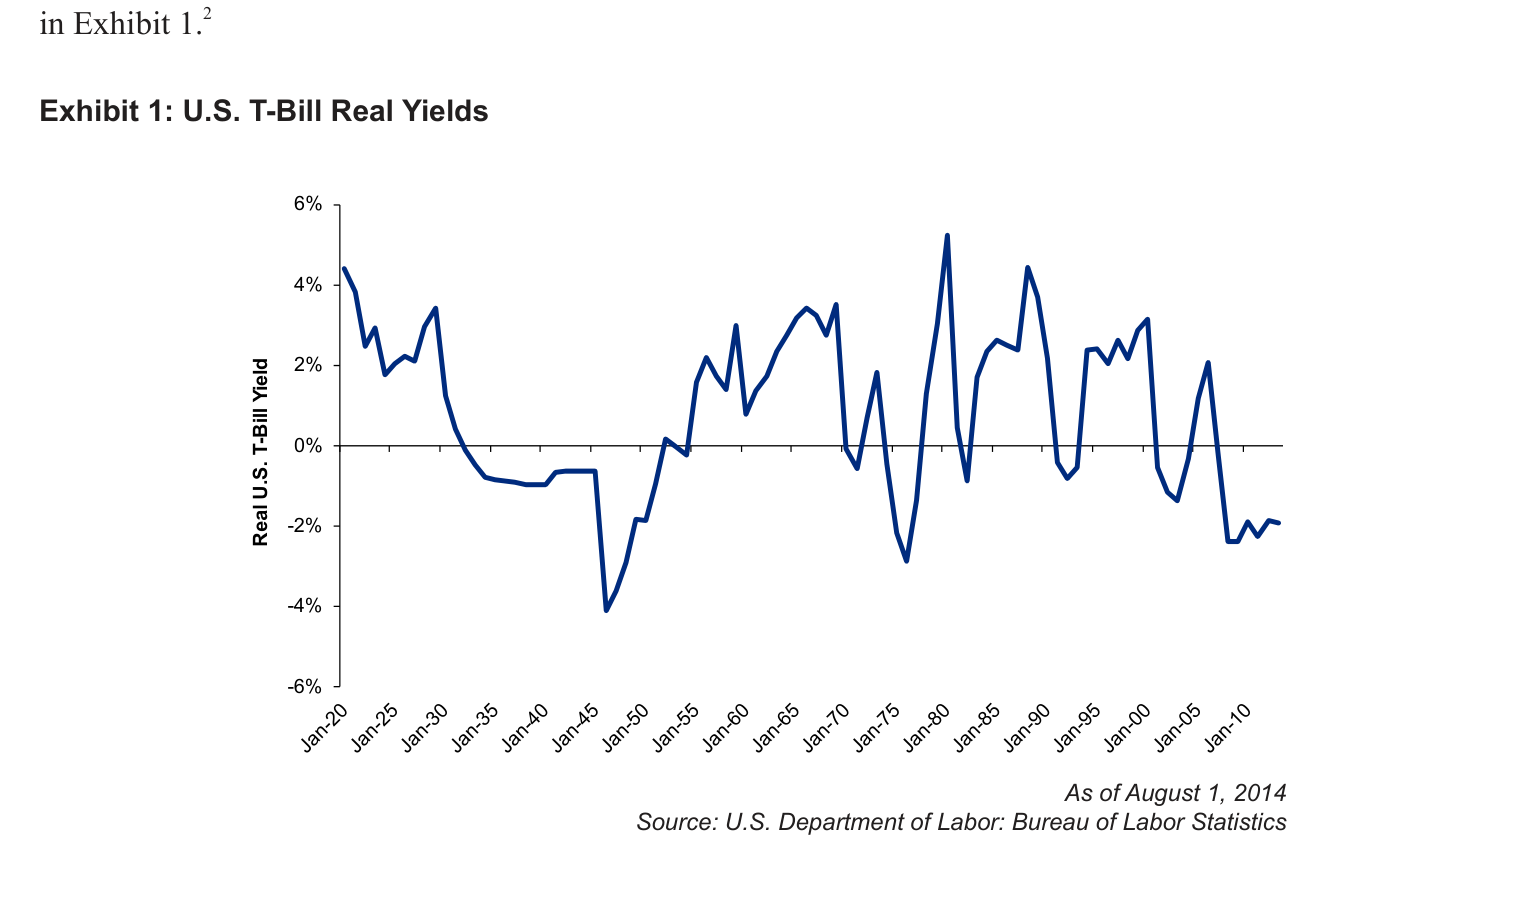
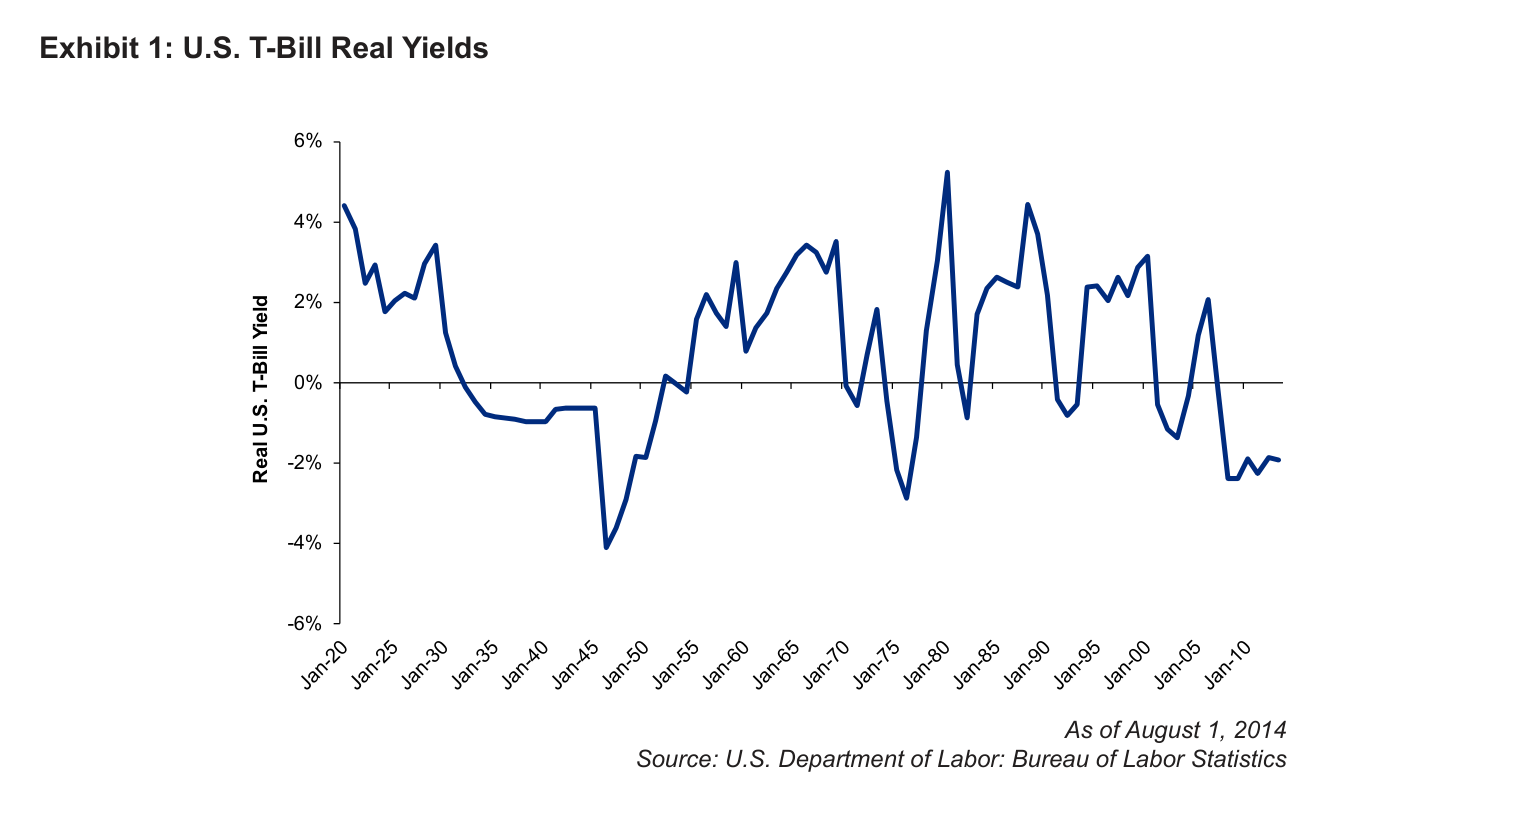
- U.S. T-Bill: As a proxy for the "risk-free asset," the historical volatility of its real yield (-2% to +4%) is the source of valuation uncertainty.
- Stocks (S&P 500): Rose 8.3% in the first three quarters of 2014, but the author believes current valuations pressure future returns.
- Bonds (Barclays U.S. Aggregate): Rose 4.1% over the same period, also lacking appeal.
- 65% Stock / 35% Bond Portfolio: A traditional allocation that remains reasonable under the "Hell" scenario, but with significantly lower expected returns.
Investment Implications
- Investors should lower return expectations for traditional asset portfolios: Regardless of which path is taken, real returns over the next few years are likely to be several percentage points below historical averages.
- Under the "Purgatory" scenario, actively reduce stock and bond allocations: Shift toward cash or seek out more niche, less obvious sources of risk premium; otherwise, investors may face "risk-taking without reward."
- Under the "Hell" scenario, maintain traditional allocations but accept lower returns: Attempting to close the 1.6% return gap (from 4.7% to 3.4%) by chasing alpha is unrealistic, especially when it becomes "budgeted alpha."
Additional Arguments & Insights: The Long-Term Trade-Off Between Purgatory and Hell and Asset Allocation Dilemmas
1. Long-Term Impact on Retirement Savings: Quantifying Purgatory's "Relative Advantage"
- Key Data: For a 35-year-old worker with 30 years until retirement, if the Purgatory path is taken, the final retirement account balance is 15% higher than under the Hell path. However, it is still 5% lower than the scenario of "never experiencing an asset bubble" (i.e., a long-term 0% real risk-free rate).
- Comparison Table:
| Scenario | Difference in Retirement Balance vs. "No-Bubble Baseline" | Effective Spending Gap (Considering Low-Rate Environment) |
|---|---|---|
| Hell | -21% | -33% |
| Purgatory | -5% | Not explicitly quantified, but significantly smaller than Hell |
- Key Insight: While Purgatory is not ideal (still a 5% gap), compared to Hell's 33% effective gap, it is the "best of the suboptimal." This reinforces the original conclusion that "long-term investors should hope for Purgatory," but adds a warning that "a 5% gap still constitutes a material loss."
2. The "Dilemma" of Asset Allocation: The Optimal Portfolio for Risk-Averse Investors
- Core Contradiction: The optimal asset portfolio differs dramatically between the Hell and Purgatory paths, and investors cannot know the path in advance.
- Quantitative Comparison (based on constant risk aversion assumption):
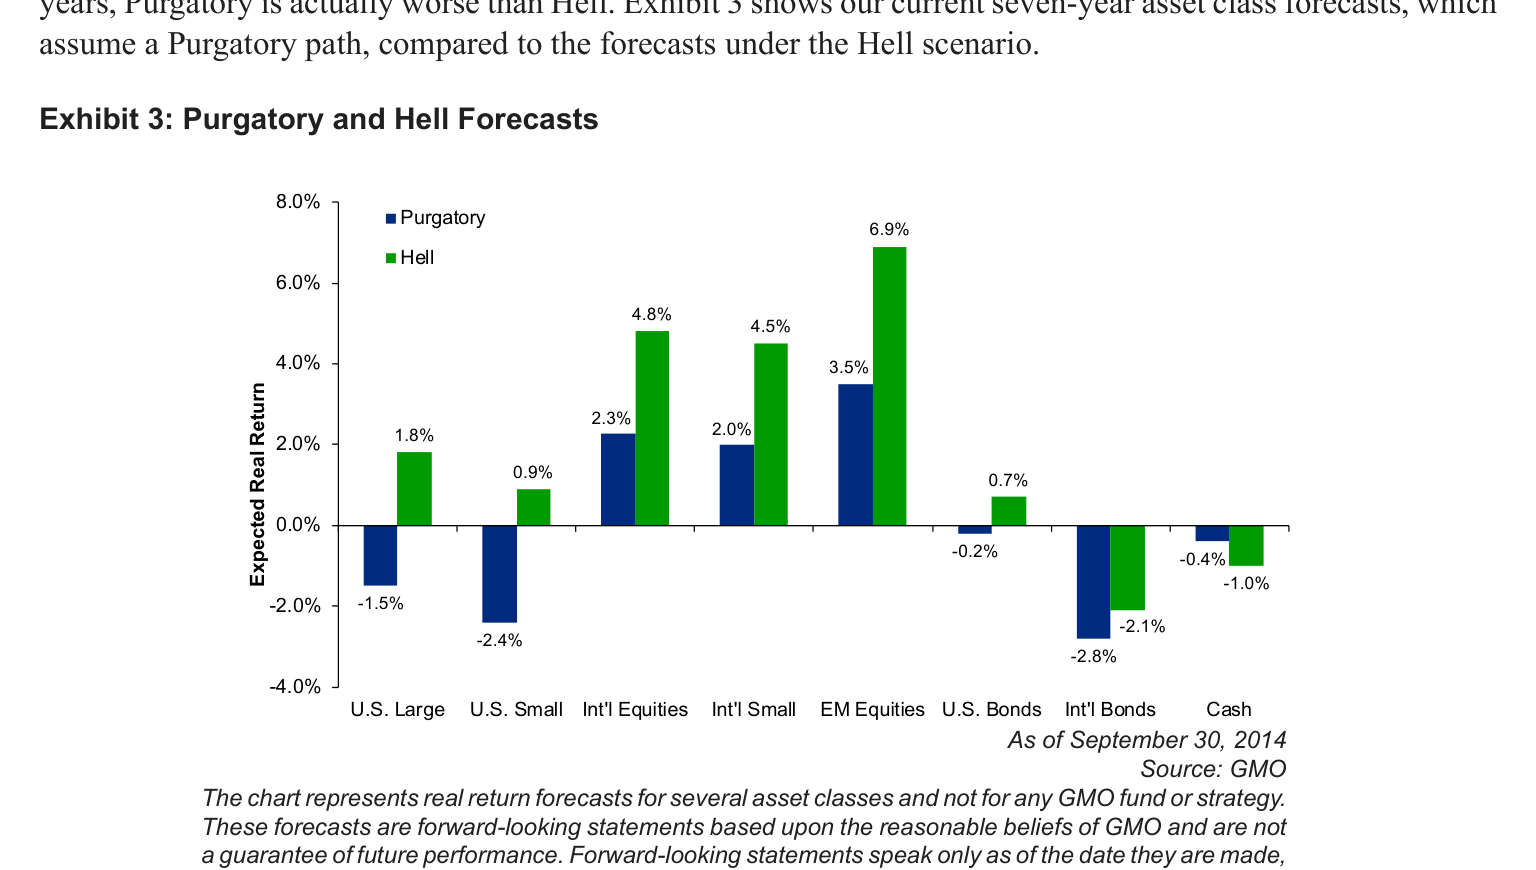
| Scenario | Optimal Portfolio (Stocks/Bonds/Cash) | Expected Real Return |
|---|---|---|
| Normal (Normal Risk Premiums) | 65%/35%/0% | Not specified, but implied >0% |
| Hell | 65%/35%/0% | +2.5% real (65/35 portfolio) |
| Purgatory | 20%/58%/22% | -0.1% real (low-risk portfolio) |
- Key Data: Under Purgatory, even with a low-risk portfolio, the expected return is negative (-0.1% real), while under Hell, the 65/35 portfolio has an expected return of +2.5% real. This means:
- If an investor bets on Hell, they can maintain a high allocation but face short-term losses from asset price revaluation if the reality is Purgatory.
- If an investor bets on Purgatory, they must significantly reduce stock allocation to 20%, sacrificing a 1.6% annualized excess return in the Hell scenario.
3. Asset Duration and Price Elasticity: The "Hidden Returns" of the Hell Path
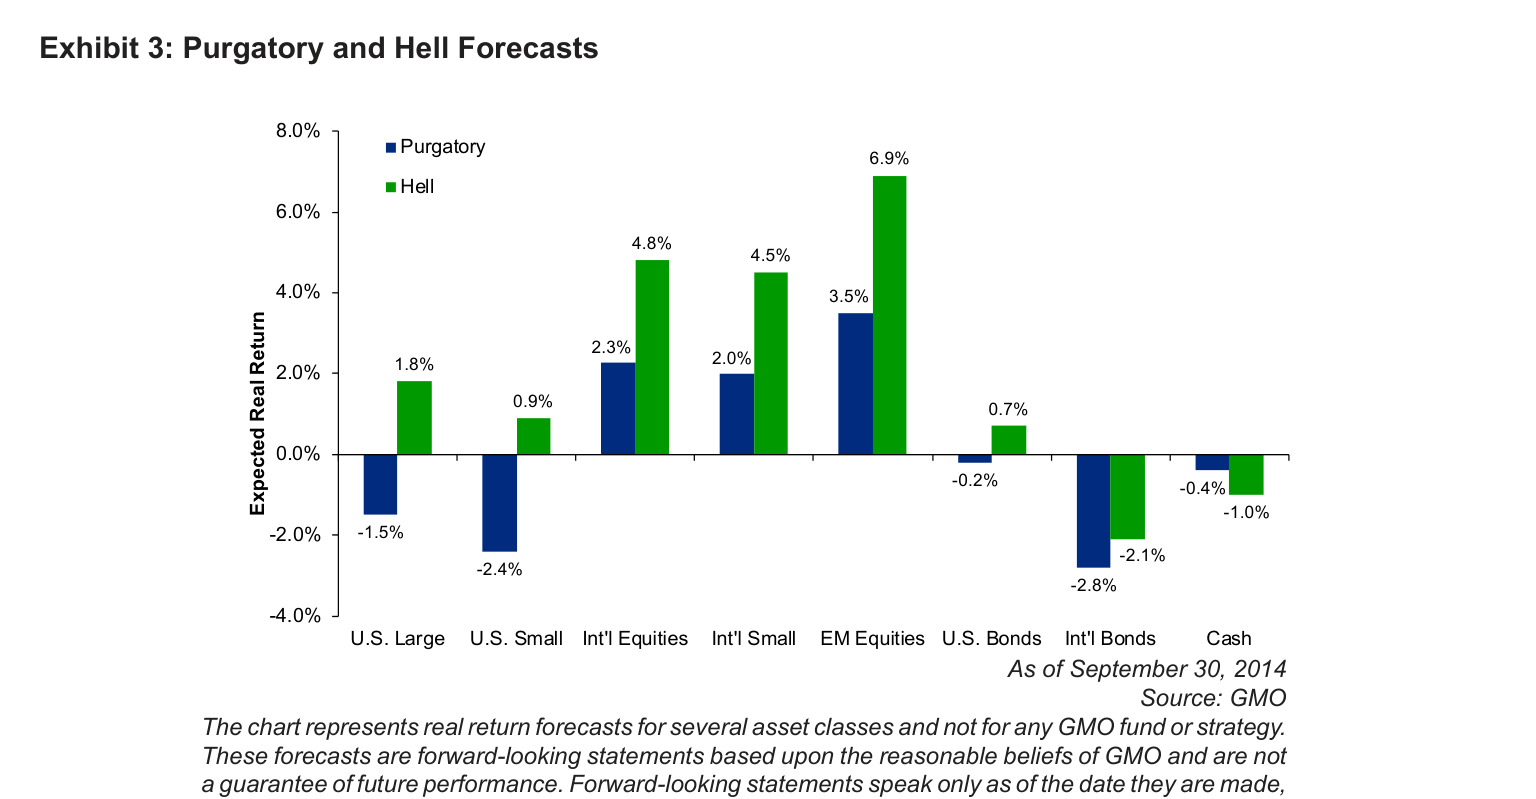
- New Concept Introduced: The report systematically quantifies the "duration with respect to discount rate" for various asset classes for the first time and calculates the price increase from a 1.25% decline in the discount rate.
- Data Table:
| Asset Class | Duration (Years) | Expected Price Increase from 1.25% Discount Rate Decline |
|---|---|---|
| Growth Stocks | 42 | 53% |
| Overall Stocks | 35 | 44% |
| 30-Year Treasury Bonds | 19 | 24% |
| Value Stocks | 25 | 31% |
| Real Estate | 18 | 23% |
| Infrastructure | 14 | 18% |
| 10-Year Treasury Bonds | 9 | 11% |
| Cash | 0.25 | 0% |
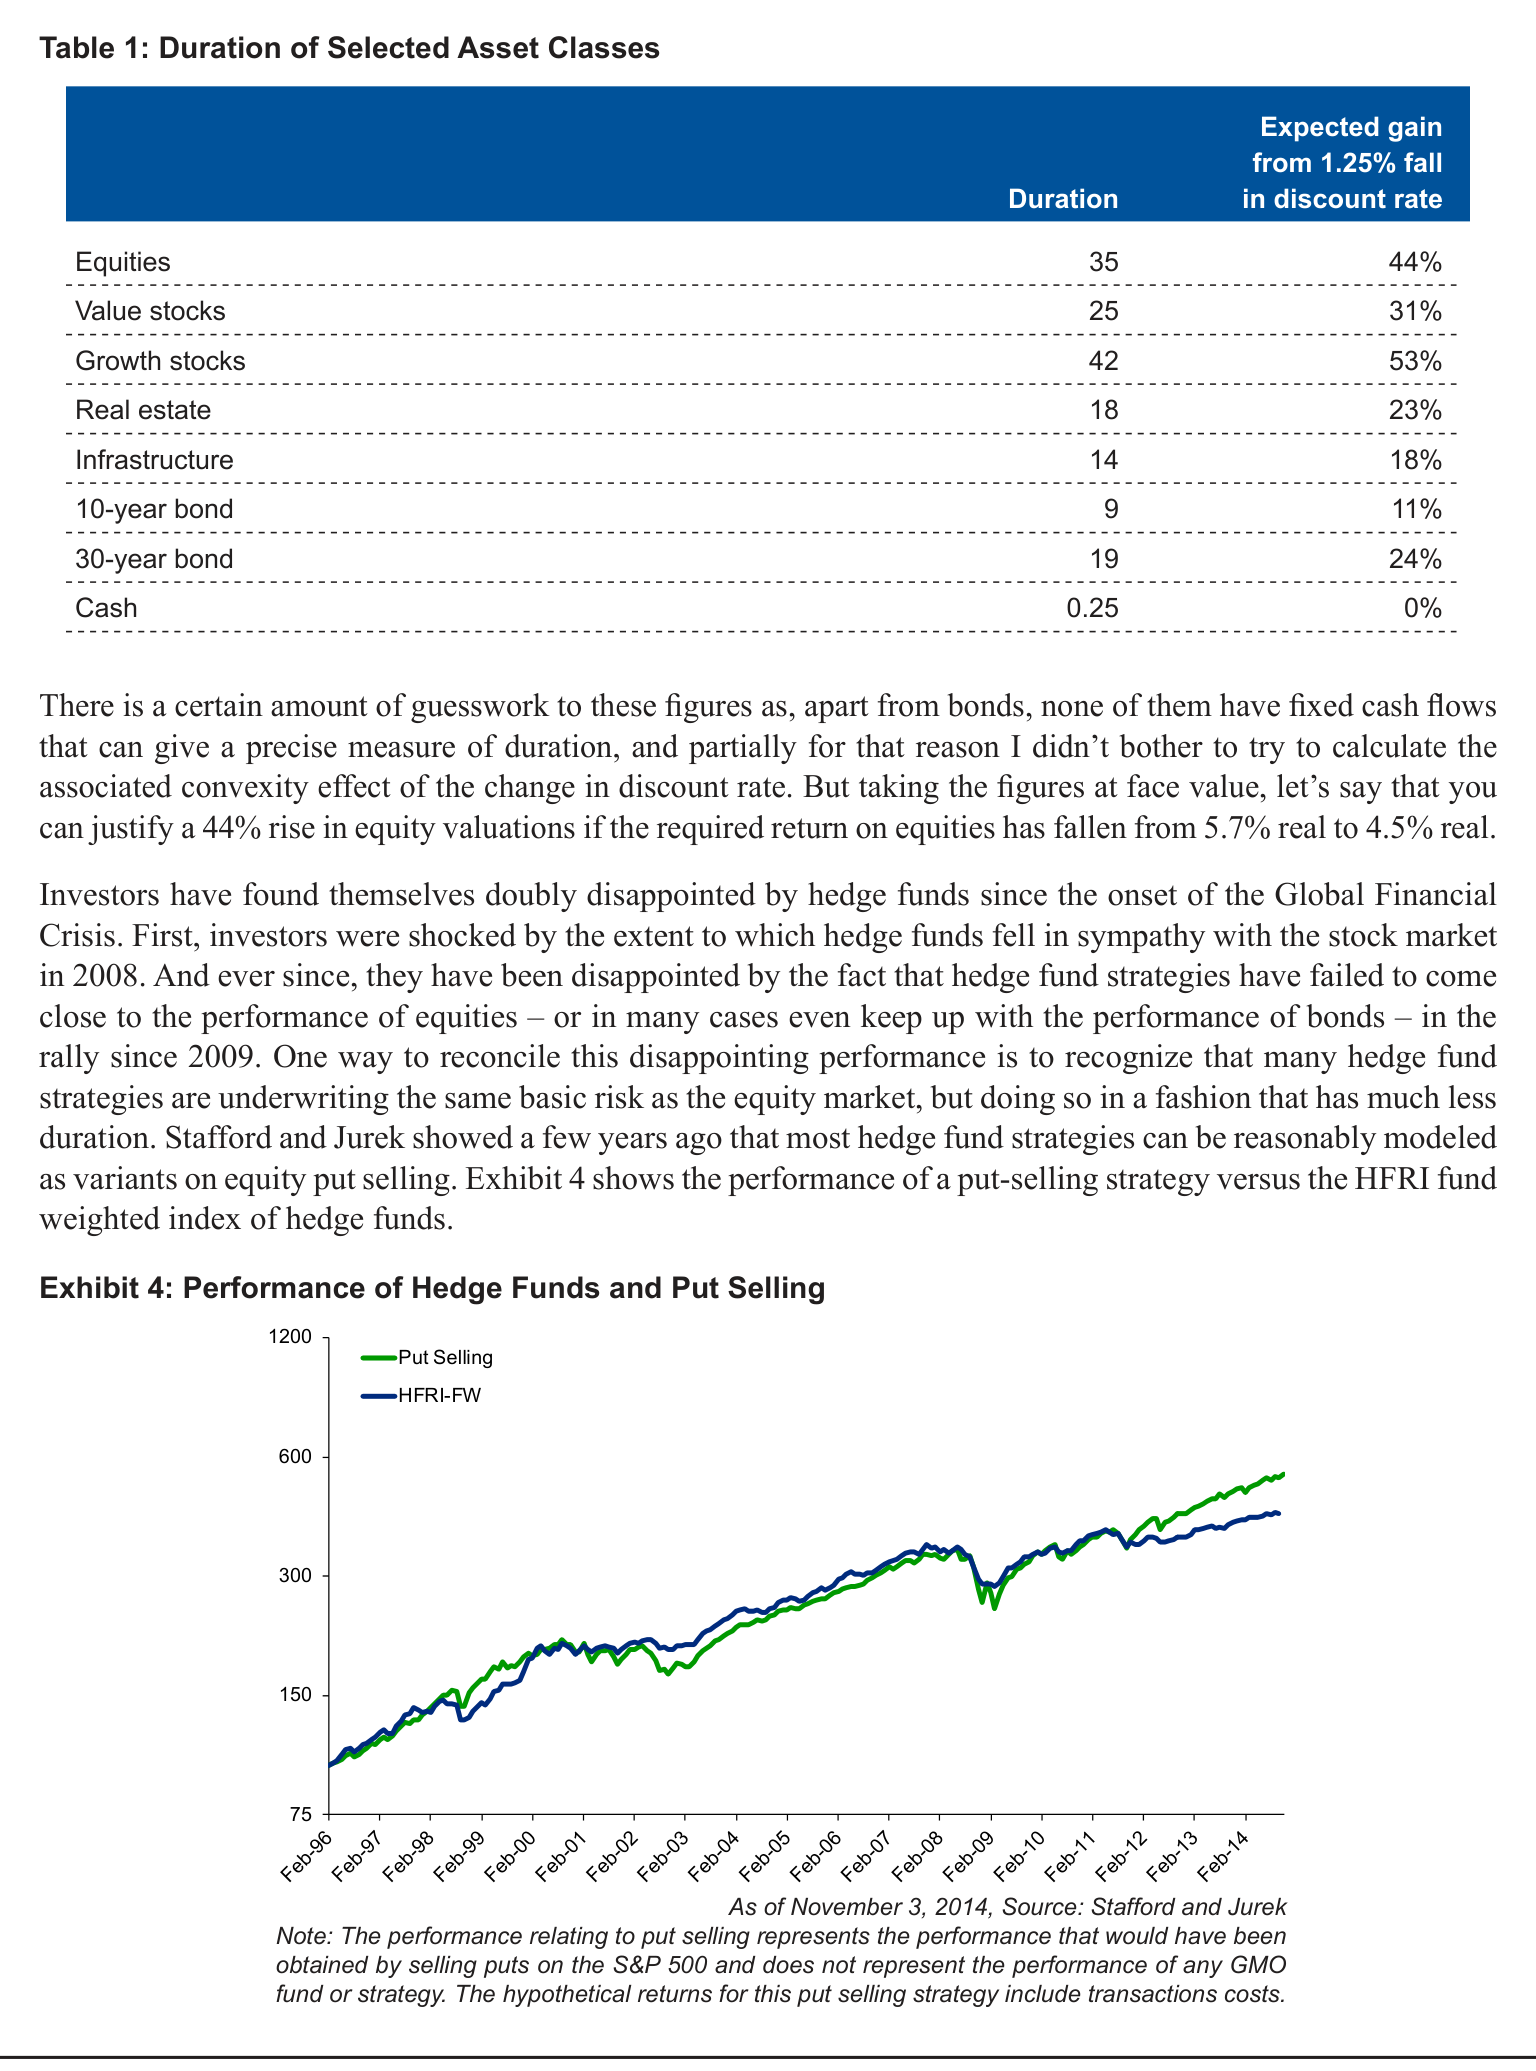
- Key Insight: Under the Hell path, the rise in asset prices is essentially a "repricing due to a decline in the discount rate." Growth stocks (duration 42 years) see the largest increase (53%), while value stocks (25 years) only rise 31%. This explains why growth stocks have significantly outperformed value stocks since 2009 — the market is pricing in the Hell expectation of "permanently low interest rates."
4. The "Double Disappointment" of Hedge Funds and Duration Mismatch
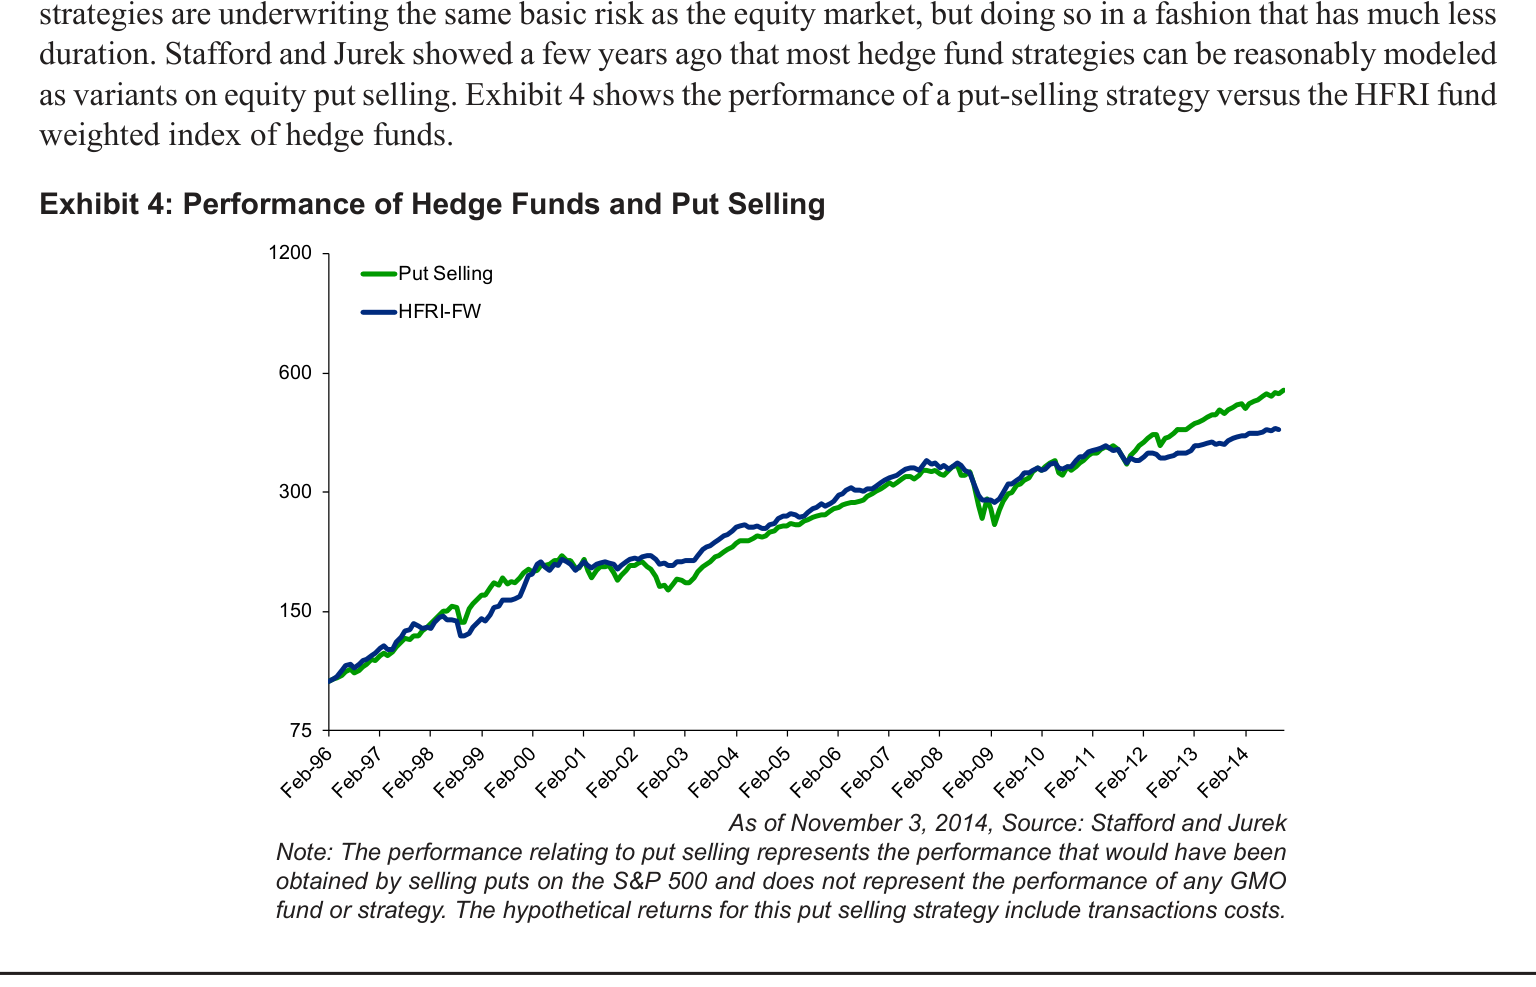
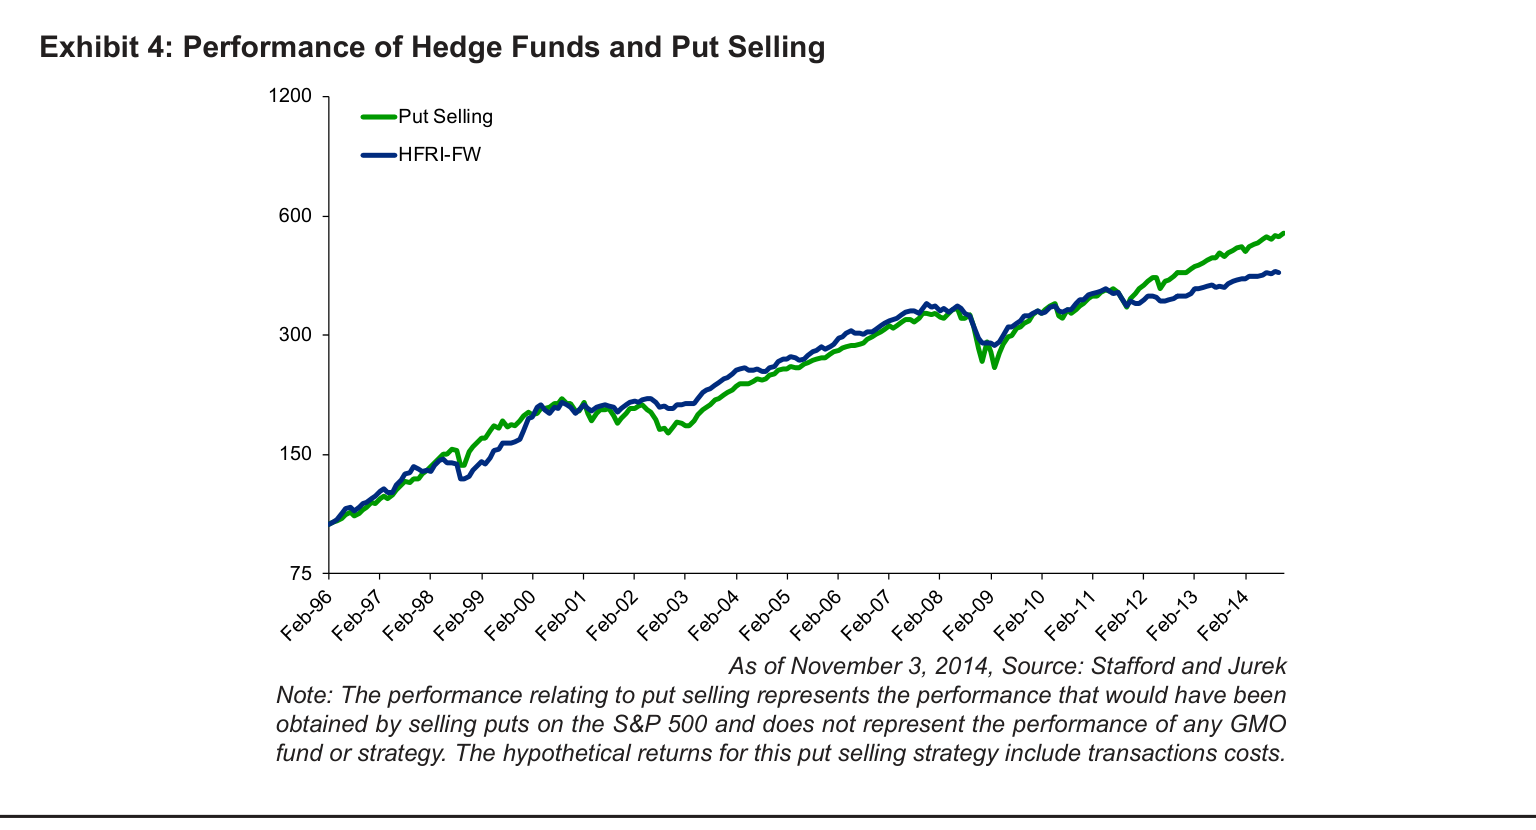
- New Argument: Citing research by Stafford and Jurek, the report points out that most hedge fund strategies are essentially "selling equity put options," with durations far shorter than stocks.
- Data Support: Exhibit 4 shows a high correlation between the HFRI Hedge Fund Index and the "Selling S&P 500 Puts" strategy, especially during the 2008 crash and the subsequent post-2009 rally.
- Key Conclusion: The low-duration characteristic of hedge funds causes them to significantly underperform stocks in the Hell path (falling interest rates, surging asset prices), as their source of returns (option premiums) cannot capture the capital gains from a declining discount rate. This supplements the original argument that "investors should understand asset duration" and explains why hedge funds have performed poorly in a low-interest-rate environment.
5. An "Internal Challenge" to the Hell Path: The Hypothesis of Eroding Returns on Capital
- New Perspective: James Montier proposes that if one assumes a low discount rate quickly erodes the return on existing economic capital (rather than just affecting future investments), then the expected return for stocks under the Hell path could be lower than under Purgatory.
- Author's Response: The author acknowledges this hypothesis "lacks a reasonable mechanism" but does not entirely dismiss it, suggesting uncertainty in the optimistic forecast for the Hell path. This provides investors with an additional reason to "be cautious about betting on Hell."
Summary: Core Contributions of the Additional Analysis
- Quantified Purgatory's long-term advantage (15% vs. 21% difference in retirement accounts), but noted it is still not an ideal state.
- Revealed the "path dependency" dilemma of asset allocation: The optimal portfolio under Purgatory has a negative expected return, while the high-allocation portfolio under Hell offers substantial returns but requires bearing short-term revaluation risk.
- Introduced a duration analysis framework, explaining the performance differences of assets like growth stocks and hedge funds in a low-rate environment.
- Supplemented the potential risks of the Hell path (erosion of returns on capital), reminding investors to avoid excessive optimism.
Additional Arguments & Data Analysis
1. Deepening the Quantitative Comparison of Strategies: From "Half-Life" to "Cash Flow Structure Differences"
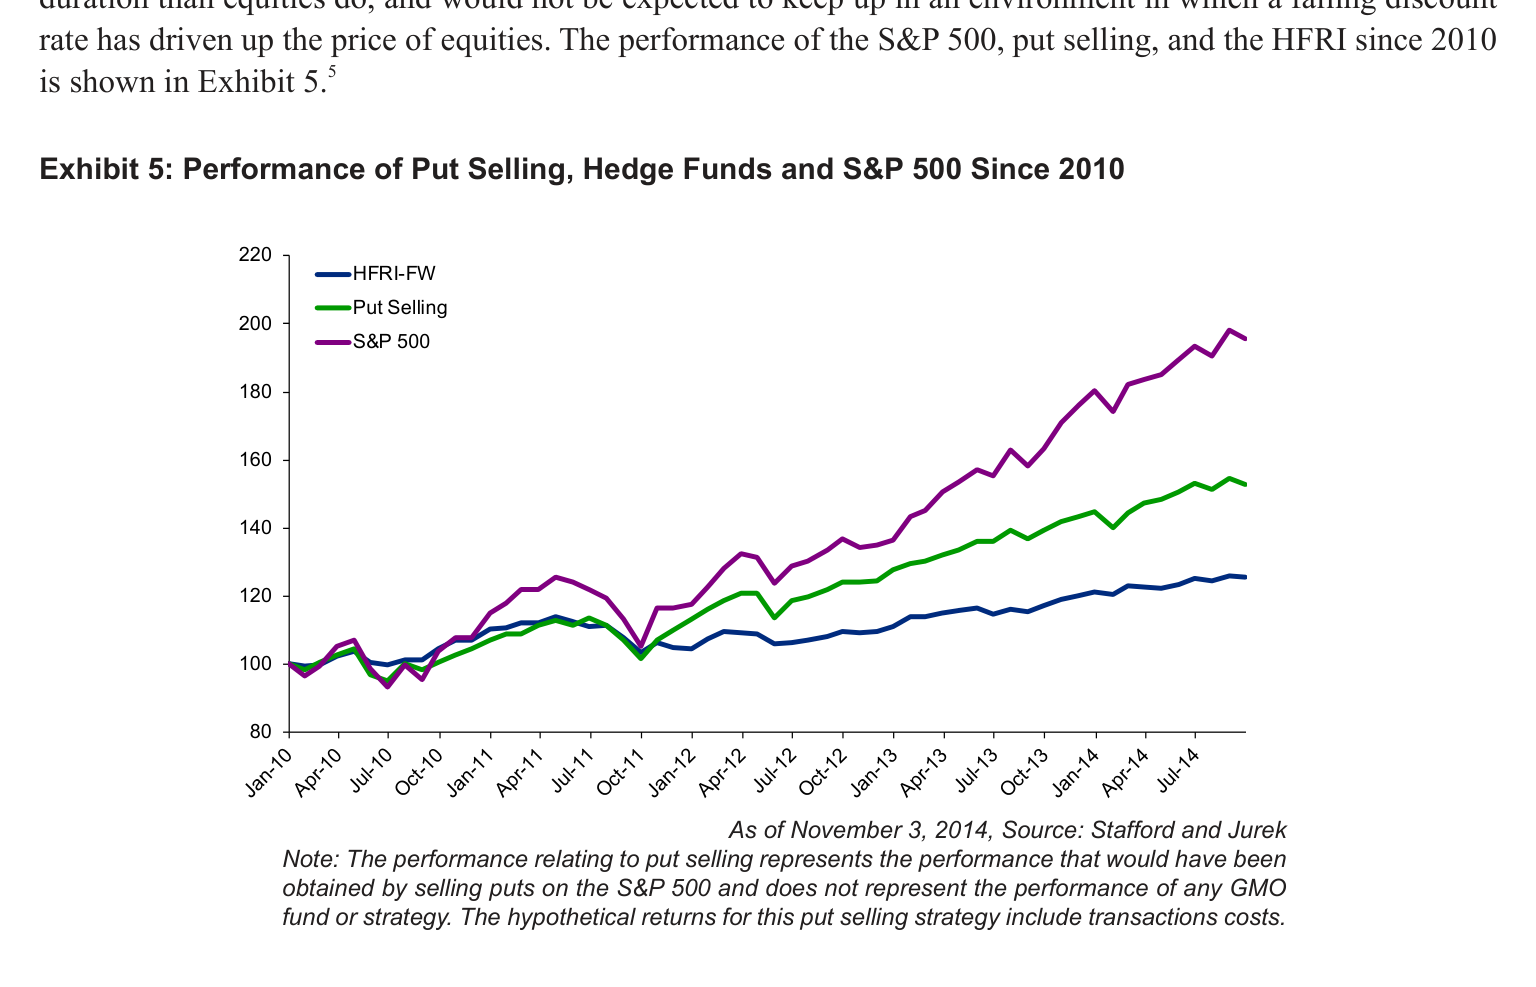
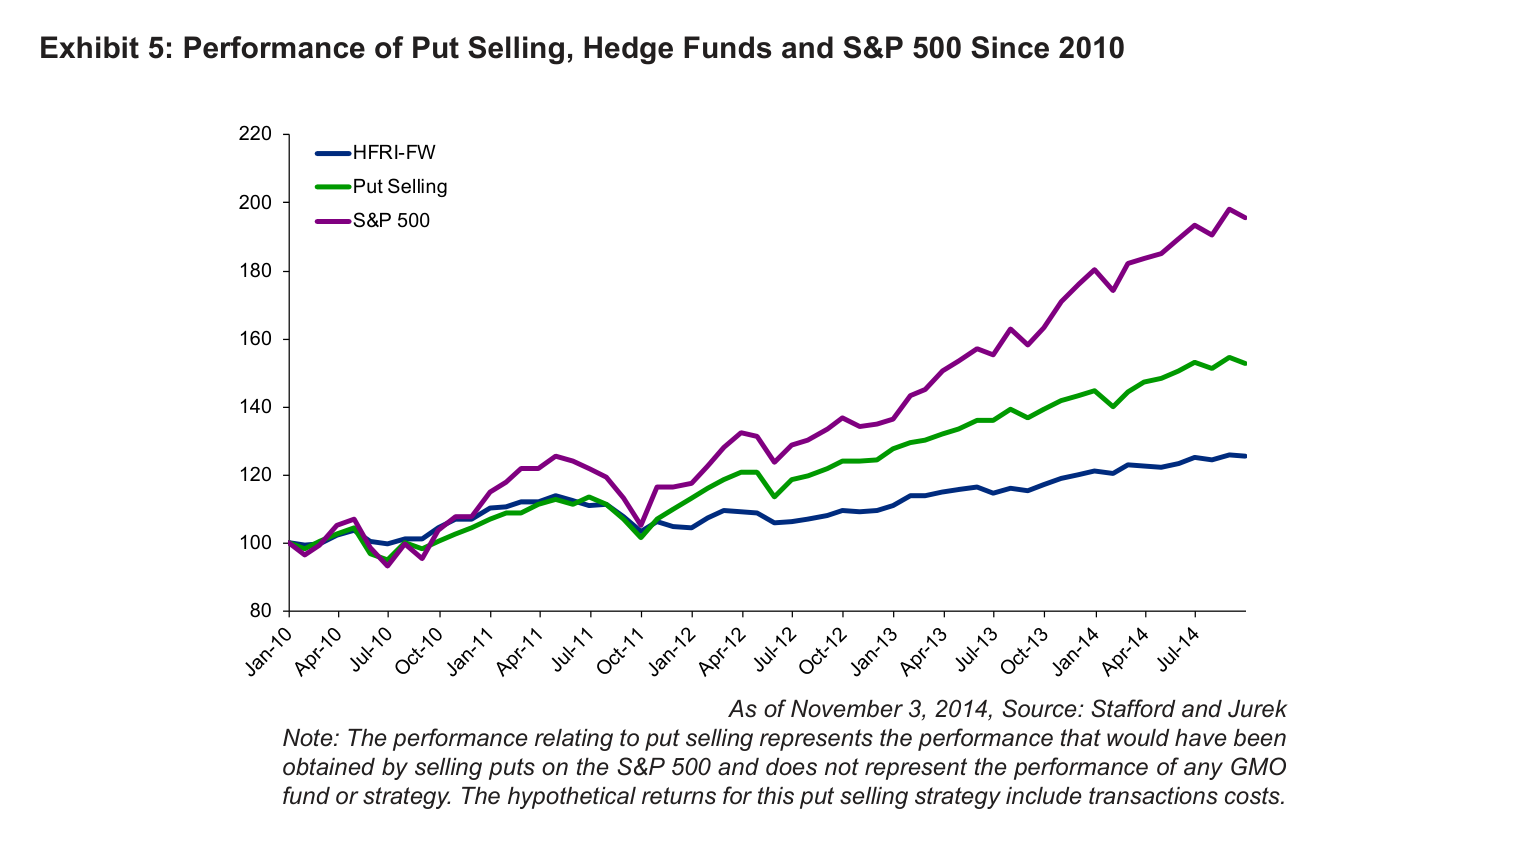
- Key Data: From 2010 to November 2014, the cumulative return of the Put Selling strategy was only 50% of the S&P 500, while the HFRI Hedge Fund Index return was only 25% of the S&P 500. This gap reflects not just a difference in returns but also the impact of cash flow structure on long-term compounding.
- Cash Flow Characteristic Comparison:
- Put Selling: Collects option premiums monthly (short-term cash flow) but bears linear losses when the index declines. Its cash flow is inherently "negatively convex" — stable returns in calm markets, but amplified losses during crashes.
- S&P 500: Generates long-term cash flow through dividends and capital appreciation, with "positive convexity" — accelerating returns in rising markets and limited losses in declines (buffered by dividend reinvestment).
- Hedge Funds: Cash flow structure is complex, including management fees (2%), performance fees (20%), and leverage costs, making their net returns less sensitive to market volatility than pure Put Selling.
| Strategy | 2010-2014 Cumulative Return (Relative to S&P 500) | Cash Flow Convexity | Primary Risk Source |
|---|---|---|---|
| S&P 500 | 100% (Benchmark) | Positive Convexity | Long-term valuation reversion |
| Put Selling | 50% | Negative Convexity | Tail risk (e.g., 2008-style crash) |
| HFRI Hedge Funds | 25% | Mixed (Positive/Negative) | Fee erosion + strategy failure |
2. Strategy Adaptability Under "Purgatory" and "Hell" Scenarios
- Purgatory Scenario: Assuming a slow valuation reversion (e.g., -2% annually), the S&P 500's expected annualized return is approximately 4-5%. In this case, Put Selling, due to its "short duration" characteristic, may underperform the stock market, but the magnitude of the loss is controllable (as market declines are limited). Hedge funds, burdened by high fees (2% management + 20% performance), would further compress returns, potentially achieving only 2-3% annualized.
- Hell Scenario: Assuming a rapid valuation reversion (e.g., -5% annually), the S&P 500 could face annualized losses of 10%+. In this case, Put Selling's "short duration" advantage becomes prominent — its returns come primarily from option premiums, not capital appreciation, making it far less sensitive to rising discount rates than stocks. Hedge funds employing similar strategies (e.g., merger arbitrage, put selling) could achieve positive returns or small losses, significantly outperforming stocks.
- Data Support: During the 2010-2014 period, the Federal Reserve's quantitative easing (QE) led to a continuous decline in discount rates, with the S&P 500 annualizing approximately 15%, while Put Selling only achieved 7.5%. If discount rates reversed (e.g., during the 2013 "taper tantrum"), Put Selling's monthly return volatility (approximately 8%) was lower than the S&P 500's (approximately 12%), demonstrating its resilience.
3. Structural Deficiencies in Hedge Fund Performance: Fee and Strategy Mismatch
- Fee Erosion: Assuming a hedge fund's gross annualized return is 8%, after deducting a 2% management fee and a 20% performance fee, the net return is only 4.4% (calculation: 8% - 2% - (8%-2%)×20% = 4.4%). In contrast, the Put Selling strategy has no management fee, only transaction costs (approximately 0.1%), resulting in a net return of 7.4%.
- Strategy Mismatch: Most hedge funds claim to offer "low volatility, absolute returns," but their actual portfolios often contain significant "long duration" risk (e.g., long growth stocks, short volatility). From 2010 to 2014, the correlation between the HFRI Index and the S&P 500 was as high as 0.85, indicating they did not effectively diversify stock risk. In contrast, the correlation between Put Selling and the S&P 500 was only 0.6 (due to different return sources), aligning more closely with a "short duration" positioning.
- Conclusion: The poor performance of hedge funds is not accidental but a result of the dual failure of fee structure and strategy execution. The author suggests investors replace high-fee hedge funds with "low-cost versions" (e.g., directly selling puts) to achieve better risk-adjusted returns.
4. Practical Logic of Strategy Adjustment: From "Duration" to "Risk Budget"
- GMO's Benchmark-Free Strategy: The author reveals that the fund has recently increased allocations to merger arbitrage and Put Selling while reducing standard stock weights. This adjustment is not based on a "Purgatory/Hell" prediction but on a quantitative assessment of relative attractiveness:
- Expected Stock Returns: GMO's model shows the S&P 500's expected annualized return over the next 7 years is approximately 4% (assuming the Purgatory path), below the historical average.
- Expected Put Selling Returns: Based on implied volatility (VIX around 15%), the expected annualized return of a monthly put-selling strategy is approximately 8-10%, with a negative correlation to stock returns (option premium income increases when the stock market falls).
- Expected Merger Arbitrage Returns: Historical annualized returns are approximately 5-7%, with volatility of only 3-5%, and a correlation with stocks below 0.3.
- Risk Budget Allocation: By shifting the risk budget from "long-duration stocks" to "short-duration strategies," the portfolio's effective duration is reduced from 5 years to 2 years, thereby lowering sensitivity to changes in discount rates. Even in a "Hell" scenario, the portfolio's maximum drawdown is expected to be contained within 15%, far less than the S&P 500's 40%+.
5. Implications for Investors: The Trade-Off Between Cost and Strategy
- Core Contradiction: There is a fundamental conflict between the high fees of hedge funds (2%+20%) and the low return potential of "short duration" strategies. If a hedge fund's net annualized return is only 4%, while Put Selling can achieve 7%, investors are paying a 3% implicit cost (i.e., opportunity cost) for the illusion of "diversification."
- Feasible Paths:
- Low-Cost Alternatives: Implement Put Selling via ETFs or direct trading (e.g., the S&P 500 PutWrite Index, with annualized returns of approximately 6-8%).
- Selective Manager Picking: Seek hedge funds with fees below 1%+10% and a strategy correlation with stocks below 0.5 (e.g., those focused on merger arbitrage or event-driven strategies).
- Dynamic Adjustment: Increase the weight of short-duration strategies when valuations are high (e.g., CAPE > 25) and return to stocks when valuations are low (e.g., CAPE < 15).
Summary
This article, through quantitative comparison, reveals the differentiated performance of Put Selling and hedge funds under the "Purgatory/Hell" scenarios. The core conclusion is: Short-duration strategies (such as Put Selling), while underperforming in bull markets, demonstrate significantly superior resilience and return stability compared to stocks and high-fee hedge funds in environments of valuation reversion or rising discount rates. Investors should abandon the myth that "hedge funds equal universal diversification" and instead focus on the cash flow structure and actual costs of strategies to build more resilient portfolios.