Are We There Yet?
Patient Capital Management is a Baltimore asset manager founded in 2020 by Samantha McLemore, CFA — Bill Miller's long-time co-manager (working together since 2002, running the flagship Opportunity Equity strategy since 2014). Continuing the Miller-school contrarian tradition, it practices "time arbitrage": exploiting behavioral mispricing to concentrate in controversial growth names (tech, healthcare, Bitcoin-related) at deep discounts to intrinsic value. Its site preserves Bill Miller's complete 1995-2022 market letters, alongside ongoing quarterly letters and webinars.
In plain words
This analysis says the bull market that started in 2009 isn't over yet, even though stocks have gone up 10x. Surprisingly, many professional investors (like hedge funds and university endowments) have been too cautious and missed most of the gains. The author argues that being too afraid is actually riskier than a bubble—history shows that even after a 50% crash, long-term index investors still end up far ahead of conservative savers. The AI story still has room to run, but only some companies (like NVIDIA) will benefit, while cash-burning cloud firms should be avoided. Worth reading because it reminds regular investors: the biggest mistake isn't buying at a high price—it's not buying at all.
This report discusses how the S&P 500 has achieved a 10-fold return (17% annualized) since March 2009, yet many investors have missed out on gains due to excessive caution. The core argument is that while the current market has elevated valuations (forward P/E rising from 12x to approximately 23x) a
Theme and Background
This chapter discusses whether the current market is approaching the end of the bull run after the S&P 500 has delivered a 10-fold return (17% annualized) since March 2009. The author argues that while valuations are elevated and speculative sentiment is rising, institutional positioning remains low, caution prevails, and the AI story is still unfolding but unevenly, so the final peak has not yet been reached.
Core Thesis
The bull market is not over, but it has entered its later stage. The author explicitly judges this as "late innings ≠ final inning," with market sentiment still dominated by skepticism (light institutional positioning, prevalence of cautious headlines), which is not a typical top characteristic. The counterintuitive judgment: Excessive caution is the real risk, not a market bubble.
Key Arguments and Data
- Valuation Comparison: The forward P/E ratio has risen from 12x at the start of the 2009 bull market to approximately 23x currently, but institutional positioning remains low.
- Historical Return Comparison (2010–2019):
| Asset/Strategy | Annualized Return | vs. S&P 500 |
|---|---|---|
| HFRI Hedge Fund Index | 4.3% | 13.5% |
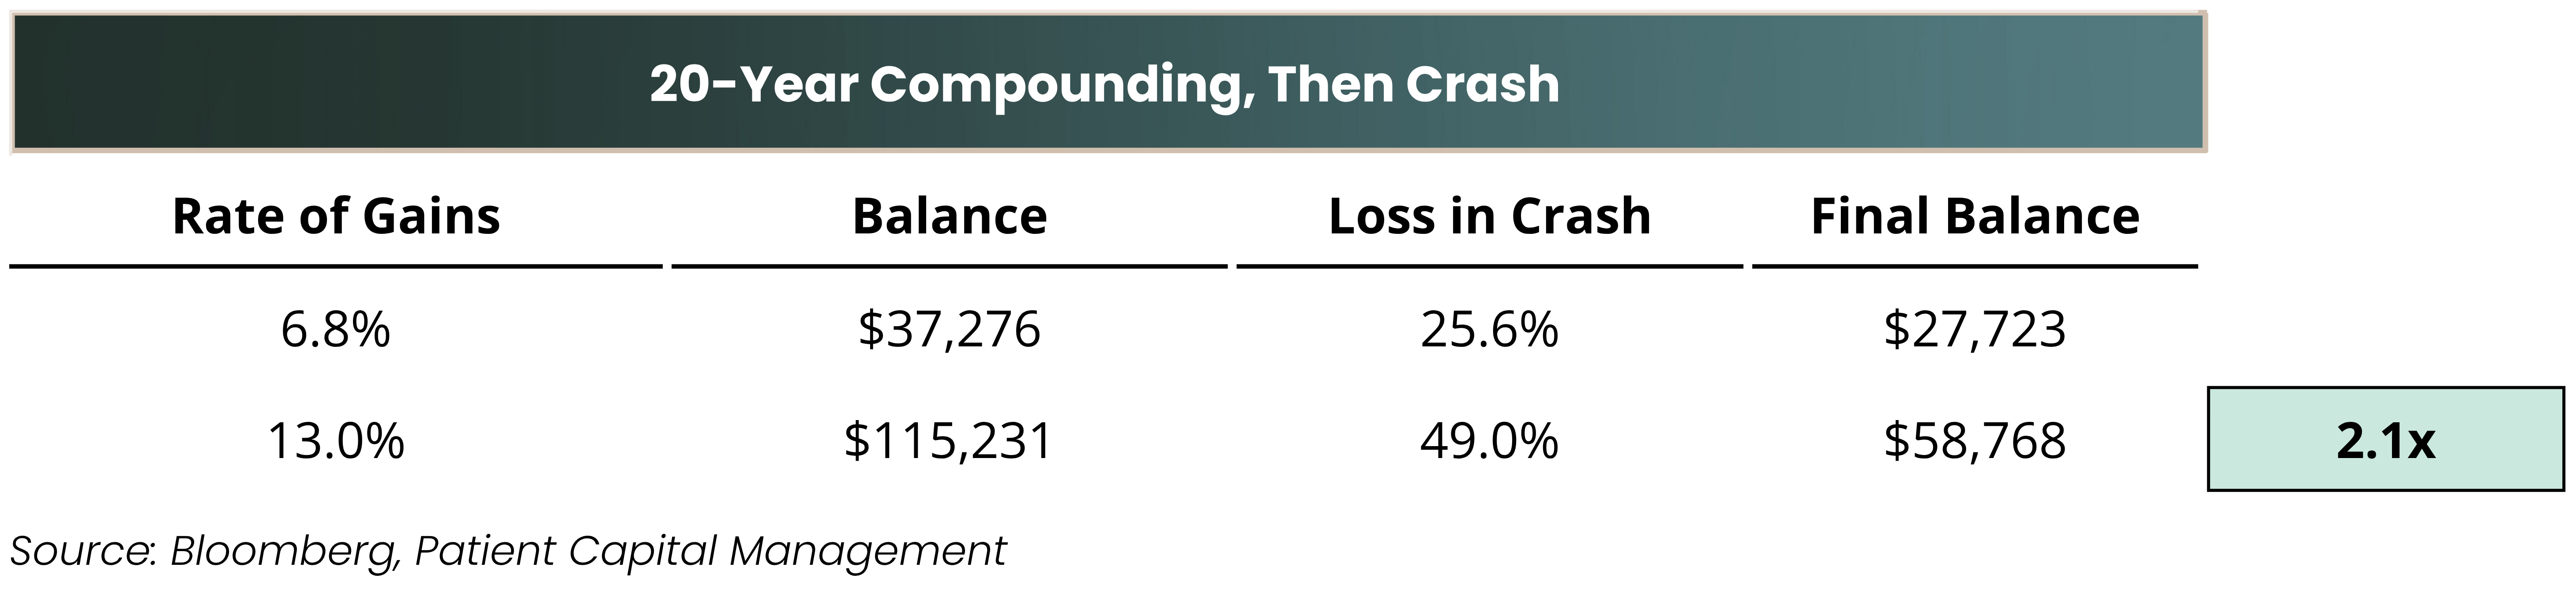
| University Endowments (2014–2024) | 6.8% | 13.0% |
- Error Type Analysis: Investors focus excessively on Type I errors (being wrong) and underestimate the cost of Type II errors (inaction). History shows that the cost of missing major winners far outweighs enduring volatility.
- AI Current State: Headlines warn of bubbles and capital expenditure risks, but in-depth interviews (Solomon, Bezos, Huang) reveal cautious optimism. AI will produce winners and losers, not a single narrative.
Companies/Assets Involved
- NVIDIA: The author holds it long-term, viewing it as a representative compound growth asset, with a bullish stance.
- "Neo-clouds" (capital-intensive cloud companies): The author explicitly avoids them due to cash burn and valuations that have yet to align, with a bearish stance.
Investment Implications
- Maintain patience and opportunism: Avoid permanent capital loss rather than shun volatility. Continue holding compound growth assets (e.g., NVIDIA) and stay away from capital-intensive companies.
- Beware of Type II errors: In the current environment of pervasive caution, the cost of inaction may far outweigh the risk of short-term volatility. Investors should remain engaged in the market rather than exit entirely due to elevated valuations.
Theme and Background
This chapter explores whether the long-term bull market that began in March 2009 is nearing its end. The market environment presents contradictory characteristics: on one hand, valuations have risen significantly and speculative sentiment has heated up; on the other, institutional positions remain low and cautious sentiment prevails. The author argues that investors have missed most of the gains due to excessive focus on risk protection, and the current need is to distinguish genuine bubble signals from normal market fluctuations.
Core Thesis
The author’s core judgment is: The bull market has not yet reached its end. Despite signs of a bubble (AI trading structures, retail speculation, valuation doubling), institutional risk appetite remains low, and market participants have learned lessons from historical bubbles. Counterintuitive views include:
- Current speculative sentiment, though elevated, is far from the "full capitulation" state seen at historical bubble peaks.
- Hedge funds and university endowments have significantly underperformed the market due to excessive caution, with the cost of "inaction" far exceeding the risk of volatility.
- Even in the event of a 50% crash similar to the tech bubble, long-term holders of index funds would still achieve higher final returns than conservative strategies.
Key Arguments and Data
1. Severe Disconnect Between Long-Term Bull Market Returns and Investor Participation:
- The S&P 500 has delivered a 10x return from its 2009 low to the present (2025), with an annualized return of 17.0%.
- The forward P/E ratio has risen from 12x to approximately 23x.
- Hedge funds (HFRI Index) achieved an annualized return of only 4.3% in the 2010s, far below the S&P 500’s 13.5%.
- University endowments (2014-2024) posted an annualized return of 6.8%, only half of the S&P 500’s 13.0%.
2. Current Market Contradictory Signals:
- Speculative signs: AI trading adopts a "vendor financing" structure similar to the tech bubble; retail investors profit through cryptocurrencies and AI trading; Patient Capital’s non-investment team’s annual stock-picking portfolio averaged a 41% return (three times the S&P 500).
- Cautious signals: Goldman Sachs’ institutional positioning sentiment indicator has been negative for 30 consecutive weeks (the third-longest streak since 2015); university endowments significantly underperform; CEOs and prominent investors (Solomon, Bezos) publicly express concerns.
3. Historical Comparison Data:
| Indicator | Current Market | Historical Peak |
|---|---|---|
| NVIDIA Forward P/E | 33x | Cisco Peak >100x |
| OpenAI Valuation Growth | $20B in 2021 → $500B in 2025 (25x) | - |
| OpenAI Infrastructure Commitments | >$1 trillion | - |
| Market Performance After Greenspan’s "Irrational Exuberance" | - | S&P 500 rose another 116% after end of 1996 |
4. Quantitative Analysis of "Inaction" Cost:
- $10,000 investment over 10 years: Conservative strategy (annualized 6.8%) → $19,307; Index fund (annualized 13.0%) → $33,946 (1.8x).
- Even after a 49% crash similar to the tech bubble, the index fund’s final balance is still 20% higher than the conservative strategy ($17,312 vs. $14,358).
- Over a 20-year horizon, index investors’ final returns are more than double those of the conservative strategy.
Companies/Assets Involved
- NVIDIA: Core AI beneficiary, forward P/E of 33x (far below Cisco’s peak of 100x+), CEO Jensen Huang believes AI infrastructure will not be oversupplied in the short term.
- OpenAI: Valuation surged from $20B in 2021 to $500B in 2025 (25x), committed over $1 trillion in infrastructure spending, and struck a new deal with AMD.
- AMD: Secured a large deal with OpenAI, benefiting from AI computing shortages.
- S&P 500 Index Fund: As a benchmark, annualized return of 13.0%, recommended by the author as an alternative to conservative strategies.
- Hedge Funds (HFRI Index): Annualized return of 4.3%, significantly underperforming.
- University Endowments (NACUBO Commonfund): Annualized return of 6.8%, underperforming.
Investment Implications
1. Do Not Miss Gains Due to Excessive Caution: Historical data shows that long-term holding of index funds, even through crashes, yields significantly higher final returns than conservative strategies. Investors should tolerate volatility rather than pursue absolute risk avoidance.
2. Distinguish Bubble Signals from Normal Cycles: While speculative sentiment has heated up, institutional positions remain low, and valuations have not reached historical extremes (e.g., NVIDIA 33x vs. Cisco 100x+). The market has not yet entered the "full capitulation" bubble peak phase.
3. Beware of "Type II Errors": The cost of inaction (missing gains) far exceeds the risk of volatility. Investors should avoid exiting too early in the late bull market due to fear.
4. Focus on Compounding Assets: Such as NVIDIA and other core AI beneficiaries, while avoiding capital-intensive "neo-cloud" companies. Hold quality assets long-term rather than chasing short-term speculative trends.
5. Maintain Behavioral Discipline: The investment goal is "serenity," requiring a firm identity unaffected by market noise. The core is to prevent permanent capital loss, not volatility.
New Analysis: Deep Logic from "Impairment" to "Are We There Yet"
1. Dual Sources of Impairment Risk and Value Investing’s Defensive Mechanism
The original text defines "Impairment" as a state where losses cannot be recovered, attributing its root to "deterioration in business fundamentals" or "overpaying for assets." This framework contrasts with the behavioral finance "disposition effect," where investors tend to sell profitable assets too early but hold losing assets for too long, accumulating impairment risk. The author emphasizes value investing’s protective role after the "long-term bull market top," supported by historical data:
- After the 2000 internet bubble burst: Value funds (e.g., Vanguard Value Index) posted a cumulative return of -15% from 2000-2002, while growth funds (e.g., Vanguard Growth Index) fell over 70%.
- Before the 2007 financial crisis: Value stocks (e.g., banks, energy) declined less than growth stocks (e.g., tech, consumer) in 2008, as the former’s valuations already included risk premiums.
2. AI Investment Divergence: Nvidia vs. Neoclouds’ Cash Flow Paradox
The author clearly distinguishes two types of assets in the AI ecosystem:
- Nvidia: Misjudged by the market as a "hardware company," it actually possesses a composite moat of software, networking, and innovation. The current valuation (29x FY2027 expected earnings) appears reasonable, but note:
- If earnings growth slows from 40% to 20%, the P/E would rise to 58x (assuming unchanged stock price), implying hidden risk.
- Historical comparison: Cisco had a peak P/E of 130x in 2000, followed by an 80% decline over the next decade.
- Neoclouds (e.g., CoreWeave): High capital intensity leads to negative cash flow. JP Morgan forecasts free cash flow of only $3-4 billion by 2029, corresponding to an enterprise value of $79 billion, implying a P/FCF of 20-26x. However, consider:
- If capital expenditure remains high, free cash flow may fall short of expectations (e.g., CoreWeave’s capex-to-revenue ratio exceeded 150% in 2023).
- Comparison with AWS: Amazon’s cloud business had cumulative negative free cash flow from 2015-2020, turning positive only after 2021, with significant stock price volatility during that period.
3. "Disconnect" Between Market Fear and Fundamentals: Quantitative Verification
The author argues that market fear of AI demand "collapsing at any time" suppresses Nvidia’s valuation, while fundamentals remain strong. The degree of disconnect can be quantified with the following indicators:
| Indicator | Nvidia (2024) | Typical Historical Bubble Peak (e.g., Cisco 2000) |
|---|---|---|
| Expected Earnings Growth (Next 3 Years) | 40%+ | 30-50% (but actual growth plummeted post-bubble) |
| Current P/E (Based on FY2027) | 29x | 100x+ (based on then-current earnings) |
| Analyst Ratings (Buy/Hold/Sell) | 80%/15%/5% | 90%/8%/2% (at bubble peak) |
| Short Interest Ratio | 1.2% | 0.5% (extremely low at bubble peak) |
Data shows that Nvidia’s current valuation and sentiment have not reached extreme levels, but reliance on growth is extremely high.
4. Practical Significance of Peter Lynch’s Quote: The Cost of Excessive Worry
Lynch’s famous remark during the tech bubble, "Don’t worry about whether the market is overvalued," essentially opposes market timing. The author uses this to emphasize:
- Historical lesson: From 1996-2000, the S&P 500 delivered an annualized return of 28%, but exiting due to "overvaluation" would have missed the largest gains. Similarly, the AI theme drove the Nasdaq up 60% in 2023-2024, causing heavy losses for short sellers.
- Current risk: If AI demand slows in 2025-2026 (e.g., due to corporate IT spending contraction), Nvidia’s earnings may fall short of expectations, but the author believes this is "not yet" the case.
5. Narrative Structure of "Are We There Yet": From Child Metaphor to Investment Cycle
The entire text uses the classic child’s question during a car ride as a framework, implying the long and uncertain nature of the investment journey:
- Phase 1 (already covered): Identify impairment risk, adhere to value investing, distinguish AI winners from losers.
- Phase 2 (this section): Acknowledge that Nvidia’s valuation is reasonable but not cheap, Neoclouds carry higher risk, and cite Lynch to downplay market timing.
- Phase 3 (preview): The Q3 portfolio review will reveal specific holdings and position adjustments.
This narrative aligns with behavioral finance’s "mental accounting": investors classify different assets separately, applying different evaluation standards to Nvidia (growth) and Neoclouds (speculative).
Key Conclusions
- Nvidia: Current valuation (29x P/E) implies 40%+ earnings growth; if growth slows to 20%, P/E would rise to 58x, risk is manageable but not zero.
- Neoclouds: CoreWeave’s P/FCF (2029) is approximately 20-26x, but capital intensity creates high cash flow uncertainty, warranting caution against "growth traps."
- Market Sentiment: Fear (demand collapse) and greed (AI revolution) coexist; the author chooses to exploit the disconnect rather than predict a turning point.
The next section will reveal specific holdings, potentially including adjustments to Nvidia positions, avoidance of Neoclouds, and new value-oriented AI targets (e.g., semiconductor equipment or software companies).