1Q25 Samantha's Quarterly Letter
Patient Capital Management is a Baltimore asset manager founded in 2020 by Samantha McLemore, CFA — Bill Miller's long-time co-manager (working together since 2002, running the flagship Opportunity Equity strategy since 2014). Continuing the Miller-school contrarian tradition, it practices "time arbitrage": exploiting behavioral mispricing to concentrate in controversial growth names (tech, healthcare, Bitcoin-related) at deep discounts to intrinsic value. Its site preserves Bill Miller's complete 1995-2022 market letters, alongside ongoing quarterly letters and webinars.
In plain words
This letter explains why a market panic can be a buying opportunity, not a time to sell. Historical data shows that after big drops like this, the market often rebounds 40% within a year. When the fear index (VIX) spikes above 45, there's an 85% chance of gains over the next year. The author argues that beaten-down stocks like airlines, cruise lines, and big tech (Nvidia, Amazon) are now priced for the worst case, offering a rare chance to buy at a discount. It's worth reading because it backs up the optimism with data, not just hope.
This report, authored by Patient Capital, discusses the sharp market correction in the first quarter of 2025 and the impact of tariff policies behind it. The core argument is that despite the panic-driven decline, history suggests that similar crises are often followed by strong rebounds. Key conclu
Theme and Background
This chapter opens with a classic quote from boxing legend Mike Tyson, discussing the "heavy punch" the market endured in the first quarter of 2025, followed by an even more severe crash in early Q2 triggered by tariff policies. The report places the current market environment within the framework of historical crises (the 1987 crash, the financial crisis, COVID-19), analyzing panic sentiment, policy risks, and long-term investment opportunities.
Core Thesis
The author’s central judgment is: The current market panic is a textbook "crisis-rebound" pattern, with historical data showing that after similar sharp declines, the market has risen by an average of 40% within one year. Counterintuitive conclusions include:
- Market panic (VIX > 45) is actually a buy signal for the short and medium term, with an 85% probability of gains over the next year.
- Trump’s tariff policies may be forced to adjust due to political pressure (internal opposition from Republicans, midterm election considerations).
- Even if a cyclical bear market emerges, the long-term bull market (annualized 16.9% since 2009) could still continue.
Key Arguments and Data
1. Market Performance Data
| Index | Quarterly Decline | Peak-to-Trough Decline | Two-Day Decline After April 2 |
|---|---|---|---|
| S&P 500 | -4.6% | -10.7% | -10.5% |
| Nasdaq | -10.4% | -16.6% | -22% (entering bear market) |
| Dow Jones | -1.3% | -9.8% | - |
| Russell 2000 | - | -27% | -30% (near bear market) |
2. Historical Comparison
- The two-day plunge of 10.5% on April 2 is the fifth worst performance in 50 years, trailing only the 1987 crash, COVID-19, and the financial crisis.
- After each similar crisis, the average one-year gain was +40%.
- When VIX > 45, the probability of a rise over the next two weeks is 75%, and over the next year is 85%, with an average gain of 17%.
3. Panic Indicators
- Goldman Sachs’ institutional net long/short ratio recorded its largest monthly decline since 2016, hitting a five-year low.
- Friday’s trading volume was the highest since Goldman Sachs began tracking in 2010.
- The put/call ratio surged above 1.
- Over 60% of S&P 500 stocks have fallen more than 20% from their highs.
4. Quantifying Tariff Impact
- The total known planned tariffs exceed $700 billion, equivalent to 2.4% of GDP.
- This is the largest tariff initiative since the Smoot-Hawley Tariff Act during the Great Depression.
- Market wealth has evaporated by over $6 trillion. At a 20% tax rate, this equates to a $1.2 trillion loss in federal tax revenue, more than 1.5 times the estimated annual tariff revenue.
5. Valuation
- The S&P 500 currently trades at a P/E ratio of 18.6x (based on this year’s earnings estimates, which have not yet been revised down).
- At the start of the year, the P/E was around 21x, while the 30-year average is 16.9x.
- A further decline of about 10% would bring it to the historical average.
Companies/Assets Involved
| Company | Peak-to-Trough Decline | Role/Judgment |
|---|---|---|
| Nvidia (NVDA) | -40% | AI leader, hardest hit by doubts over the sustainability of AI investment |
| Alphabet (GOOGL) | -30% | Mag 7 member, momentum stocks severely battered |
| Meta Platforms (META) | -33% | Same as above |
| Amazon.com (AMZN) | -32% | Same as above |
| Microsoft (MSFT) | -23% | Relatively smaller decline |
| European/Japanese Markets | Outperformed S&P 500 (ex-Nvidia) | Relative performance, per JP Morgan data |
Key Figures’ Views:
- Warren Buffett: Refused to answer economic questions, calling tariffs "a kind of act of war" and, over the long term, "a tax on goods."
- Blackrock CEO Larry Fink: Most CEOs believe the U.S. has already entered a recession.
- Venture capitalist Vinod Khosla: Believes the AI transformation is the biggest technological change since 1980.
Investment Implications
1. Short-term tactical opportunity: Panic indicators (VIX > 45, extreme short positioning) are contrarian buy signals; a tariff negotiation deal is the most likely catalyst for a rebound.
2. Medium-term strategy: If tariffs are reduced to a universal level of 10%, the market will rebound strongly, and a recession may be avoided; otherwise, prepare for a cyclical bear market.
3. Valuation anchor: A further 10% decline in the S&P 500 to a P/E of 16.9x (30-year average) represents a reasonable buying zone.
4. Political game: Trump’s political support is weakening (Republican Senators Rand Paul and Ted Cruz have publicly opposed him, and legal challenges have been filed); the market may test his tolerance limits.
5. Risk warning: Protectionism and isolationism could threaten the U.S. dollar’s status as the global reserve currency, pushing up borrowing costs—this is a more severe long-term risk than the tariffs themselves.
Theme and Background
This chapter focuses on the sustainability of the AI investment boom and whether the current market pullback presents a buying opportunity. The author argues that despite widespread skepticism about the return on AI capital expenditure, tech leaders generally believe AI is still in its early stages, with transformative potential comparable to electricity or the internet. The report also analyzes the valuation appeal of cyclical sectors (e.g., airlines, cruise lines) following panic selling.
Core Views
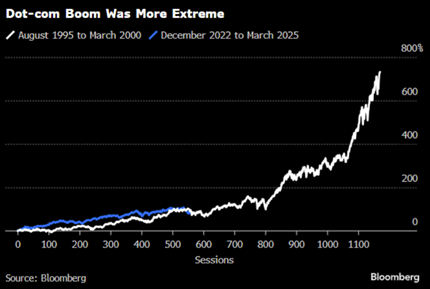
- The AI bubble narrative is exaggerated: The Nasdaq 100 currently trades at a P/E of 35x, far below the 90x peak of the tech bubble, and valuations of AI-related companies have not reached extreme levels.
- Skepticism about AI investment returns is short-sighted: The ROI of electricity is difficult to calculate precisely, yet its societal value is immense; AI's returns should not be measured solely by direct financial metrics.
- Market doubts about AI earnings sustainability are already priced in: Nvidia trades at 22x current earnings with expected earnings growth of 51%, reflecting a significant uncertainty discount.
- Cyclical sectors have fully priced in a recession: Companies in airlines and cruise lines have seen stock prices drop over 50%, and current valuations already imply the worst-case scenario, offering asymmetric risk-reward.
Key Arguments and Data
1. Comparison of AI with historical bubbles:
- Nasdaq 100 current P/E of 35x vs. tech bubble peak of 90x.
- The author believes that if AI is a transformative force akin to the internet, current valuations represent a buying opportunity.
2. Analogy for AI investment returns:
- The average return on capital for U.S. utilities is only 7%, with an equity return of 11% (Aswath Damodaran data), yet electricity remains indispensable.
- The internet is equally indispensable, but its monetization model is entirely different, suggesting that AI's return model may not yet be understood.
3. Valuation comparison of tech giants (current price vs. growth rate alignment):
| Company | P/E Ratio | Expected Earnings Growth |
|---|---|---|
| Nvidia (NVDA) | 22.0x | 51% |
| Microsoft (MSFT) | 25.8x | 11% |
| Apple (AAPL) | 24.4x | 8% |
| Amazon (AMZN) | 27.7x | Mid-teens |
| Meta (META) | 20.5x | High single digits |
4. Historical patterns in cyclical sectors:
- Airline stocks: United Airlines (UAL) and American Airlines (AAL) triggered JP Morgan's "30-in-30" buy rule (down 30% in 30 days). This signal has resulted in a 100% rebound within 180 days since the 1990s, with 71% of cases seeing gains exceeding 50%.
- Cruise line stocks: Norwegian Cruise Line (NCLH) has fallen over 50% from its peak. At a current price of $15.50, it trades at 2025 expected earnings of $2.45. Even assuming recession earnings of $1.25-1.40, a 12-14x historical P/E fully prices in a recession.
5. Portfolio performance and historical drawdown patterns:
- The Opportunity fund fell 9.3% in Q1, underperforming the S&P 500's 4.3% decline by 506 basis points; as of April 7, it was down 20.5% year-to-date.
- Historical data shows that when the fund declines 15% over 30 days, the average gain over the next two years is 69%.
Companies/Assets Involved
- Nvidia (NVDA): Core holding, bullish. Currently at $97.64, 22x P/E, with expected earnings growth of 51%. The author believes the market overestimates doubts about its earnings sustainability, and the company remains supply-constrained (Blackwell chip capacity insufficient).
- Amazon (AMZN), Alphabet (GOOGL), Meta (META): Bullish. Reasonable valuations, strong cash flows, and core beneficiaries of the AI revolution.
- United Airlines (UAL): Bullish. Currently at $58.77, 5-6x expected P/E (historical 8-9x). If earnings and historical valuations recover to 2025 expectations within 5 years, annualized return is 13%; under a recession scenario, annualized return is 15-20%.
- Delta Air Lines (DAL): Bullish. Currently at $37.29, similar logic. Annualized return of 11% (conservative) to 15-20% (recession scenario).
- Norwegian Cruise Line (NCLH): Bullish. Currently at $15.50, fully pricing in a recession. Conservative scenario yields 13% annualized return; if earnings recover to peak levels within 3 years (similar to post-financial crisis), annualized return is 14%.
Investment Implications
- AI theme: Current environment is for positioning, not exiting. Valuations of tech giants are far below bubble levels, and growth does not match valuation (Nvidia's PEG is only 0.43). Investors should focus on the long-term transformative logic rather than short-term debates over capital expenditure returns.
- Cyclical sectors: Buy during panic. Sectors like airlines and cruise lines have priced in the worst-case scenario, and historical patterns show a high probability of rebounds after such steep declines. It is recommended to gradually build positions amid recession fears rather than waiting for confirmation.
- Portfolio management: Accept short-term volatility for long-term excess returns. The author explicitly prefers "short-term trading risk/cyclical risk" over "long-term permanent capital loss risk," and historical return patterns following such drawdowns support this strategy.
Theme & Background
This chapter focuses on the specific positioning logic of Patient Capital amid current market uncertainty. The report argues that although tariff-induced recession risks have risen, the core holdings in the portfolio possess the ability to navigate cycles, and current valuations offer a high margin of safety. The author emphasizes that the core of portfolio construction is the expected long-term compound return, not short-term market volatility.
Core Views
- Cruise and airline stocks have "recession-resistant" attributes, as they are 35% cheaper than land-based vacations, and most people can drive to ports, so tariffs have limited direct impact on them, only indirect economic shocks.
- The largest positions in the current portfolio can generate returns under multiple scenarios, including Amazon, QXO, Royalty Pharma, CVS, Alphabet, and Citigroup. These companies either have valuations at historical lows or possess non-cyclical business characteristics.
- The portfolio's overall implied upside is 156%, at a historical high. The author believes that at current market levels, historical indicators point to substantial returns.
Key Arguments & Data
- Cruise & Airlines: The report cites a top travel expert's view that cruises have "recession-resistant" characteristics due to their price advantage (35% cheaper than land-based vacations) and drive-to-port accessibility. Tariffs do not directly affect these industries, only temporarily through economic shocks or travel boycotts.
- Amazon (AMZN): Current P/E ratio of 27.7x. The author compares it to Cisco (CSCO) after the 2000 tech bubble—CSCO's P/E ratio hit 27x at the bear market bottom, consistent with Amazon's current level. Amazon has the most durable and best growth prospects in the market, with room for margin expansion.
- QXO (QXO): Brad Jacobs' acquisition platform, which just announced the acquisition of Beacon Roofing. The transaction-adjusted EV/EBITDA is 10-11x. Market weakness may enhance its ability to execute attractive deals. Most roofing demand is non-discretionary (people always need shelter).
- Royalty Pharma (RPRX): A healthcare royalty investment company with a P/E ratio of 6.6x, and its business is relatively insulated from the economic cycle.
- CVS (CVS): A health services company with a P/E ratio of 10.8x, but at an earnings trough.
- Alphabet (GOOGL): P/E ratio of 16.3x. Despite market concerns about long-term risks to the search business, actual performance has not been affected. The author estimates that excluding the value of other businesses, the search business's actual P/E ratio is only in the mid-single digits.
- Citigroup (C): A global bank undergoing a transformation to improve returns. Its stock price is 65% of tangible book value ($89). Even in a recession, the author believes 5-year returns could still reach low double digits; without a recession, returns would be higher.
Comparison Data Table:
| Company | Stock Price (2025/4/7) | Valuation Metric | Key Judgment |
|---|---|---|---|
| Amazon (AMZN) | $175.26 | 27.7x P/E | Best growth prospects, room for margin expansion; consistent with CSCO's historical bottom valuation |
| QXO (QXO) | $13.55 | 10-11x EV/EBITDA | Value-oriented, market weakness favors M&A; roofing demand is non-discretionary |
| Royalty Pharma (RPRX) | $31.03 | 6.6x P/E | Business insulated from economic cycle |
| CVS (CVS) | $63.85 | 10.8x P/E | Earnings at trough, valuation has margin of safety |
| Alphabet (GOOGL) | $146.75 | 16.3x P/E | Search business actual valuation is extremely low (mid-single digits), performance unaffected |
| Citigroup (C) | $58.85 | 65% of tangible book value | In transformation, recession would only delay, not derail progress |
Companies/Assets Involved
- Norwegian Cruise Line (NCLH): Bullish. The report believes its EPS can maintain low double-digit growth for over a decade. If correct, the annualized compound return would be close to 20%. Tariffs do not directly affect it, only through temporary economic shocks.
- Amazon (AMZN): Bullish. Core holding. Its low-price strategy, excellent management, and diversified supplier base allow it to adapt to most scenarios. Valuation is high but defensible.
- QXO (QXO): Bullish. Brad Jacobs' acquisition platform, with the first deal announced. Market weakness is a positive, enhancing M&A capabilities.
- Royalty Pharma (RPRX): Bullish. Low valuation (6.6x) and business insulation.
- CVS (CVS): Bullish. Low valuation (10.8x) but earnings at trough.
- Alphabet (GOOGL): Bullish. Search business actual valuation is extremely low, market concerns have not materialized.
- Citigroup (C): Bullish. Stock price far below tangible book value, in transformation, recession would only delay, not derail progress.
Investment Implications
- Focus on "recession-resistant" cyclical industries: Cruise and airline stocks may outperform expectations during a recession due to price advantages and demand rigidity. Investors can consider deploying into such assets during periods of panic.
- Embrace low-valuation, non-discretionary assets: Such as QXO (roofing demand), Royalty Pharma (healthcare royalties), and CVS (health services), which have stable demand during economic downturns.
- Be wary of high-valuation but sustainably growing tech giants: Amazon and Alphabet are not cheap at current valuations, but their growth prospects and margin expansion potential provide a margin of safety. Investors should distinguish between "high valuation" and "bubble"—the latter, like Cisco in 2000, contrasts with Amazon's current valuation, which aligns with Cisco's bottom and has stronger fundamentals.
- Use market panic to buy discounted assets: Citigroup's stock price is only 65% of tangible book value. Even in a recession, 5-year returns could reach low double digits. Market panic offers opportunities to buy below intrinsic value.
- Portfolio overall implied upside of 156%: Current market panic levels (VIX > 45) historically correspond to an 85% probability of a positive return over the next year, with an average gain of 17%. Investors should remain patient and avoid selling during panic.