1Q25 Portfolio Activity and Attribution
Patient Capital Management is a Baltimore asset manager founded in 2020 by Samantha McLemore, CFA — Bill Miller's long-time co-manager (working together since 2002, running the flagship Opportunity Equity strategy since 2014). Continuing the Miller-school contrarian tradition, it practices "time arbitrage": exploiting behavioral mispricing to concentrate in controversial growth names (tech, healthcare, Bitcoin-related) at deep discounts to intrinsic value. Its site preserves Bill Miller's complete 1995-2022 market letters, alongside ongoing quarterly letters and webinars.
In plain words
This report explains how a pro investor handled the early-2025 market drop. The S&P 500 fell nearly 19% from its peak, close to a bear market (down 20%+). But history suggests optimism: in 17 similar drops over 85 years, stocks rose 82% of the time the next year. The manager bought healthcare and Chinese stocks like Alibaba and JD.com, which earn most revenue at home and are less hurt by tariffs. He added Carvana (online used cars) and New Fortress Energy (LNG). Takeaway: don't panic during downturns—long-term returns have been strong after big declines.
Patient Capital's Patient Opportunity Equity Strategy posted a net return of -9.5% in the first quarter of 2025, underperforming the benchmark S&P 500's -4.3%. Portfolio performance was dragged down by stock selection effects, with the largest positive contributions from Alibaba Group Holdings (BABA
Theme and Background
This chapter reviews the portfolio changes, performance attribution, and market environment of the Patient Opportunity Equity Strategy in the first quarter of 2025. The report notes that the market experienced a sharp reversal after hitting an all-time high in mid-February, with the S&P 500 retreating 8.7% from its peak and further widening to 18.9% by April 8, approaching bear market territory (a decline of over 20%). The author emphasizes that historically, the probability of long-term positive returns after a 20% drawdown is extremely high, and the current market panic presents an opportunity for contrarian positioning.
Core Views
- Short-term volatility does not alter the pattern of long-term positive returns: The author argues that despite the real risks posed by tariff policies, historical data shows that the probabilities of positive returns 1, 3, and 5 years after a 20% drawdown are 82%, 94%, and 100%, respectively, with average annualized returns of 21%, 14%, and 12%. Market panic is an opportunity for long-term investors.
- Healthcare and Chinese assets were the quarterly highlights: The report points out that the healthcare sector performed best due to its defensive characteristics, followed by Chinese investments. The author strategically increased holdings in these two areas during last year's weakness, reaping rewards this quarter.
- Contrarian judgment: The author believes that although tariff headlines have caused Chinese stocks to give back some gains, Alibaba and JD.com generate most of their revenue from mainland China, with limited exposure to overseas income, making them more defensive than current market prices reflect. Meanwhile, trade tensions may force China to introduce more aggressive stimulus policies.
Key Arguments and Data
- Historical market drawdowns and returns:
| Indicator | Data |
|---|---|
| S&P 500 drawdown from February peak | -8.7% |
| Peak decline on April 8 | -18.9% |
| Number of bear markets in the past 85 years | 17 times (20% of years) |
| Proportion of bear markets accompanied by economic recession | 53% |
| Probability of positive returns 1 year after a 20% drawdown | 82% |
| Probability of positive returns 3 years after a 20% drawdown | 94% |
| Probability of positive returns 5 years after a 20% drawdown | 100% |
| Average annualized return 1 year after a 20% drawdown | 21% |
| Average annualized return 3 years after a 20% drawdown | 14% |
| Average annualized return 5 years after a 20% drawdown | 12% |
- Portfolio performance and attribution:
- Portfolio net return: -9.5%, underperforming the benchmark S&P 500's -4.3%.
- The three-factor attribution model shows: allocation effect and interaction effect were positive, but the selection effect was negative, dragging down overall performance.
- Top ten holdings account for 50.5% (index 33.6%), with an active share of approximately 97.4%.
- New entries and liquidations:
- Added 5 positions: Carvana Co. (CVNA), New Fortress Energy Inc. (NFE), JD.com Inc. (JD), and a call spread on Nvidia Corp. (NVDA) (buy NVDA 9/19/25 C118, sell NVDA 9/19/25 C150).
- Liquidated 3 positions: Expand Energy Corporation (EXE), Green Thumb Industries Inc. (GTBIF), and closed the short leg of the NVDA call spread (NVDA 9/19/25 C150).
- CVS Health: Increased holdings when it hit a ten-year low, believing that issues with the Medicare Advantage business would be resolved. The 2026 rate showed strong improvement, validating this judgment.
- Royalty Pharma: Announced the acquisition of an external manager in early January, simplifying the operating model and strengthening alignment between management and shareholder interests.
- Carvana: The world's largest pure online used car retailer, already capturing 1% of a $1 trillion addressable market (TAM). The company achieves industry-leading EBITDA margins through its vertically integrated platform, with cost discipline and margin improvement following financing issues in 2022-2023.
- New Fortress Energy: A vertically integrated LNG infrastructure company with strategic import terminals in Jamaica, Puerto Rico, Mexico, Nicaragua, and Brazil. CEO Wes Edens is also co-CEO of Fortress Investment Group and the company's largest shareholder. The report believes that if execution is good, the stock could achieve "multi-bagger" returns from current levels.
- JD.com: A leading Chinese e-commerce company, focusing on consumer electronics and home appliances, creating differentiation. The company is undergoing a one-year organizational restructuring to return to its core business. Government subsidies for trade-ins of home appliances support demand. In 2024, it repurchased 8.1% of its shares, with a dividend yield of 3.0%.
Companies/Assets Involved
| Company/Asset | Role | Key Data | Bullish/Bearish |
|---|---|---|---|
| Alibaba Group Holdings (BABA) | One of the largest contributors | Hit historical lows last year; revenue primarily from mainland China | Bullish |
| CVS Health Corp. (CVS) | One of the largest contributors | Increased holdings at ten-year low; 2026 Medicare Advantage rate improvement | Bullish |
| Royalty Pharma PLC (RPRX) | One of the largest contributors | Acquired external manager in January; simplified operations | Bullish |
| Precigen Inc. (PGEN) | One of the largest contributors | No specific data provided | Bullish |
| Precigen Perpetual Preferreds | One of the largest contributors | No specific data provided | Bullish |
| Dave & Buster’s (PLAY) | One of the largest detractors | No specific data provided | Bearish |
| Seadrill Limited (SDRL) | One of the largest detractors | No specific data provided | Bearish |
| Illumina Inc. (ILMN) | One of the largest detractors | No specific data provided | Bearish |
| Alphabet Inc. (GOOGL) | One of the largest detractors | No specific data provided | Bearish |
| Kosmos Energy Ltd (KOS) | One of the largest detractors | No specific data provided | Bearish |
| Carvana Co. (CVNA) | New position | 1% share of $1 trillion TAM; industry-leading EBITDA margins | Bullish |
| New Fortress Energy Inc. (NFE) | New position | CEO is the largest shareholder; high leverage but expected deleveraging | Bullish |
| JD.com Inc. (JD) | New position | Dividend yield 3.0%; repurchased 8.1% in 2024; revenue primarily domestic | Bullish |
| Nvidia Corp. (NVDA) Call Spread | New position | Buy C118/Sell C150, expiring September 19 | Bullish (limited upside) |
| Expand Energy Corporation (EXE) | Liquidated | No specific data provided | Bearish |
| Green Thumb Industries Inc. (GTBIF) | Liquidated | No specific data provided | Bearish |
Investment Implications
- Contrarian positioning on historical drawdowns: The current market is near the edge of a bear market, but historical data shows a very high probability of long-term positive returns after a 20% drawdown. Investors should use the panic period to increase holdings rather than reduce them.
- Focus on defensive and structural opportunities: Healthcare (e.g., CVS, Royalty Pharma) and Chinese e-commerce (e.g., Alibaba, JD.com) are more resilient under tariff shocks due to their revenue primarily coming from domestic markets. China's stimulus policies may be further intensified, benefiting domestic demand-driven companies.
- Watch for deleveraging and execution improvement targets: Both New Fortress Energy and Carvana have experienced cost discipline improvements after financial pressures. If execution goes smoothly, they could offer significant upside. Carvana's $1 trillion TAM and industry-leading margins are core theses.
- Be cautious about tariff risks but not overly pessimistic: The report argues that trade tensions may force China to introduce more aggressive stimulus, and JD.com and Alibaba have limited overseas revenue exposure, so the market may be overreacting to their declines.
Theme & Background
This chapter provides a detailed analysis of the main contributors and detractors in Patient Capital’s portfolio during the first quarter of 2025, explaining the logic behind each trade. The report focuses on the AI sector volatility triggered by the DeepSeek event, the value revaluation of Chinese assets, and the structural opportunities and risks in the healthcare and energy sectors.
Core Views
The author believes the market’s panic reaction to DeepSeek was overdone, and the bullish put spread trade on Nvidia profited as a result. The core logic of portfolio adjustments was to deleverage and concentrate holdings into assets with the best risk-reward profiles. The author is firmly bullish on Alibaba’s relative defensiveness in a tariff environment and on CVS’s earnings recovery following improved Medicare Advantage pricing. For the detractors, the author argues that the negative factors for Dave & Buster's and Illumina have been fully priced in, and current valuations present buying opportunities.
Key Arguments & Data
Main Contributors:
- Alibaba (BABA): DeepSeek’s AI product launch raised market expectations for the competitiveness of Chinese tech companies. The company has initiated a 1.0% dividend yield and a buyback program, repurchasing 7% of its outstanding shares over the past 12 months. The report emphasizes that only 12% of Alibaba’s revenue comes from outside China, making it relatively “insulated” from the tariff war.
- CVS Health (CVS): The CMS-released 2026 Medicare Advantage rates were at the high end of expectations, supporting a significant earnings recovery. The company’s asset portfolio includes Aetna, Caremark, Signify Health, and Oak Street Health, supporting a transition to a value-based care model. The current dividend yield is 4%.
- Royalty Pharma (RPRX): The stock rose 23% after acquiring its external manager, simplifying the business model and aligning it more closely with management interests. As a partner in external royalty financing, the company has achieved low double-digit (unlevered) internal rates of return (IRR) for over 20 years.
Main Detractors:
- Dave & Buster's (PLAY): The stock fell to its lowest valuation in history, trading at just 6.8 times forward earnings. The company repurchased 12% of its outstanding shares over the past 12 months. The new CEO (also Board Chairman) is implementing a “back-to-basics” strategy, with March and April performance exceeding expectations.
- Seadrill (SDRL): The world’s fourth-largest pure-play deepwater drilling company. Nearly half of the global deepwater rig fleet has been scrapped over the past decade, and industry consolidation has created a more rational competitive landscape. However, strong onshore production in the US, Canada, and Russia is suppressing oil prices and contract rates.
- Illumina (ILMN): Placed on a Chinese blacklist, facing NIH funding cuts, and new competition from Roche. The company has lowered guidance to reflect a 7% revenue loss from China and initiated a $100 million cost-saving plan. The current stock price is only 16 times forward earnings, and its market share remains around 80%.
Comparison Data:
| Company | Net Contribution (bps) | Key Valuation/Data | Core Logic |
|---|---|---|---|
| Alibaba (BABA) | +166 | 12% revenue from overseas; repurchased 7% of shares | China AI catalyst; relatively defensive in tariffs |
| CVS Health (CVS) | +146 | Dividend yield 4% | Medicare Advantage rate improvement; asset portfolio value |
| Royalty Pharma (RPRX) | +75 | Stock +23%; low double-digit IRR | Management buyout simplifies structure; royalty financing market expands |
| Dave & Buster's (PLAY) | -114 | 6.8x forward PE; repurchased 12% of shares | Valuation at historical lows; new CEO improves operations |
| Seadrill (SDRL) | -113 | Net cash; nearly half of rigs scrapped | Deepwater drilling supply constrained; but onshore output pressures prices |
| Illumina (ILMN) | -108 | 16x forward PE; 80% market share | Negative factors priced in; long-term gene sequencing growth |
Companies/Assets Involved
- Nvidia Corp. (NVDA): A bullish put spread trade was established during the DeepSeek sell-off and subsequently closed for a profit on the rebound. The author believes the market overreacted.
- Alibaba Group Holdings (BABA): Bullish. The stock rebounded sharply after the DeepSeek event but later gave back gains due to tariff tensions. The author believes its high domestic revenue exposure (88%) makes it a relatively safe Chinese asset.
- CVS Health Corp. (CVS): Bullish. Improved Medicare Advantage pricing is the core catalyst, and the asset portfolio (insurance + PBM + home health) has long-term value.
- Royalty Pharma PLC (RPRX): Bullish. The management buyout simplifies the structure, the royalty financing market continues to expand, and the company is the partner of choice.
- Dave & Buster's Entertainment (PLAY): Bullish (turnaround play). Valuation is at historical lows, the new CEO is implementing a “back-to-basics” strategy, and March-April performance improved. Hill Path Capital has joined the board.
- Seadrill Ltd (SDRL): Bullish (cyclical turnaround). Deepwater drilling supply is constrained, the company is net cash with a specialized fleet, and it could be an industry consolidator or acquisition target.
- Illumina Inc. (ILMN): Bullish (value trap?). Negative factors are fully priced in, market share is solid (80%), and the long-term growth thesis for gene sequencing + AI remains intact.
- Expand Energy Corporation (EXE): Position closed to free up capital for new ideas.
- Green Thumb Industries Inc. (GTBIF): Position closed to free up capital for new ideas.
Investment Implications
1. Chinese Tech Assets (Alibaba): In the context of escalating tariffs, focus on Chinese companies with high domestic revenue exposure. The DeepSeek event shows a cognitive bias in the market against the “uninvestable” Chinese tech sector, and AI catalysts could trigger a value revaluation.
2. Healthcare (CVS, Illumina): Improved Medicare Advantage rates are a clear earnings catalyst; look for similar policy-driven opportunities. Illumina’s valuation already reflects most negative factors, and its long-term growth thesis (gene sequencing + AI) is not yet priced in.
3. Turnaround Plays (Dave & Buster's): When a company’s valuation is at historical lows (6.8x PE) and management is aggressively buying back shares (12% of float), there may be asymmetric return opportunities even before a clear fundamental improvement. Monitor whether the new CEO’s “back-to-basics” strategy can be sustained.
4. Energy (Seadrill): Constrained deepwater drilling supply is a long-term structural positive, but short-term prices are suppressed by onshore production. Watch for catalysts like an oil price rebound or industry consolidation. Seadrill’s net cash position and specialized fleet provide resilience in a cyclical turnaround.
5. Portfolio Management: With an active share of 97.4% and the top ten holdings accounting for 50.5% of the portfolio, this strategy is highly concentrated. Investors should assess whether their own risk tolerance matches this style of high concentration and high turnover.
Theme and Background
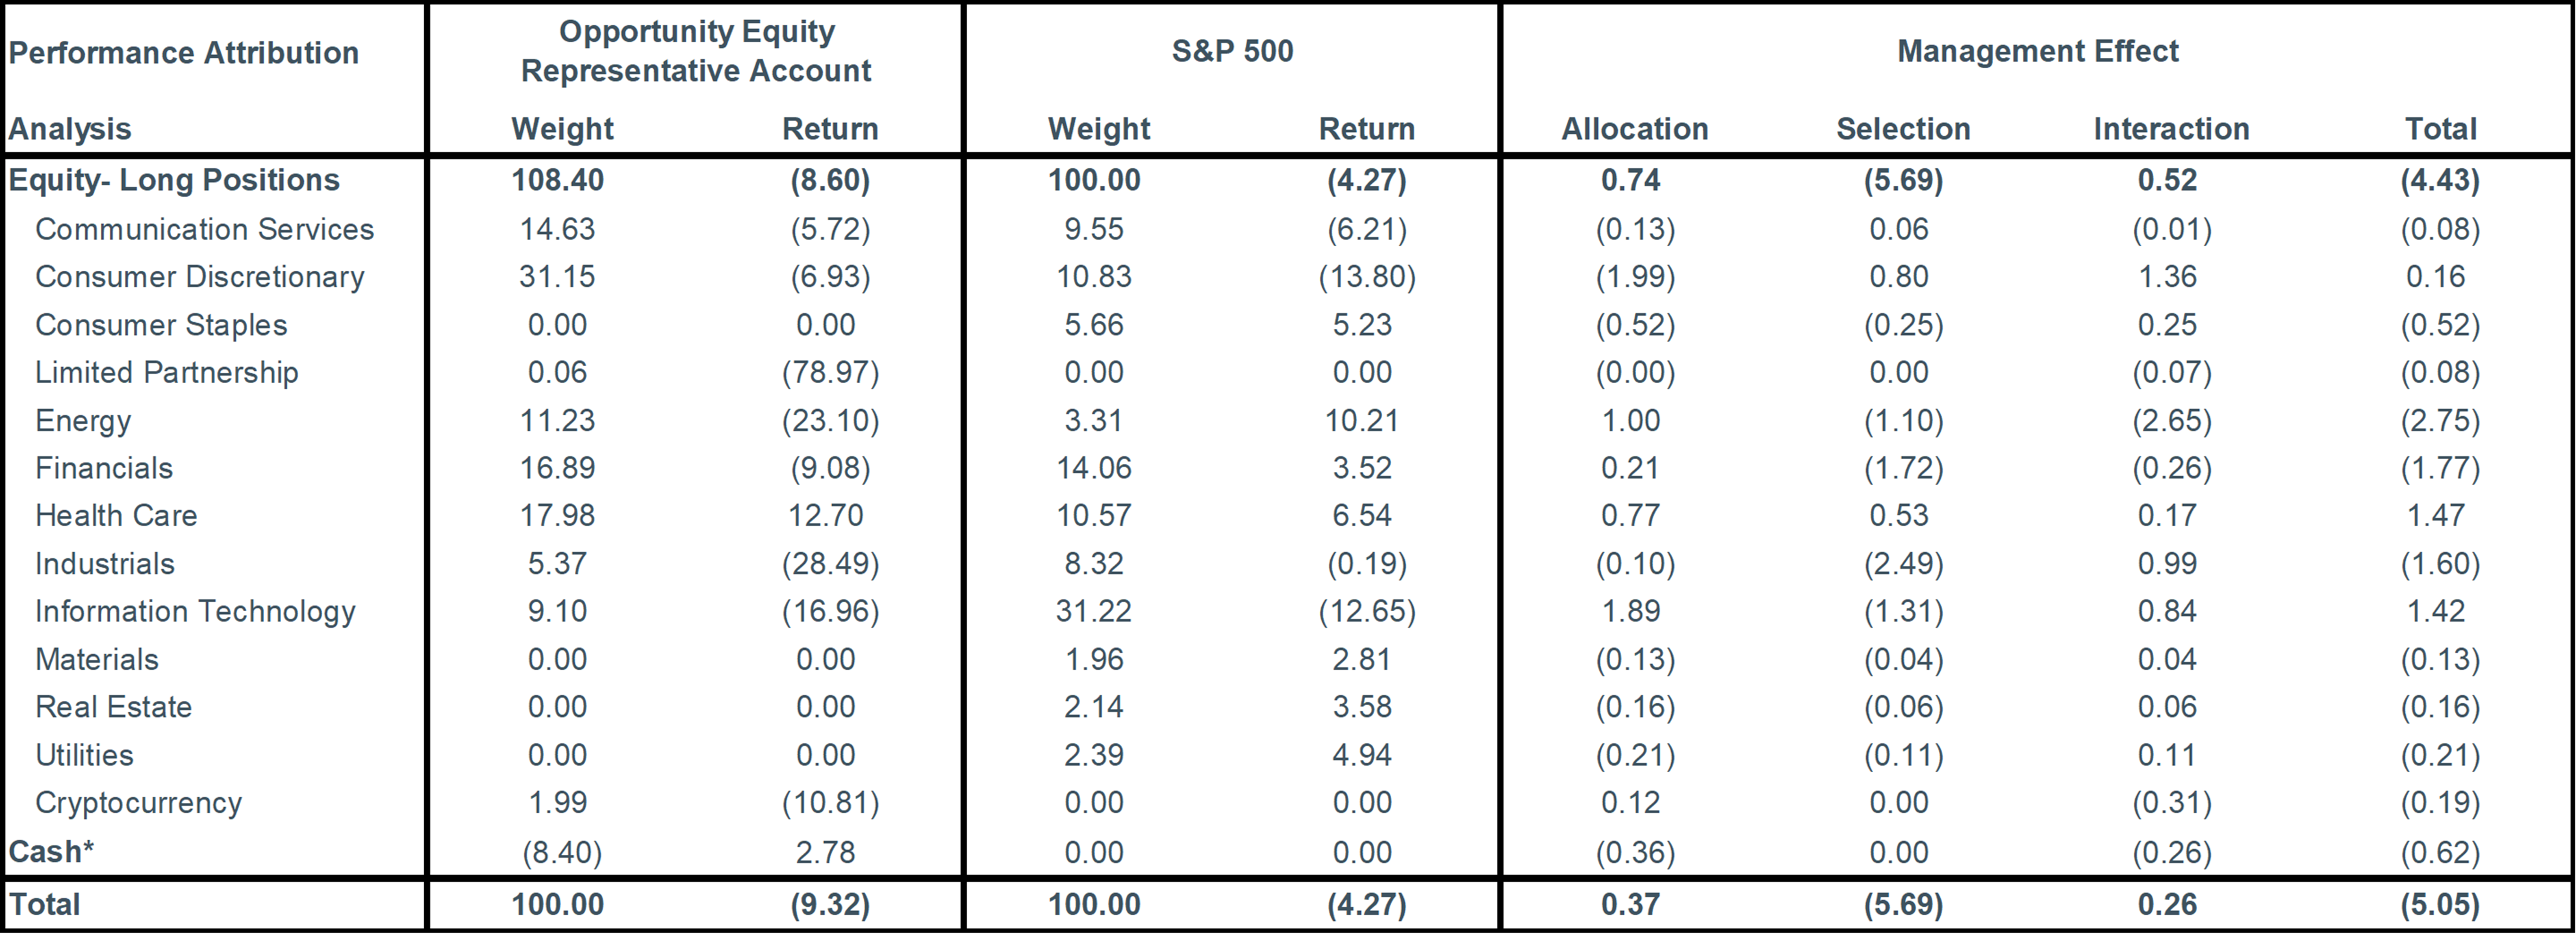
This chapter uses attribution analysis to decompose the sources of excess returns for the Patient Opportunity Equity Strategy in the first quarter of 2025, focusing on the impact of three factors—Allocation, Selection, and Interaction—on the portfolio's relative performance against the S&P 500 benchmark. The report also notes that the calculation methodology of third-party attribution software may lead to counterintuitive industry effect results; for example, even if the portfolio overweights a well-performing industry, the software may still calculate a negative industry allocation effect.
Core Viewpoint
The author's core investment thesis is: The portfolio's excess returns primarily stem from stock selection, not industry allocation. Although the portfolio actively deviates from the benchmark across multiple industries, attribution analysis shows that the selection effect is the key variable driving relative performance. The report implicitly argues that in a highly dispersed market, bottom-up stock research can generate more alpha than top-down industry rotation.
Key Arguments and Data
- Attribution Framework: The portfolio's excess returns are decomposed into three factors—Allocation (differences in industry weights), Selection (differences in stock weights within industries), and Interaction (the cross-effect between industries and stock selection). The sum of these three factors equals the total excess return of the portfolio relative to the benchmark.
- Counterintuitive Industry Effects: The report specifically warns that the calculation methodology of third-party software may produce "counterintuitive" results. For instance, even if the portfolio overweights a well-performing industry during a given period, the software may still show a negative industry allocation effect, as the allocation effect in recent months may outweigh the impact of earlier months.
- Data Sources: Attribution data comes from third-party software APX, based on a representative account, net of a 1% annual management fee (deducted quarterly), and includes cash. The portfolio's total return reflects price changes, dividends, and other income.
Companies/Assets Involved
This chapter does not directly mention specific companies or assets, instead focusing on attribution methodology. However, the report references a related article (Samantha McLemore's Q1 Commentary), suggesting that detailed stock-level analysis is covered in another chapter.
Investment Implications
- Focus on Stock-Picking Ability Rather Than Industry Bets: Investors should evaluate the depth of a fund manager's stock research rather than overemphasizing deviations in industry allocation. Attribution analysis shows that even if the industry allocation effect is negative, a strong selection effect can still drive excess returns.
- Be Wary of the Limitations of Attribution Software: The calculation methodology of third-party attribution tools may distort the true direction of industry effects. Investors should cross-validate with the portfolio's holding changes and industry performance, rather than mechanically relying on the numbers output by the software.
- Prioritize a Long-Term Perspective: The report emphasizes that attribution results "over a longer time frame" may be more reliable, implying that short-term attribution data (e.g., for a single month) is susceptible to methodological noise, and investors should focus on cumulative effects over quarters or years.