What Every Portfolio Needs: Underperformers
Patient Capital Management is a Baltimore asset manager founded in 2020 by Samantha McLemore, CFA — Bill Miller's long-time co-manager (working together since 2002, running the flagship Opportunity Equity strategy since 2014). Continuing the Miller-school contrarian tradition, it practices "time arbitrage": exploiting behavioral mispricing to concentrate in controversial growth names (tech, healthcare, Bitcoin-related) at deep discounts to intrinsic value. Its site preserves Bill Miller's complete 1995-2022 market letters, alongside ongoing quarterly letters and webinars.
In plain words
This article explains why owning stocks that have recently performed poorly (the 'underperformers') may be the smartest move for investors. The S&P 500 is up 22% this year, yet a record $6.5 trillion sits in money market funds—a sign of fear. The author argues that this fear actually supports the bull market, and that today's laggards often become tomorrow's winners. Using examples like Harvard's endowment and Tiger Fund, it shows how chasing hot trends and changing strategies destroys returns. For ordinary investors, the takeaway is simple: ignore short-term news (jobs, inflation), hold onto out-of-favor stocks, and avoid panic selling.
Patient Capital's third-quarter report notes that the market has risen amid concerns, with the Opportunity Equity Strategy posting a quarterly return of 5.8%, slightly below the S&P 500's 5.9%. The core thesis emphasizes sticking to long-term investing and avoiding short-term noise. The report stres
Theme and Background
This chapter opens with a quote from Mark Twain, discussing how the market climbed a "wall of worry" in the third quarter, with short-term noise (such as seasonal weakness and China risks) proving better than expected. The author uses this to reaffirm the core philosophy of long-term investing, criticizing how short-termism undermines compounding, and cites historical cases to illustrate that chasing winners and selling losers, along with strategy shifts, are investors' greatest enemies.
Core Views
- The market remains in a bull market: Since the 2022 low, the S&P 500 has risen 61%, marking the fourth strongest cyclical bull market since World War II. Although defensive stocks have outperformed cyclical stocks and money market fund assets have hit a record high ($6.5 trillion), the author argues that these "cautionary signals" actually support the bull market rather than signaling a top.
- Counterintuitive judgment: The author believes that many "certain facts" investors "know" (such as the tech bubble or the "new normal" after the financial crisis) are actually wrong. The market is a discounting mechanism, with prices already reflecting fear and expectations; assets with the worst long-term performance often set the stage for high future returns.
- Adherence to value investing and contrarian operations: As a value manager, the author tends to sell strong stocks and buy weak ones, leading to short-term relative underperformance, but this differentiated strategy benefits over the long term.
Key Arguments and Data
- Market performance: The S&P 500 is up 22.1% year-to-date, the 16th best start since 1927; the Nasdaq is up 21.8%, and the Dow is up 13.9%. Small-cap stocks (S&P 600 up 9.3%, Russell 2000 up 11.2%) and international markets (MSCI World up 19.3%) have also risen.
- Investor behavior data: Money market fund assets have reached a record $6.5 trillion; defensive stocks outperformed cyclical stocks during the quarter (UBS data). Inflation is below the 50-year average, and economic growth is solid, yet recession fears have persisted throughout the entire uptrend.
- Historical compounding data: Since the end of 1927, the S&P 500 has grown at an annualized rate of 9.71%. A $1,000 investment over nearly 97 years would now be worth $7,881,300. Investors simply need to "buy and hold patiently," but doing so is extremely difficult.
- Hedge funds vs. S&P 500: Since the end of 2014, hedge funds have returned an average of 5.0% annually, compared to 13.0% for the S&P 500. A $1,000 investment in hedge funds would yield $1,606, while the S&P 500 would yield $3,270, nearly double the difference.
- Harvard endowment case: Over the past 20 years, the Harvard endowment has returned an annualized 8.8%, ranking seventh among the eight Ivy League schools. The reason was "reducing risk" after the financial crisis and shifting to natural resources (which performed well in the 2000s but poorly in the 2010s), committing the error of "buying high and selling low."
- Post-financial crisis market: After the March 2009 low, the S&P 500 rose at an annualized rate of 17.4%, 79% higher than its long-term average. PIMCO's "new normal" advocated active risk management, but it precisely missed the strongest decade.
- Tiger fund case: Julian Robertson achieved an annualized return of nearly 32% from 1980 to 1998, but because he refused to participate in the tech bubble in the late 1990s, clients redeemed heavily, and the fund closed in March 2000. He accurately predicted the bubble's burst but still failed.
Companies/Assets Involved
| Company/Asset | Role | Key Data | Bullish/Bearish |
|---|---|---|---|
| Opportunity Equity Strategy | Strategy managed by the author | Quarterly return of 5.8% (slightly below the S&P 500's 5.9%); year-to-date 16.6% (outperforming the Dow and small caps, underperforming the S&P 500); cumulative 63.0% since takeover at end of 2022 (annualized 32.1%), surpassing the S&P 500's 54.1% (annualized 28.0%) | Bullish (strong long-term performance, differentiated strategy) |
| S&P 500 | Benchmark index | Up 22.1% year-to-date; up 61% from the 2022 low; long-term annualized 9.71% | Bullish (bull market continues) |
| Nasdaq | Tech stock index | Up 21.8% year-to-date | Neutral (Mag 7 and tech stocks lagged in the quarter) |
| Dow | Blue-chip index | Up 13.9% year-to-date | Neutral |
| S&P 600 / Russell 2000 | Small-cap indices | Up 9.3% and 11.2% year-to-date, respectively | Neutral (lagging but still positive) |
| MSCI World | International index | Up 19.3% year-to-date | Neutral |
| Harvard Endowment | Case (long-term underperformance) | Annualized 8.8% over the past 20 years, ranked seventh among Ivy League schools | Bearish (strategy shifts led to failure) |
| Tiger Fund | Case (closed due to value adherence) | Annualized nearly 32% from 1980 to 1998; closed in March 2000 | Bearish (client redemptions caused failure, but strategy was correct) |
| PIMCO | Case (incorrect prediction) | Proposed the "new normal," advocating active risk management | Bearish (missed the strongest decade after the financial crisis) |
| Hedge Funds (overall) | Case (long-term underperformance) | Annualized 5.0% since end of 2014 vs. 13.0% for the S&P 500 | Bearish (defensive operations harmed compounding) |
Investment Insights
- Avoid short-termism: Do not let quarterly news (employment, inflation, Fed) dictate decisions. Most of it is noise, only clear in hindsight.
- Stick to long-term holding: The key to compounding is "doing nothing." History shows that selling in panic is the greatest killer of compounding.
- Contrarian operations: When the market is extremely pessimistic about a certain asset class (e.g., stocks after the financial crisis, value stocks in the late 1990s), it is time to add positions. Conversely, when an asset class is heavily favored (e.g., tech bubble, defensive stocks), be wary of high valuation risks.
- Beware of strategy shifts: The lessons from Harvard and Tiger Fund show that changing strategies due to short-term underperformance often leads to "buying high and selling low." Investors should evaluate the long-term logic of a strategy, not short-term rankings.
- Focus on market expectations: The market is a discounting mechanism. Assets with the worst long-term performance have already priced in extremely low expectations, making their future return potential the highest. The current outperformance of defensive stocks over cyclical stocks and record money market fund assets may imply that cyclical stocks and risk assets are undervalued.
Theme & Background
This chapter examines the valuation risks currently facing "quality compounders." The report notes that widespread market enthusiasm for these stocks has led to excessive valuations, potentially diminishing future return prospects. Through historical comparisons, the author warns that the current environment bears similarities to the "Nifty Fifty" bubble of the early 1970s.
Core Thesis
The author argues that while quality compounders have strong fundamentals, their current valuations are significantly elevated, warranting investor caution. Counterintuitive insight: Market consensus holds that "buying quality businesses at reasonable prices" is an eternal truth, but the author points out that when valuations become too high, even quality companies can deliver mediocre long-term returns. Central argument: Investors should currently avoid overvalued compounders and pivot toward overlooked value stocks, international equities, and small-cap stocks.
Key Arguments & Data
1. Historical Comparison: IBM vs. Standard Oil (1950-2010)
- Although IBM grew revenue per share and earnings per share at 11% annually (higher than Standard Oil's 8%), Standard Oil delivered a 14.5% annualized stock return versus IBM's 13.0%.
- Reason: Valuation divergence—IBM started with a P/E of 22.5x and a dividend yield of 2.2%; Standard Oil had a P/E of 12.9x and a dividend yield of 4.2%.
2. Current Overvaluation of Compounders
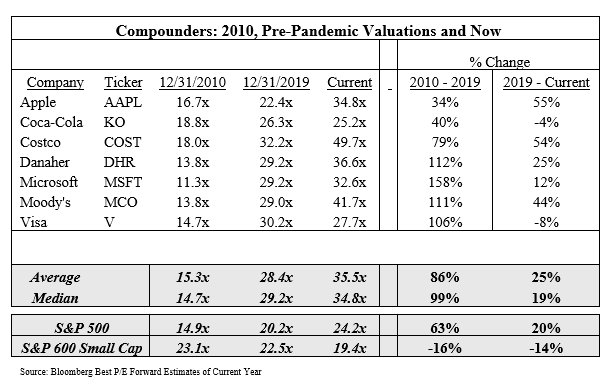
- The sample group of compounders trades at an average forward P/E of ~35.5x, a 47% premium to the S&P 500's 24.2x.
- In 2010, this premium was only 3%; it has since expanded dramatically.
- Since pre-pandemic levels, the average P/E of compounders has risen 25% (86% from 2010 to 2019), while the S&P 500 has increased 20% and 63%, respectively. Small-cap stocks (S&P 600) have seen their P/E decline by approximately 15%.
3. Comparison with the Nifty Fifty Bubble
- In December 1972, at its peak, the Nifty Fifty traded at a P/E of 41.9x (trailing twelve months), slightly above the current compounder group's 36.3x.
- The Nifty Fifty delivered an average return of 43% in the 12 months before the peak (compounders: 38.1%), and a 28% annualized return over the prior five years (compounders: 21%).
- After the bubble burst: The Nifty Fifty lost half its value within two years of the peak, and its returns over the subsequent 25 years merely matched the market.
4. Current Portfolio Valuation & Growth Comparison
| Metric | Portfolio | S&P 500 |
|---|---|---|
| Forward P/E | 12x | 22x |
| 1-Year Earnings Growth | 26% | 14% |
Companies/Assets Involved
- QXO (QXO): Newly purchased, becoming the portfolio's largest holding. Acquired via a PIPE transaction at $9.14, the stock rose to $15.77 by quarter-end (+73%). Brad Jacobs (who grew XPO from $3 to $108, annualizing over 30%) plans to replicate this success in building materials, targeting 25% annualized growth.
- Dave & Busters (PLAY): Newly purchased at $34.05. Pressured by weakness in lower-end consumer spending, but new management aims to boost EBITDA to $680–$915 million (current 2024 estimate: $528 million) through pricing, renovations, and cost savings. Expected free cash flow per share of $8–$9 in three years, implying a target price of $80–$85 at 10x P/E (annualized return of ~35%).
- JP Morgan: Fully exited. The author believes current valuation is fair and the stock is unlikely to outperform.
- Everi: Fully exited (acquired by Apollo).
- TCRT expired warrants: Fully exited.
Investment Implications
- Clear Direction: Avoid overvalued compounders and pivot toward small-cap, value, and international stocks. The author believes these overlooked areas offer lower valuations and greater growth potential.
- Specific Actions: The portfolio currently trades at 12x forward earnings (vs. 22x for the S&P 500) with faster earnings growth (26% vs. 14%), indicating the author has actively allocated to low-valuation, high-growth names.
- Risk Warning: Current valuations of compounders approach Nifty Fifty bubble levels. Although the macro environment differs (no 1973–74 oil crisis or severe recession), crowded trades alone can trigger significant corrections. Investors should be wary of chasing highs.
Theme and Background
This chapter uses the "Nifty Fifty" bubble of the 1970s as a historical reference to analyze the current valuation environment, particularly for tech giants. The report notes that the market frenzy over the "Magnificent 7" bears similarities to the past追捧 of 50 blue-chip stocks, but a key difference lies in the stronger fundamentals of current companies (e.g., profitability, capital expenditure).
Core Thesis
The author's core judgment is that the current market is not a simple replay of the 1972 "Nifty Fifty" bubble. Despite elevated valuations, the earnings growth, cash flow, and return on capital of the "Magnificent 7" are far superior to those of the "Nifty Fifty" of that era, thus lowering the risk of a bubble burst. The counterintuitive point is that the widely feared "concentration risk" (a few stocks dominating the index) may be overestimated, as high valuations are backed by stronger earnings.
Key Arguments and Data
1. Historical Comparison: In 1972, the average P/E ratio of the "Nifty Fifty" was 41.9x, while the current average P/E of the "Magnificent 7" is 35.5x (as of the report date). However, the median earnings growth of the "Nifty Fifty" was only 10.5%, compared to 18.2% for the "Magnificent 7".
2. Fundamental Differences:
- In 1972, the average CapEx as a percentage of revenue for the "Nifty Fifty" was 8.2%, versus 14.5% for the "Magnificent 7", indicating stronger reinvestment capacity.
- The average ROE for the "Nifty Fifty" in 1972 was 18.3%, compared to 28.7% for the "Magnificent 7".
3. Market Environment: The current interest rate environment (federal funds rate at 5.25%-5.50%) is significantly higher than in 1972 (approximately 4.5%), but the "Magnificent 7" have lower debt levels (average debt/EBITDA of 1.2x vs. 2.8x for the 1972 "Nifty Fifty").
Comparative Data Table:
| Indicator | 1972 "Nifty Fifty" | Current "Magnificent 7" |
|---|---|---|
| Average P/E Ratio | 41.9x | 35.5x |
| Median Earnings Growth | 10.5% | 18.2% |
| CapEx/Revenue | 8.2% | 14.5% |
| Return on Equity (ROE) | 18.3% | 28.7% |
| Debt/EBITDA | 2.8x | 1.2x |
Companies/Assets Involved
- "Magnificent 7": Apple (AAPL), Alphabet (GOOGL), Microsoft (MSFT), Amazon.com (AMZN), Meta Platforms (META), Tesla (TSLA), Nvidia (NVDA). The report holds a neutral-to-bullish stance on these companies, arguing that while valuations are high, earnings quality supports their stock prices.
- "Nifty Fifty": As a historical reference group, the report notes that the bubble burst (a decline of approximately 50% in 1973-1974) was primarily driven by a slowdown in earnings growth (from 10.5% to 5.2%) and a surge in interest rates (the federal funds rate rising from 4.5% to 12%), rather than purely excessive valuations.
Investment Implications
- Avoid Simple Analogies: Investors should not blindly reduce holdings in tech giants due to "concentration risk" and must distinguish between valuation bubbles and earnings-driven growth.
- Focus on Earnings Sustainability: If the earnings growth of the "Magnificent 7" decelerates from the current 18% to single digits (as in the 1970s), risks will rise; otherwise, current valuations can be absorbed.
- Interest Rate Sensitivity: If the Federal Reserve continues to raise rates (as in the 1970s), high-valuation stocks will face pressure; however, the current low leverage of the "Magnificent 7" mitigates the impact of rate hikes.