2Q23 Opportunity Equity Portfolio Activity and Attribution
Patient Capital Management is a Baltimore asset manager founded in 2020 by Samantha McLemore, CFA — Bill Miller's long-time co-manager (working together since 2002, running the flagship Opportunity Equity strategy since 2014). Continuing the Miller-school contrarian tradition, it practices "time arbitrage": exploiting behavioral mispricing to concentrate in controversial growth names (tech, healthcare, Bitcoin-related) at deep discounts to intrinsic value. Its site preserves Bill Miller's complete 1995-2022 market letters, alongside ongoing quarterly letters and webinars.
In plain words
This report explains how Patient Capital's fund beat the market in 2023's second quarter. They bought travel stocks like Norwegian Cruise and Delta when everyone was panicking in 2022, and those bets paid off. They also found hidden value in companies like IAC: its market value equals just its cash and public stocks, meaning its private businesses are basically free. For ordinary investors, the takeaway is to stay calm during downturns and look for assets the market overlooks. It's worth a read for concrete examples of contrarian investing.
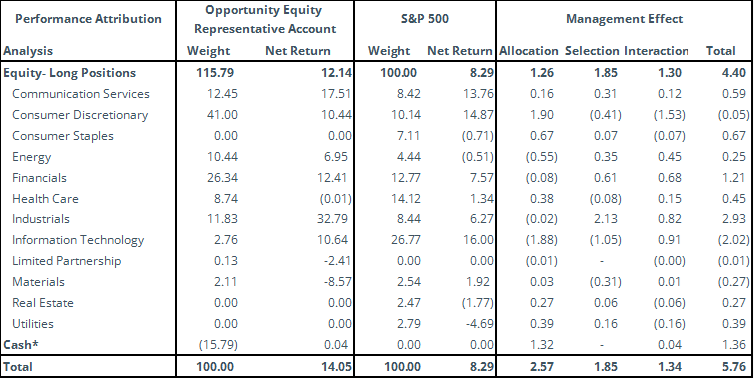
Patient Capital's Opportunity Equity strategy delivered a net return of 13.31% in the second quarter of 2023, outperforming the S&P 500 Index (8.74%). According to a three-factor attribution model, allocation, stock selection, and interaction effects collectively contributed to the excess returns. T
Theme and Background
This chapter reviews the performance and portfolio adjustments of Patient Capital's Opportunity Equity strategy in the second quarter of 2023. In terms of market environment, the trends in the second quarter were similar to those in the first quarter, with the information technology, consumer discretionary, and telecommunications sectors leading the gains. However, the market broadened towards the end of the quarter, which helped the fund's cyclical holdings.
Core Thesis
The author's core investment thesis is: Patience and investment flexibility are key advantages for outperforming the market. The fund builds diversified positions in mispriced securities by exploiting market volatility and dislocations, patiently waiting for the market to reflect fundamentals. Counterintuitive judgments include making a significant bet on travel stocks in 2022 when the market was extremely pessimistic, and the view that energy stocks, which were major contributors last year, have become major detractors this year, but long-term opportunities remain.
Key Arguments and Data
- Performance: The Opportunity Equity strategy delivered a net return of 13.31% in the second quarter, outperforming the S&P 500 index (8.74%). The fund lagged in April but rebounded in May, with June returns more than double the market.
- Attribution Analysis: Using a three-factor attribution model (allocation, selection, and interaction effects), all factors contributed to the excess returns.
- Portfolio Concentration: At the end of the period, the fund held 40 positions, with the top ten holdings accounting for 48.0% of assets, significantly higher than the index's 30.5%, and an active share of approximately 105.8%.
- Travel Stock Case Study: In 2022, the fund made a significant bet on Expedia, Delta, Norwegian Cruise Lines, and United Airlines, when demand was strong but valuations were at historical lows. This decision paid off in the second quarter, with all four stocks ranking among the top ten contributors for the quarter and among the top fifteen contributors year-to-date.
- Energy Stock Reversal: Energy stocks shifted from being major contributors last year to major detractors this year, due to unexpected Russian supply and weak demand growth. However, the author believes long-term opportunities remain attractive, given years of underinvestment in supply. Energy Transfer has a dividend yield of 9.5%, and Chesapeake Energy is fully exposed to natural gas, benefiting from growing European LNG demand.
- New Position Valuations:
- IAC Inc.: With a market cap of only $5.8 billion, its publicly traded equity holdings (Angi Inc. and MGM Resorts) plus cash already account for 102% of the current market cap, meaning its private holdings (including Meredith, Vivian Health, Care.com, and Turo) are not valued. The four most recent investments alone are worth $4.1 billion.
- Western Alliance Bancorp: The stock fell 77% from peak to trough, despite having better balance sheet growth, liquidity conditions, and insured deposit levels than peers. After rebounding 103% from the low, it still trades below book value, compared to a historical average price-to-book ratio of 2.3 times since its IPO in 2005. The company expects its Q2 2023 CET1 ratio to exceed 10%, insured deposits have reached 80%, and the dividend yield is 3.8%.
Companies/Assets Involved
| Company | Role | Key Data | Bullish/Bearish |
|---|---|---|---|
| Norwegian Cruise Line Holdings (NCLH) | One of the largest positive contributors | 2022 valuation at historical lows, strong demand | Bullish |
| Delta Air Lines (DAL) | One of the largest positive contributors | Same as above | Bullish |
| Meta Platforms Inc. (META) | One of the largest positive contributors | Top five contributor year-to-date | Bullish |
| Amazon.com Inc. (AMZN) | One of the largest positive contributors | Top five contributor year-to-date | Bullish |
| Uber Technologies Inc. (UBER) | One of the largest positive contributors | No specific data provided | Bullish |
| Alibaba Group Holdings (BABA) | Largest detractor | No specific data provided | Bearish (detractor) |
| Peloton Interactive (PTON) | Largest detractor | No specific data provided | Bearish (detractor) |
| S4 Capital (SFOR LN) | Largest detractor | No specific data provided | Bearish (detractor) |
| Teva Pharmaceutical (TEVA) | Largest detractor | No specific data provided | Bearish (detractor) |
| Canada Goose Holdings (GOOS) | Largest detractor | No specific data provided | Bearish (detractor) |
| IAC Inc. (IAC) | Largest new position | Market cap $5.8B, public holdings + cash = 102% of market cap, private assets not valued | Bullish |
| Western Alliance Bancorp (WAL) | New position | Fell 77% peak-to-trough, up 103% from low but still below book value, historical avg P/B 2.3x, dividend yield 3.8% | Bullish |
| Brilliant Earth (BRLT) | Added on market dislocation | No specific data provided | Bullish |
| Energy Transfer (ET) | Energy holding | Dividend yield 9.5%, benefits from pipeline construction | Bullish |
| Chesapeake Energy Corp (CHK) | Energy holding | 100% natural gas exposure, benefits from European LNG demand | Bullish |
Investment Implications
- Focus on valuation recovery opportunities in travel and tech stocks: The fund made a contrarian bet on travel stocks in 2022 when the market was extremely pessimistic, and it paid off in 2023. Investors can look for similar cyclical stocks that are oversold due to short-term sentiment but have strong fundamentals.
- Long-term opportunities in energy stocks are worth positioning for: Despite short-term price pressure from supply-demand balance, years of underinvestment in supply and geopolitical risks make the market balance fragile. High-dividend-yield energy companies (e.g., Energy Transfer's 9.5% dividend yield) offer a "patient waiting" return.
- Uncover "hidden value" in holding companies: The IAC case shows that the market may undervalue the private assets held by holding companies. Investors can look for similar structures where the public market cap is below the value of held assets (including cash and public equity).
- Opportunities in mispriced regional banks: Western Alliance was heavily sold off due to industry panic, but its fundamentals are stronger than peers. Investors can focus on regional banks with healthy balance sheets that are mispriced due to systemic risk, especially those trading below book value and still paying dividends.
Theme and Background
This chapter provides a detailed analysis of the five top contributors and five top detractors in the Patient Capital Opportunity Equity strategy for the second quarter of 2023, elaborating on each company's specific performance, driving factors, and investment logic. The report focuses on travel recovery, technology efficiency improvements, and value release opportunities arising from corporate restructurings.
Core Thesis
The author's core investment argument is that the market misinterprets the business models and long-term potential of certain high-quality companies, thereby creating contrarian investment opportunities. Specific manifestations include:
- Contrarian Judgment 1: Delta Air Lines is not a traditional cyclical airline but an undervalued global consumer brand and e-commerce giant.
- Contrarian Judgment 2: Concerns over Peloton's total addressable market (TAM) are excessive, and its risk-reward profile as a brand leader is highly attractive.
- Contrarian Judgment 3: Alibaba's split and restructuring will gradually unlock value; its current valuation (11x P/E) resembles undervalued U.S. companies at the end of 2022, suggesting rebound potential.
Key Arguments and Data
Top Contributors
| Company | Ticker | Net Contribution (bps) | Quarterly Return | Key Drivers |
|---|---|---|---|---|
| Norwegian Cruise Line Holdings | NCLH | 210 | 61.9% | New CEO focuses on data-driven operations, cost reduction, and efficiency improvements; 85% booking visibility for 2023 and 25% for 2024; strong onboard spending, cancellation rates at historical levels; expected to generate positive free cash flow in 2024; 2023-2027 EPS CAGR of 40%. |
| Delta Air Lines Inc. | DAL | 158 | 39% | Market misinterprets its business model; positioned as a global consumer brand and the fifth-largest e-commerce retailer in the U.S.; prioritizes premium customers, targeting premium revenue share to rise from 35% to 37%; loyalty program with American Express contributes $6.5 billion in revenue this year, with a target of $10 billion by 2028; cumulative free cash flow of approximately $11 billion expected from 2023 to 2025 (one-third of current market cap). |
| Meta Platform Inc. | META | 158 | 35% | Improved advertising spending, increased user engagement, and long-term opportunities from generative AI; AI/ML investments yielding results: daily revenue from Advantage Plus shopping ads grew 7x in six months, 20% of content recommended by AI, driving Instagram usage time up >24%; 2023 operating expense guidance lowered by $2 billion to $86-90 billion; completed $9 billion in share repurchases during the quarter (2% of shares), with $42 billion remaining (8% of float). |
Top Detractors
| Company | Ticker | Net Contribution (bps) | Quarterly Decline | Key Detractors |
|---|---|---|---|---|
| Alibaba Group Holdings Ltd | BABA | -80 | 18% | China's economic reopening weaker than expected; however, the company announced a split into six subsidiaries, planning to spin off AliCloud via dividend, IPO Cainiao and Freshippo, and raise funds for International Digital Group within 6-18 months; current P/E of only 11x, with the author believing the discount will narrow as the restructuring progresses. |
| Peloton Interactive Inc. | PTON | -60 | 32% | Pandemic tailwinds fading, ongoing TAM concerns; but the company has only 3.2 million connected fitness subscribers, representing 3.5% of total gym memberships in its operating countries (U.S., U.K., Germany, Australia); new management (former Netflix executive) is aggressively cutting costs, expanding sales channels (Amazon, Dick's Sporting Goods), and introducing a tiered membership structure; monthly churn rate slightly above 1%, comparable to the wireless industry. |
| S4 Capital PLC | SFOR LN | -46 | 23% | Extended sales cycles in the advertising industry; however, full-year organic growth is still expected in the 8-12% range; the company holds only 0.8% of the $110 billion agency services TAM; 100% exposure to the long-term digital advertising trend; management views AI as the third disruptive wave, having invested in AI since 2017 and integrated it into workflows; current P/E of 10x, on par with traditional advertising agencies growing only 4%. |
Companies/Assets Involved
- Norwegian Cruise Line Holdings (NCLH): Bullish. Benefiting from sustained travel demand recovery, cost control, and deleveraging, with expected high EPS growth.
- Delta Air Lines Inc. (DAL): Bullish. An undervalued consumer brand; premiumization strategy and loyalty program provide stable revenue, with strong free cash flow.
- Meta Platform Inc. (META): Bullish but partially reduced. AI investments yielding significant returns, strengthened cost discipline, and reasonable valuation (26x P/E).
- Alibaba Group Holdings (BABA): Bullish. Split and restructuring serve as catalysts for value release; current valuation is extremely low (11x P/E), similar to undervalued U.S. companies at the end of 2022.
- Peloton Interactive (PTON): Bullish. TAM concerns are excessive; high brand loyalty; new management driving a turnaround; attractive risk-reward profile.
- S4 Capital PLC (SFOR LN): Bullish. Beneficiary of the long-term digital advertising trend; leading AI deployment; valuation does not match growth (10x P/E vs. double-digit growth).
- ADT Inc (ADT) and Teva Pharmaceuticals (TEVA): Sold as sources of capital during the quarter, realizing partial losses.
Investment Implications
- Overweight Travel and Consumption Recovery: The report argues that services consumption as a share of personal consumption expenditures (PCE) (66.5%) remains below the 2019 level (69%), suggesting the travel demand rebound will persist. Investors can focus on companies like NCLH and DAL, which benefit from premiumization, deleveraging, and free cash flow improvement.
- Focus on Tech Giant Efficiency Gains and AI Monetization: Meta's case shows that AI investments are already translating into revenue growth and cost savings. Investors should monitor the actual monetization capabilities of large tech companies in AI/ML, rather than just the concept.
- Contrarian Positioning in Undervalued Restructuring Targets: Alibaba's split strategy mirrors the value release path of previous U.S. companies, with its current low valuation (11x P/E) providing a margin of safety. Peloton and S4 Capital represent contrarian opportunities where market pessimism is excessive but fundamentals show signs of improvement.
- Beware of Misinterpretations in Cyclical Industries: Delta's case highlights that business model transformations (e.g., premiumization, loyalty programs) in traditional industries (e.g., airlines) can alter their cyclical nature, and lagging market perception may generate excess returns.
Theme and Background
This section provides definitions for a series of key financial terms used in the report (CET1, PCE, TAM, OPEX). These terms form the foundation for understanding subsequent investment analysis and corporate financial performance. Additionally, the section contains extensive legal compliance statements and performance disclosure information, emphasizing that the report's content does not constitute investment advice and explaining the performance calculation methodology (deducting a 1% management fee) and the representativeness of portfolio data.
Core Viewpoint
This section contains no core investment thesis. Its content is purely term definitions and compliance disclosures, without any investment judgments or market views.
Key Arguments and Data
This section contains no investment arguments. It only provides definitions for the following terms:
- Common Equity Tier 1 (CET1): The component of a financial institution's Tier 1 capital primarily composed of common equity.
- Personal Consumption Expenditures (PCE): A measure of spending by U.S. households on goods and services.
- Total Addressable Market (TAM): The total revenue opportunity available for a product or service if 100% market share is achieved.
- Operating Expenses (OPEX): Costs incurred by a business through its normal operations, including rent, equipment, inventory costs, marketing, wages, insurance, step costs, and R&D allocations.
Companies/Assets Involved
This section does not mention any specific companies or assets.
Investment Implications
This section offers no direct implications for investors. Its core purpose is to clarify the analytical framework and term definitions used in the report and to reiterate legal disclaimers. Investors should disregard the compliance boilerplate text in this section and only need to understand the meanings of the four terms—CET1, PCE, TAM, and OPEX—as they appear in subsequent analysis.