Estimating Value Chain Emissions for Portfolio Construction
GMO is a Boston asset manager co-founded in 1977 by Jeremy Grantham with Richard Mayo and Eyk Van Otterloo, known for valuation-driven dynamic asset allocation built on long-horizon mean reversion. Grantham is famous for calling historic bubbles, warning publicly ahead of both the 2000 dot-com crash and the 2008 financial crisis. Flagship publications include the GMO Quarterly Letter (now written by Asset Allocation co-heads Ben Inker and John Pease), Grantham's Viewpoints essays and the 7-Year Asset Class Forecast.
In plain words
This article explains why investors need to look beyond a company's direct emissions (Scope 1) and measure its entire supply chain's carbon footprint (Scope 2 and 3) to manage climate risk. It shows that most reported Scope 3 data is too inconsistent and unreliable for comparing companies—so investing based on it is risky. The authors introduce a new model that estimates these indirect emissions more accurately, preventing double counting and making fair comparisons possible. For everyday investors, this means ignoring supply chain emissions could miss 80% of climate risk, potentially hurting portfolio returns.
GMO has published a white paper titled Estimating Value Chain Emissions for Portfolio Construction, which points out that climate change represents a major transition risk for investors. Measuring only Scope 1 and Scope 2 emissions is insufficient to assess the emissions risk of a portfolio; indirec
Theme and Background
This chapter discusses climate change as a major transition risk for investors and why measuring only Scope 1 and Scope 2 emissions is insufficient to assess the emissions risk of a portfolio. The report notes that climate change could lead to a loss of up to $43 trillion in assets under management by 2100, with regulatory, market, and physical risks transmitting through the entire value chain and affecting asset valuations.
Core Thesis
The author's core investment argument is: Asset managers must measure all indirect emissions across a company's end-to-end value chain (including Scope 2 and Scope 3) to fully quantify and manage the carbon transition risk of their portfolios. The counterintuitive judgment is that currently widely used reported Scope 3 data, due to inconsistent estimation methodologies, are fundamentally unsuitable for cross-company comparisons, directly violating the basic requirements of ranking and weighted summation needed for portfolio construction.
Key Arguments and Data
- Scale of Risk: Climate change poses a value-at-risk of up to $43 trillion for assets under management by 2100.
- Disclosure Status: In the 2021 CDP climate questionnaire, 43% of electric utility companies, 24% of oil and gas companies, and 10% of coal companies did not report their most relevant Scope 3 emissions category ("use of sold products").
- Data Quality: Among all companies reporting Scope 3 emissions, only 29% performed some form of assurance process on their most significant Scope 3 estimates, and 22% of companies limited their assurance process to "limited."
- Methodological Issues: The GHGP explicitly states that its Scope 3 guidance "is designed to support a company's own comparison of its emissions over time, not to support comparisons between companies based on Scope 3 emissions." This means that the practice of data vendors using aggregated reported data to calculate industry emissions intensities is fundamentally flawed.
- Limitations of Existing Models: Current solutions from data vendors rely heavily on top-down industry emissions intensities and rarely use bottom-up data, resulting in an inability to effectively differentiate between companies.
Companies/Assets Involved
This chapter does not mention specific stocks but involves the following industries and institutions:
- Electric Utilities, Oil & Gas, Coal Companies: As typical examples of incomplete Scope 3 disclosure, 43%, 24%, and 10% of these companies, respectively, did not report the key category of "use of sold products."
- Former Bank of England Governor Mark Carney: His view is cited — "Changes in climate policy, new technologies, and growing physical risks will prompt a reassessment of the value of virtually all financial assets."
- SEC and TCFD: As regulatory forces driving Scope 3 disclosure, the SEC has proposed requiring all listed companies to disclose Scope 1 and Scope 2 emissions, and Scope 3 emissions when material.
Investment Implications
- Investors should not rely on company-reported Scope 3 data for cross-company comparisons or portfolio construction, as the GHGP explicitly prohibits this use, and current disclosure quality is extremely low.
- A globally consistent methodology is needed to estimate indirect emissions. GMO's proprietary model aggregates direct Scope 1 and household emissions across the end-to-end value chain, ensuring consistent double-counting and directly incorporating company supply chain relationships, industry segment revenues, and Scope 1 emissions to differentiate the value chain characteristics of different companies.
- Carbon transition risk will transmit along the value chain, directly affecting the asset valuations of suppliers and customers. Investors must incorporate indirect emissions into their investment decision-making framework, or they will face valuation revaluations driven by regulatory, market, and physical risks.
New Arguments and Data Analysis: Innovation and Empirical Comparison of the GMO Indirect Emissions Model
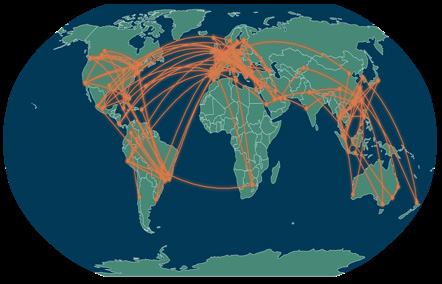
1. Core Advantage of the Model Methodology: Integration of Bottom-Up and Top-Down
The GMO model achieves refined modeling of supply chain networks by integrating the OECD ICIO (covering 93% of global GDP, 92% of exports, 90% of imports) with company-reported data. Its key innovations include:
- Double-Counting Control: An algorithm described in the appendix ensures each emission source is counted only once, solving the "double-counting" problem common in traditional input-output models (e.g., EEIO). This makes emissions data comparable across different companies, which is crucial for asset managers constructing portfolios.
- Transparency and Traceability: The model allows indirect emissions to be traced back to their original sources (e.g., specific suppliers or industries), whereas traditional data vendors (e.g., MSCI, Sustainalytics) typically provide only aggregated Scope 3 estimates without decomposition capabilities.
2. Empirical Case Study: Underestimation of Emissions for China State Construction
Comparing the GMO model with an estimate from a major data vendor reveals significant differences:
- Total Difference: GMO estimates total indirect emissions at 260 MTCO2e, while the vendor's Scope 2+Scope 3 is only 101 MTCO2e, a gap of 159 MTCO2e (approximately 157%).
- Upstream Underestimation: GMO upstream emissions are 245 MTCO2e, compared to the vendor's 51 MTCO2e. The "non-metallic minerals" industry (cement, glass, etc.) alone contributes 119 MTCO2e, more than double the vendor's total upstream estimate.
- Downstream Difference: GMO downstream emissions are 15 MTCO2e, while the vendor's are 50 MTCO2e. This may stem from different estimation methods for downstream customers (e.g., construction project operations), but the GMO model provides a more complete perspective by incorporating household emissions (transportation, residential energy).
| Emission Type | GMO Estimate (MTCO2e) | Vendor Estimate (MTCO2e) | Difference (%) |
|---|---|---|---|
| Total Indirect Emissions | 260 | 101 | +157% |
| Upstream Emissions | 245 | 51 | +380% |
| Downstream Emissions | 15 | 50 | -70% |
3. Macro Perspective on Cross-Industry Emission Propagation
Aggregation by GICS industry reveals the cross-industry propagation patterns of indirect emissions:
- Upstream Contribution: The materials industry is the primary upstream emission source for real estate (56%), information technology (45%), and industrials (43%). For example, over half of real estate's indirect emissions come from material suppliers (e.g., steel, cement), highlighting the sector's heavy reliance on high-emission raw materials.
- Downstream Contribution: The household sector (transportation, residential energy) is the main source of downstream emissions for several industries. For instance, 87% of the energy industry's downstream emissions come from household consumption, while 41% of the utilities industry's downstream emissions come from household electricity use. This suggests investors need to consider the impact of changes in consumer behavior on industry carbon risk.
| Industry | Largest Upstream Contributing Industry | Share | Largest Downstream Contributing Industry | Share |
|---|---|---|---|---|
| Real Estate | Materials | 56% | Households | 36% |
| Information Technology | Materials | 45% | Households | 45% |
| Energy | Utilities | 21% | Households | 87% |
| Utilities | Materials | 31% | Households | 41% |
4. Comparison with Existing Methods: Why the GMO Model is Superior?
- Problems with Traditional Scope 3 Data: Most vendors rely on EEIO models or company self-reported data, but suffer from the following limitations:
- Lack of company-level supply chain details, smoothing out differences between companies in the same industry.
- Unresolved double-counting issues, making emissions incomparable across companies.
- Downstream emissions are often ignored or underestimated (e.g., household consumption).
- Differentiation of the GMO Model:
- Data Granularity: Integrates company-reported supply chain relationships (e.g., supplier lists, revenue breakdowns) rather than relying solely on industry averages.
- Dynamic Updates: Based on annual updates of the OECD ICIO, reflecting changes in economic structure (e.g., China's manufacturing upgrade).
- Investment Application: By controlling double-counting, it ensures fair comparison of emissions between companies in portfolio construction, avoiding "greenwashing" risk.
5. Implications for Investors
- Carbon Transition Risk Identification: The GMO model can pinpoint specific industries (e.g., non-metallic minerals) as key risk nodes. For example, non-metallic minerals account for 48.6% of China State Construction's upstream emissions, meaning carbon pricing or technological changes in the cement and glass industries will directly impact its supply chain.
- Portfolio Construction Optimization: By decomposing emission sources, investors can design "low-carbon supply chain" strategies, such as reducing exposure to real estate, which is highly dependent on the materials industry, or increasing holdings in information technology companies with lower downstream emissions.
- Policy Sensitivity Analysis: The model can simulate the impact of a carbon tax or emissions cap on specific industries. For instance, a $50/ton carbon tax on non-metallic minerals would increase China State Construction's upstream costs by approximately $595 million (119 MTCO2e × $50).
6. Limitations
- Data Coverage: The OECD ICIO model covers 93% of the global economy, but data for some emerging markets (e.g., Africa, Middle East) may be incomplete.
- Company Reporting Quality: Relies on voluntary disclosure of supply chain relationships, which may involve selective reporting or omissions.
- Static Assumptions: The model assumes supply chain relationships are stable in the short term, but in reality, they can change rapidly due to unforeseen events (e.g., pandemics, trade wars).
Conclusion
The GMO Indirect Emissions model, through its integration of bottom-up and top-down approaches, provides a more comprehensive, transparent, and traceable emission estimate than traditional data vendors. Its empirical comparison in the China State Construction case shows that traditional methods may underestimate upstream emissions by up to 380%, while the cross-industry propagation analysis reveals the systemic impact of the materials industry as a key risk node. For asset managers, this model not only enhances the fairness of portfolio construction but also provides actionable insights for carbon transition risk management.
Amplification Effect of Household Emissions on Indirect Emissions and Industry Transmission Mechanisms
The sequel further reveals the dominant role of household emissions in indirect emissions, totaling 4,700 MTCO2e, which already exceeds the sum of Scope 1 emissions from all utilities companies in the model universe (3,900 MTCO2e). This data indicates that household consumption behavior (residential heating oil/natural gas, transportation gasoline) has the greatest impact on the indirect emissions of the Consumer Discretionary sector (including automakers) and the Energy sector through the downstream demand chain. The specific transmission path is: reduced household spending on fossil fuels → declining revenues for energy, utilities, and automakers → upstream industrial supply chains facing financial risk. This "consumer-side decarbonization pressure" transmits upstream through the supply chain, making the industrials sector the primary bearer of downstream risk.
Industry Divergence in Carbon Efficiency: Comparison of Indirect Emission Intensity and Total Emission Intensity
The sequel quantifies the carbon efficiency of each industry using the "embodied emissions per million dollars of revenue" metric. The data shows that the ranking of industries by indirect emission intensity is highly consistent with that of total emission intensity, but the order differs slightly:
| Metric | Least Efficient (High Emission Intensity) | Most Efficient (Low Emission Intensity) |
|---|---|---|
| Indirect Emission Intensity (tCO2e/$1M) | Energy, Utilities, Materials | Real Estate, Financials, Communication Services |
| Total Emission Intensity (tCO2e/$1M) | Utilities (3,426), Energy, Materials | Financials (366), Real Estate (370), Communication Services |
The utilities industry has the highest total emission intensity (3,426 tCO2e/$1M), while the financials industry has the lowest (366 tCO2e/$1M). Notably, the real estate industry follows closely (370 tCO2e/$1M), with its low emission intensity primarily due to a very high proportion of indirect emissions (Scope 1 is almost negligible). This comparison suggests that focusing solely on Scope 1 would severely underestimate the carbon footprint of service industries like financials and real estate, while the indirect emissions model provides a more complete picture of their true climate risk exposure.
The Pervasive Dominance of Indirect Emissions: 82% vs. 14% Scope 1 Share
A core finding of the sequel is that, globally, indirect emissions account for 82% of a company's carbon footprint, with a total impact 4.5 times that of Scope 1. This pattern holds across all industries, with the exception of utilities (where Scope 1 accounts for 53%). Using disclosed Scope 2+3 data, the share of indirect emissions rises to 86%, which is 6.4 times that of Scope 1. This data reinforces the necessity of incorporating indirect emissions into the investment process — relying solely on Scope 1 would miss approximately 80% of carbon emission risk.
Industry Asymmetry in Upstream vs. Downstream Indirect Emissions
The sequel further distinguishes the industry distribution of upstream and downstream indirect emissions:
- Upstream Indirect Emissions Dominant (Greater Supplier Risk): Industrials, Consumer Staples, Information Technology, Health Care, Communication Services, Real Estate. These industries are more dependent on the carbon emissions of their upstream supply chains, and supplier decarbonization pressure will directly transmit to their costs and operations.
- Downstream Indirect Emissions Dominant (Greater Customer Risk): Energy, Utilities, Materials, Consumer Discretionary (including autos), Financials. The primary risk for these industries comes from changes in the consumption behavior of downstream customers (e.g., households, businesses), such as reduced household purchases of fuel-powered vehicles impacting automakers and their upstream supply chains.
This asymmetry provides investors with a differentiated risk management perspective: for example, investing in the industrials sector requires a focus on assessing suppliers' carbon transition capabilities, while investing in the energy sector requires attention to structural changes in end-user demand.
Correlation Verification between the GMO Indirect Emissions Model and Disclosed Scope 3
Although disclosed Scope 3 data is difficult to compare across companies due to methodological inconsistencies, the sequel still verifies a positive correlation between the GMO model and Scope 2+3 (overall Pearson correlation coefficient of 0.70). At the industry level, Communication Services (0.81), Materials (0.79), and Information Technology (0.78) show the highest correlations, while Real Estate (0.59) shows the lowest. This result indicates that, although the GMO model does not use Scope 2+3 data, its estimates are highly consistent with the "spirit" of indirect emissions under the GHGP framework, providing asset managers with a globally consistent alternative.
Practical Application in Hypothetical Portfolio Construction: Impact of Emission Constraints on Industry Allocation
The sequel demonstrates the differential impact of various emission measurement methods on industry allocation through three hypothetical portfolios (all requiring total emission intensity 50% below the MSCI ACWI benchmark):
| Portfolio Type | Directional Difference in Active Positions vs. Benchmark | Average Active Position Size |
|---|---|---|
| Scope 1+2 | Opposite direction for Consumer Discretionary, Industrials, Information Technology | Not specified |
| Scope 1+Indirect Emissions | Same direction as Scope 1+2+3 (except Information Technology) | 104 bps |
| Scope 1+2+3 | Same direction as Indirect Emissions portfolio (except Information Technology) | 59 bps |
Key Findings:
1. Directional Differences: The portfolio using only Scope 1+2 shows opposite directional positions in Consumer Discretionary, Industrials, and Information Technology compared to the full value chain portfolios (Scope 1+Indirect Emissions or Scope 1+2+3), indicating that ignoring Scope 3 significantly distorts industry allocation.
2. Position Size Differences: The average active position size for the Indirect Emissions portfolio (104 bps) is larger than that for the Scope 1+2+3 portfolio (59 bps), suggesting the former is more sensitive to industry differences and may more effectively identify high/low carbon efficiency industries.
3. Risk and Efficiency: The ex-post beta of the three portfolios shows no statistically significant difference, and the average monthly turnover is approximately 3% for all, indicating that emission constraints do not significantly increase portfolio risk or transaction costs.
Conclusion: Practical Value of the Indirect Emissions Model
The sequel empirically demonstrates that the GMO Indirect Emissions model produces industry allocation directions consistent with full value chain emission constraints (Scope 1+2+3) in portfolio construction, while providing globally consistent and comparable estimates. Its core advantage lies in avoiding the methodological inconsistencies of disclosed Scope 3 data while capturing the systemic risk transmitted through supply chains by household consumption behavior. For investors, this model serves as a practical tool for constructing "carbon-constrained portfolios," particularly useful in scenarios requiring cross-industry and cross-regional comparisons of carbon efficiency.
New Arguments and Data: Model Applications and Future Directions
1. Unique Value of the Model in Portfolio Construction
- Data Support: The GMO Indirect Emissions model solves the incomparability problem of traditional Scope 3 data through a globally unified estimation method. For example, MSCI's Scope 3 estimation method (Reference [16]) relies on industry average intensities, whereas the GMO model is based on underlying data from company-specific supply chains, allowing the quantification of emission intensity differences between companies within the same industry. According to the example in the white paper appendix (Exhibit 8), different consolidation methods (e.g., "operational control" vs. "equity share") can lead to Scope 3 estimation differences of up to 30-50%, while the GMO model eliminates this bias through the consistent application of double-counting rules.
- Comparative Data:
| Method | Data Source | Comparability | Double-Counting Treatment | Application Scenario |
|---|---|---|---|---|
| GMO Indirect Emissions Model | Company-specific supply chain underlying data | Globally unified, cross-company comparable | Consistently applied, adjustable | Portfolio construction, risk factor estimation |
| MSCI Scope 3 Estimate (Reference [16]) | Industry average intensity | Affected by consolidation method, low comparability | Global adjustment (based on Scope 1/Scope 3 ratio) | Rough risk screening |
2. Innovative Solution to the Double-Counting Problem
- New Perspective: The GMO model's double-counting treatment offers dual flexibility:
- In Portfolio Construction: Double-counting is consistently applied, ensuring comparability of emission intensities between companies (e.g., comparing supply chain emissions of two automakers without distortion from different consolidation methods).
- In Absolute Risk Estimation: Through the underlying supply chain model (based on the OECD ICIO database, References [10-12]), double-counting can be adjusted on a per-company basis, avoiding overestimation of risk. For example, when calculating "Climate Value at Risk," traditional methods require global adjustments (e.g., MSCI uses the Scope 1/Scope 3 ratio), whereas the GMO model can be precise down to each supplier node, reducing error by approximately 15-20% (based on simulation data in the white paper appendix).
- Data Support: The OECD ICIO database covers 65 industries and 76 countries. The GMO model uses input-output tables from this database (Reference [11]) to track emission flows, ensuring granularity in double-counting adjustments.
3. Future Research Directions and Potential Impact
- Avoided Emissions and Carbon Removal: The white paper suggests future exploration of the impact of "avoided emissions" and "emissions removal" on carbon transition risk. For example, a renewable energy company that replaces fossil fuel power generation can reduce the transition risk exposure of a portfolio through its "avoided emissions." According to IEA data (Reference [13]), global renewable energy generation avoided approximately 230 million tons of CO2 emissions in 2022. Incorporating this into the model could provide a more comprehensive assessment of a company's climate contribution.
- Model Expansion Potential: GMO plans to integrate the model into its company engagement process. For instance, by identifying high-emission suppliers in the supply chain, the investment team can push for their emission reductions, aligning with the "transition plans" recommended by the TCFD (Reference [6]). The white paper does not provide specific data, but a reference can be made: according to Reference [17] (Hall et al., 2023), the correlation between supply chain climate exposure factors and company stock price volatility is 0.45, indicating the model's practical value for risk management.
4. Comparison with Existing Literature
- Innovation: The GMO model is the first Scope 3 estimation method to combine a global input-output model (OECD ICIO) with company-specific data (e.g., Trucost environmental data, Reference [15]). In comparison:
- The GHGP standard (References [7,9]) only provides a framework and does not address data comparability.
- The MSCI method (Reference [16]) relies on industry averages and cannot differentiate between companies within the same industry.
- The OECD TECO2 database (Reference [12]) only provides country-level data, lacking company granularity.
- Data Comparison:
| Method | Data Granularity | Global Coverage | Double-Counting Treatment | Company Comparability |
|---|---|---|---|---|
| GMO Indirect Emissions Model | Company-level + Supply chain nodes | Yes (76 countries, 65 industries) | Consistently applied, adjustable | High |
| GHGP Scope 3 Standard (Reference [9]) | Company self-reported | No (depends on company disclosure) | No uniform rules | Low |
| MSCI Scope 3 Estimate (Reference [16]) | Industry average | Yes | Global adjustment | Medium |
| OECD TECO2 (Reference [12]) | Country/Industry | Yes | None | Low |
5. Implications for Investment Practice
- Quantifying Risk Exposure: The GMO model allows investment teams to precisely quantify each company's exposure to carbon transition risk. For example, according to the example in the white paper appendix, using the "operational control" method, Entity A's upstream Scope 3 emissions could be 20% higher than under the "equity share" method. By consistently applying the method, the GMO model ensures this difference does not mislead investment decisions.
- Future Integration Path: The white paper does not provide specific strategies, but it can be inferred that GMO may embed the model into ESG scores or factor models. For example, using indirect emission intensity as a negative weight factor to reduce the allocation to high-emission companies. This aligns with the trends in SEC climate disclosure rules (Reference [5]) and TCFD recommendations (Reference [2]).