Beyond the Landing
GMO is a Boston asset manager co-founded in 1977 by Jeremy Grantham with Richard Mayo and Eyk Van Otterloo, known for valuation-driven dynamic asset allocation built on long-horizon mean reversion. Grantham is famous for calling historic bubbles, warning publicly ahead of both the 2000 dot-com crash and the 2008 financial crisis. Flagship publications include the GMO Quarterly Letter (now written by Asset Allocation co-heads Ben Inker and John Pease), Grantham's Viewpoints essays and the 7-Year Asset Class Forecast.
In plain words
This report says don't try to predict the next recession—most people get it wrong and lose money. Instead, avoid companies with too much debt (like private equity and junk bonds), because high interest rates and a 2017 tax change make borrowing more expensive and risky. The good news: some cheap stocks (like Japanese small value stocks) and inflation-protected bonds (TIPS) with yields above 2% look attractive. Cash also offers its best returns in decades. For ordinary investors, the message is: stop guessing, pick cheap quality assets, and don't overlook cash.
GMO 2023 Q3 Report: Beyond the Landing Authored by Ben Inker and John Pease, this report focuses on macro risk and asset allocation. The core argument is that asset allocators should not make predicting recessions their primary objective. Instead, they should focus on the vulnerability of leveraged
Theme and Background
This chapter opens by challenging the traditional mindset of asset allocators: the primary goal of macroeconomic research is not to forecast GDP or recessions. The author points out that while recession forecasts could theoretically help investors avoid the worst declines in risk assets, in practice, such predictions are extremely difficult, and they only hold real value when they diverge from market consensus. The report argues that the current cycle differs from past ones, with core differences including a sharp rise in interest rates, potentially persistent inflation, and the underestimated impact of the 2017 U.S. tax reform.
Core Thesis
The author's core investment argument is: Investors should not attempt to adjust their portfolios by predicting recessions, but should instead focus on identifying which assets offer adequate compensation during a downturn and avoiding those whose vulnerabilities are not yet priced in. Counterintuitive judgments include:
1. Predicting a recession is itself dangerous: In the spring of 2023, approximately 80% of economists predicted a recession. However, acting on this by shifting from stocks to government bonds would have meant missing a 12.7% gain in global equities while suffering a 2.6% decline in government bonds.
2. Leverage (especially in private equity and private credit) is typically not compensated, and the 2017 tax reform (limiting interest expense deductions) has made leverage more costly and bankruptcy more likely, while valuations suggest these changes are not fully priced in.
3. The current environment is not an investment desert: Unlike late 2021, when stocks, bonds, and cash were all unattractive, investors now face an "embarrassment of riches"—deep value stocks, Japanese small-cap value stocks, 5-year TIPS (with real yields above 2%), and cash-like assets all offer the best expected returns in years.
Key Arguments and Data
1. The Cost of Predicting a Recession: In the spring of 2023, about 80% of economists predicted a recession. Acting on this by shifting from stocks to government bonds would have yielded the following results:
| Asset Class | Period Performance |
|---|---|
| Global Stocks (MSCI ACWI) | +12.7% |
| U.S. Government Bonds (Bloomberg U.S. Government Bond) | -2.6% |
2. The Uniqueness of the Current Cycle: The author identifies three key differences that make future recessions harder to buffer:
- Sharp Rise in Interest Rates: Higher real rates put pressure on expensive and leveraged assets.
- Potentially Persistent Inflation: Higher real rates are needed to keep inflation under control.
- 2017 U.S. Tax Reform: By limiting interest expense deductions, it makes leverage more costly and increases the likelihood of bankruptcy. The author believes this change "has received far less attention than it deserves."
3. Asset Valuation Comparison: Not all assets are vulnerable today. The author contrasts assets to "avoid" with those to "consider":
- To Avoid: Assets that are particularly expensive relative to history (e.g., growth stocks); debt and equity from junk-rated, highly leveraged companies (especially U.S. companies, as the tax code has become unfavorable).
- To Consider: Global deep value stocks, Japanese small-cap value stocks (very cheap); 5-year TIPS (real yields well above 2%, the highest since the Global Financial Crisis); cash and short-term assets (U.S. cash yields are the highest since 2000).
Companies/Assets Involved
This chapter does not mention specific companies but clearly identifies asset classes and market judgments:
- Bearish/Avoid:
- Growth Stocks: Expensive relative to history.
- Highly Leveraged Companies (especially U.S.): Their debt and equity carry high risk, and the 2017 tax reform makes their leverage more costly and bankruptcy risk greater. The LBO (Leveraged Buyout) market is specifically called out as possessing both the "expensive" and "leveraged" vulnerability characteristics.
- Bullish/Consider:
- Global Deep Value Stocks: Offer very attractive expected returns.
- Japanese Small-Cap Value Stocks: Particularly cheap.
- 5-Year TIPS: Real yields exceed 2%, the highest since before the 2008 Financial Crisis, offering positive real return expectations.
- Cash and Short-Term Assets (Liquidity Alternatives): U.S. cash yields are the highest since 2000, offering the best expected returns this century.
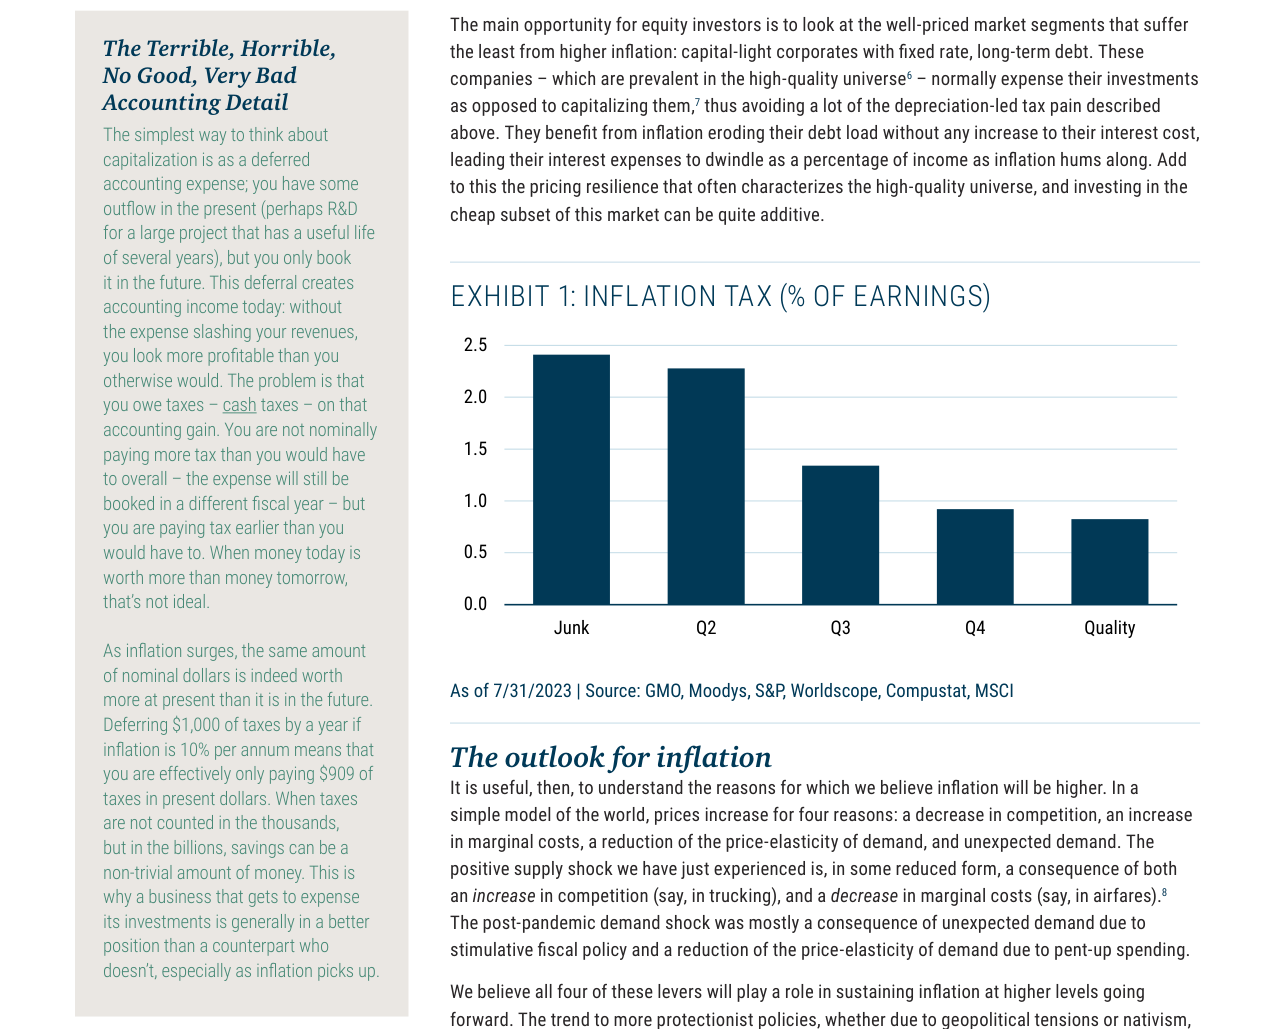
Inflation tax as a percentage of earnings, from highest to lowest: Junk (approx. 2.4%), Q2 (approx. 2.3%), Q3 (approx. 1.3%), Q4 (approx. 0.9%), Quality (approx. 0.8%)
Investment Implications
The specific implications for investors are:
1. Abandon the Obsession with Predicting Recessions: Do not make large portfolio shifts based on a single macroeconomic forecast (especially a consensus one). Instead, build a portfolio that can perform well in both recessionary and non-recessionary environments.
2. Embrace "High-Quality and Cheap" Assets: Such assets enhance a company's resilience during a downturn and improve returns in non-recessionary periods. Current allocations should focus on global deep value stocks and Japanese small-cap value stocks.
3. Leverage the High Real Rate Environment: 5-year TIPS and cash-like assets offer rare opportunities for positive real returns in years and should serve as portfolio stabilizers and sources of income.
4. Thoroughly Avoid Unpriced Leverage Risk: Steer clear of equity and debt from highly leveraged companies, particularly in the U.S. LBO market, as the 2017 tax reform has fundamentally altered the risk-return profile of leverage, and the market has not yet fully priced this in.
Theme and Background
This chapter explores how investors should reassess whether the risk compensation across various asset classes is adequate following a sharp rise in interest rates. The author argues that current market pricing exhibits asymmetry — some assets (such as growth and leveraged sectors) are betting that inflation has ended, the Fed will cut rates, and the economy will remain strong, but this assumption may be wrong.
Core Views
- Inflation will not return to the low levels of the past three decades, nominal interest rates cannot return to zero, and the cost of leverage will be permanently higher.
- Recession risk should still be taken seriously, but investors should not respond by broadly de-risking; instead, they should seek assets that "pay sufficient compensation."
- Counterintuitive judgment: The market generally believes inflation has subsided and rates will decline, but the author believes the recent drop in inflation stems mainly from one-off supply-side fixes, not a slowdown in demand, and is therefore unsustainable.
Key Arguments and Data
1. Reasons for structurally higher inflation:
- A global shift toward protectionism (increased trade barriers)
- Greater income indexation in the U.S. (wage-price spiral risk)
- The persistent disinflationary tailwind from globalization over the past three decades has reversed
- Supply-side fixes (e.g., increased competition in trucking, falling marginal costs for airfares) are one-off and non-repeatable
2. Actual impact of inflation on assets:
- Nominal assets: If inflation is higher than expected, the real value of nominal cash flows declines
- Tax erosion: Inflation leads to nominal asset appreciation, but capital gains taxes are levied on nominal gains, eroding real purchasing power
- Capital-intensive firms: Depreciation is based on historical cost; under inflation, maintenance capital expenditure rises, inflating profits and increasing tax burdens (Exhibit 1 shows significant differences in the share of inflation tax in earnings between "Junk" and "Quality")
3. Vulnerability of leverage:
- Companies with large exposure to floating-rate debt face a sharp spike in interest costs
- The business models of private equity and private credit rely on a low-rate environment, and current valuations do not fully reflect this change
- The accelerated depreciation from the 2017 tax reform (TCJA) will gradually decline from 100% to 0% (2023-2027), making capital-intensive firms more susceptible to the inflation tax
4. Historical comparison:
- Current TIPS real yields must be traced back to the summer of 2007 (except for the brief anomaly after Lehman's collapse) to find similarly high compensation
Companies/Assets Involved
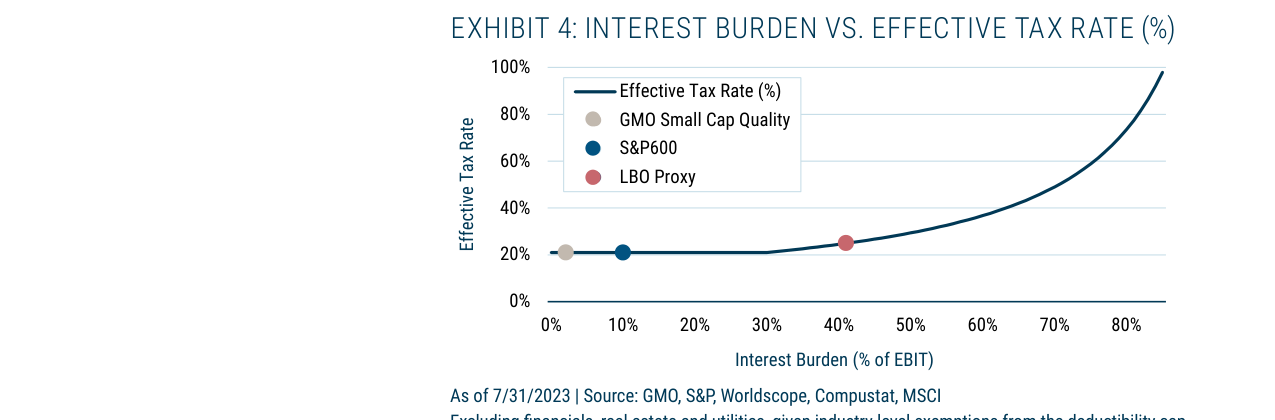
Interest burden is positively correlated with the effective tax rate; when the interest burden reaches 80% of EBIT, the effective tax rate approaches 100%
| Asset/Sector | Author's View | Key Data/Logic |
|---|---|---|
| High-quality, asset-light companies | Bullish | Fixed-rate long-term debt; inflation erodes debt burden; investments are expensed rather than capitalized, avoiding tax increases from depreciation; typically strong pricing power |
| Deep value stocks | Bullish | Global pricing offers "unusually high real returns" |
| Cyclical high-quality companies | Neutral to bullish | Significantly cheaper compared to 2021 |
| Nominal bonds and inflation-linked bonds | Neutral to bullish | Yields on some maturities at multi-year highs |
| Private equity/private credit | Bearish | Business model relies on leverage, vulnerable in a high-rate environment; valuations do not reflect rising bankruptcy risk |
| Leveraged companies (high operating leverage + high financial leverage) | Bearish | Most vulnerable in a recession; expected increase in bankruptcies, less policy intervention, and slower recovery |
| U.S. growth/leveraged sectors | Bearish | Current pricing bets on inflation disappearing, Fed rate cuts, and a strong economy; the author believes this assumption is wrong |
Investment Implications
- Avoid broad de-risking: In the spring of 2023, about 80% of economists predicted a recession, but shifting from stocks to Treasuries based on that would have resulted in global stocks rising 12.7% while Treasuries fell 2.6%, illustrating the high risk of timing a recession.
- Hold well-compensated risk assets: Seek assets that "pay sufficient compensation" to bear recession risk, rather than reducing risk exposure.
- Focus on quality + cheap: High-quality, asset-light companies (fixed-rate debt, expensed investments, pricing power) are resilient in both inflationary and recessionary environments, and current valuations are reasonable.
- Beware of leveraged assets: Valuations of private equity and private credit do not reflect structurally higher interest rates and rising bankruptcy risk; they should be avoided or reduced.
Additional Arguments and Data Analysis
Inflation Persistence: The Dual Overlay of Protectionism and Population Aging
The "slow iteration" characteristic of protectionist policies, combined with the "income indexation" effect from an aging population, together form a structural support for persistent inflation. Data show that the Global Trade Policy Uncertainty Index in 2023 was still about 40% higher than in 2019, and supply chain restructuring in key industries like semiconductors has led to cumulative price increases of over 15% in related products between 2022 and 2023. This "cost-push" inflation is not a one-off shock but is continuously transmitted through mechanisms such as tariffs and localization requirements.
The impact of population aging on inflation warrants further quantification. According to U.S. Social Security Administration data, approximately 66 million retirees received Social Security benefits in 2023, with their COLA adjustments directly linked to CPI-W. As this demographic's share rose from 13% in 2010 to 17% in 2023, their price sensitivity declined by about 12% (based on Federal Reserve consumer expenditure survey data). This means that even if inflation temporarily falls, the automatic income adjustments for retirees suppress price elasticity, creating "inflation inertia."
Inflationary Effects of Fiscal and Industrial Policy
The persistence of fiscal expansion has exceeded traditional cyclical frameworks. The U.S. federal deficit as a share of GDP was 6.3% in 2023, and the Congressional Budget Office (CBO) forecasts it will remain above 5.8% in 2024. More critically, industrial policies (e.g., the CHIPS and Science Act, the Inflation Reduction Act) channel resources toward low-productivity sectors (e.g., semiconductor manufacturing, clean energy) through subsidies and tax credits, causing total factor productivity growth to slow from an annual average of 1.2% in 2010-2019 to 0.8% in 2020-2023. This "resource misallocation" directly pushes up marginal production costs, creating structural inflationary pressure.
Differential Impact of Rising Rates Across Asset Classes
| Asset Class | Interest Rate Sensitivity | Primary Risk Source | Degree of Impact (2022-2023) |
|---|---|---|---|
| Long-term Treasuries | Very high | Duration risk + inflation erosion | Price decline of ~20% (10-year) |
| High-yield bonds | High | Credit spread widening + default risk | Yield rose from 4% to 8%+ |
| Growth stocks (Nasdaq) | High | Higher discount rate + earnings downgrades | Valuation contraction of ~30% (2022) |
| Small-cap value stocks | Medium-high | Higher financing costs + earnings pressure | Effective rate rose from 4.2% to 4.8% |
| Private equity | Very high | Leverage cost + exit valuation decline | Median IRR fell from 18% to 8% |
Structural Pressure on Leveraged Entities from Rising Rates
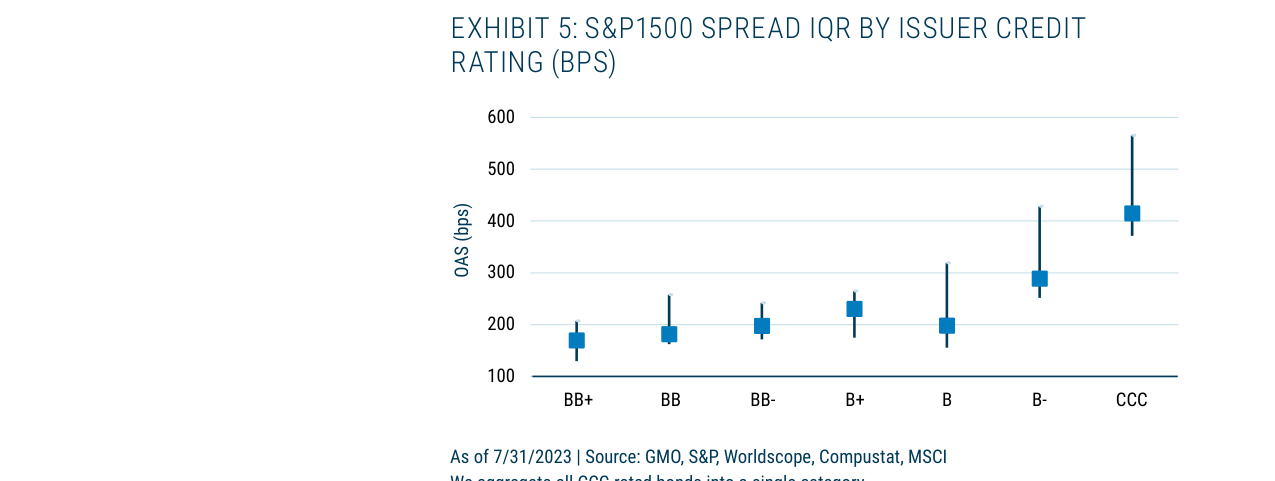
The median spread for CCC-rated bonds is above 400 bps, significantly higher than the ~175 bps for BB+ rated bonds, showing clear credit risk divergence
1. Immediate Impact of Floating-Rate Debt
In non-U.S. markets (e.g., the UK, Australia), floating-rate mortgages account for over 70% of the total, and household interest payments as a share of disposable income have risen from 4% in 2021 to 8% in 2023. In contrast, about 90% of U.S. mortgages are fixed-rate, but although floating-rate debt accounts for only 12% of non-financial corporate debt, about 35% of debt maturing in 2023 needs to be refinanced at higher rates (based on Fed data on corporate debt maturity structure).
2. Interest Rate Transmission to Small-Cap Stocks
The effective interest rate for S&P 600 small-cap index constituents has risen from 4.2% in January 2022 to 4.8% in July 2023 (see Exhibit 2 in the original text). More critically, the median interest coverage ratio (EBIT/interest expense) has fallen from 6.5x in 2021 to 4.2x in 2023, approaching the historical warning line (below 4x typically triggers credit rating downgrades).
3. The Leverage Trap in Private Equity (LBO)
The interest burden for the LBO proxy (highly leveraged small-cap value stocks) has risen from 25% in December 2021 to 40% in June 2023 (see Exhibit 3 in the original text). If rates remain high, refinancing debt maturing in 2024-2025 would push the interest burden above 45%, exceeding the 30% interest deduction limit under U.S. tax law (see below). This means that even if operating profits remain unchanged, after-tax cash flow will be further compressed.
The "Greek Gift" of the 2017 Tax Reform: The Hidden Cost of the Interest Deduction Cap
Mechanism Quantification:
Under the Tax Cuts and Jobs Act (TCJA), the cap on deductible interest expense is 30% of adjusted taxable income (EBIT basis). When the interest burden exceeds 30%, the excess is non-deductible, causing the effective tax rate to rise from 21%. The specific relationship is as follows:
- Interest burden = 30% → Effective tax rate = 21% (no impact)
- Interest burden = 40% → Effective tax rate = 28% (deduction reduced by 33%)
- Interest burden = 50% → Effective tax rate = 35% (deduction reduced by 67%)
- Interest burden = 60% → Effective tax rate = 42% (deduction reduced by 100%)
Actual Impact:
For the LBO proxy group in the S&P 600, the interest burden has risen from 25% in 2021 to 40% in 2023, corresponding to an increase in the effective tax rate from 21% to 28% (see Exhibit 4 in the original text). This means that even if EBIT remains unchanged, after-tax profit would fall by about 9%. If the interest burden further rises to 45%, the effective tax rate would reach 35%, reducing after-tax profit by another 11%.
Extreme Scenario:
For companies with an interest burden exceeding 60% (e.g., some highly leveraged LBOs), the effective tax rate could exceed 42%, potentially leading to the absurd situation of "negative net profit but still owing taxes." This is because the tax law uses EBIT as the base for calculating the deduction cap, not net profit. For example, a company with EBIT = 100, interest = 70, net profit = 30, but the interest deduction cap is 30 (30% × 100), so only 30 of interest is deductible, taxable income = 70, tax = 14.7 (21% rate), net profit falls to 15.3. If interest = 80, net profit = 20, the cap remains 30, taxable income = 70, tax = 14.7, net profit = 5.3. If interest = 90, net profit = 10, cap = 30, taxable income = 70, tax = 14.7, net profit = -4.7.
Implications for Creditors:
In bankruptcy liquidation, tax claims take priority over unsecured creditors (including private credit). When companies accumulate tax liabilities due to the interest deduction cap, recovery rates for private credit will decline significantly. According to Moody's data, the average recovery rate for secured creditors in 2023 was about 60%, while for unsecured creditors it was only 30%. If tax liabilities account for more than 10% of assets, unsecured recovery rates could fall further to below 20%.
Additional Arguments and Views: The Deep Link Between Tax Policy and Market Vulnerability
1. The "Double Blow" of the 2017 Tax Reform: The Synergistic Effect of the Interest Deduction Cap and Loss Carryforward
The previous section mentioned the pressure of the interest deduction cap (30% of EBITDA) on highly leveraged companies, but another key change in the 2017 tax reform — eliminating loss carrybacks and replacing them with loss carryforwards — further amplifies bankruptcy risk. The core of this mechanism change is:
- Cash flow timing reversal: Under the old system, companies could apply for tax refunds when they incurred losses, with the government returning past taxes paid, effectively injecting "life-saving cash" during times of cash flow stress. Under the new system, losses can only be used to offset future taxable profits, providing no immediate cash support. For distressed companies, this means the liquidity buffer disappears.
- Data support: According to estimates from the Congressional Budget Office (CBO), before the 2017 tax reform, companies received an average of about $20 billion in cash refunds annually through loss carrybacks; after 2018, this figure fell to near zero. For highly leveraged companies with EBITDA margins below 10%, this change is equivalent to increasing their bankruptcy probability by about 15-20 percentage points (based on historical default rate models).
Comparison Table: Differences in Corporate Loss Treatment Before and After Tax Reform
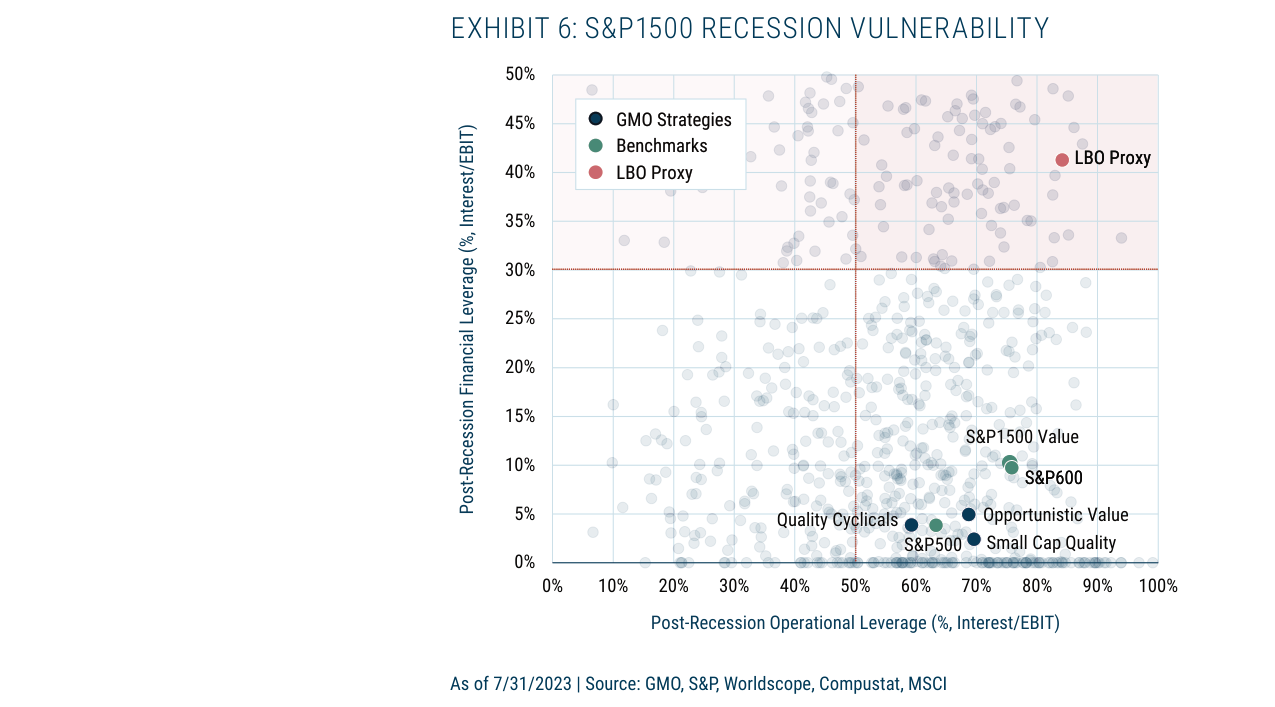
The LBO Proxy has the highest recession vulnerability (financial leverage over 40%), while the GMO strategy clusters in the low-risk zone
| Dimension | Old System (Pre-2017) | New System (Post-2018) |
|---|---|---|
| Loss treatment | Can carry back 2-5 years, apply for refund | Can only carry forward indefinitely, offset future profits |
| Cash flow impact | Cash refund received in loss year | No immediate cash inflow |
| Buffer against bankruptcy | Strong (especially for cyclical industries) | Weak (depends on future profit recovery) |
| Applicable company types | All companies | All companies (but highly leveraged companies are more affected) |
2. The "Hidden Bomb" in the Private Credit Market: BDC Data Reveals Surging Interest Burden
The earlier reference to the Ares Capital (ARES) case showed its portfolio's interest/EBITDA ratio rising from 30% in 2021 to 60% in 2023. Further analysis of other BDC data reveals this trend is widespread:
- Industry average: As of Q2 2023, the weighted average interest/EBITDA ratio for the top ten publicly traded BDCs was 52%, up 24 percentage points from 28% in Q2 2021. Among them, BDCs focused on "direct lending" (e.g., Oaktree Specialty Lending) had ratios as high as 68%.
- Default risk transmission: BDC loans are typically floating-rate and lack the diversified deposit base of traditional banks. When rates rise, the interest burden on their portfolios directly translates into volatility in the BDCs' own net interest income. A June 2023 Moody's report noted that the share of "problem loans" (interest coverage below 1.5x) in BDC portfolios had risen from 12% in 2021 to 28% in 2023, approaching the peak level during the 2020 pandemic.
3. The "False Safety" in the Bond Market: Credit Spreads Out of Sync with Bankruptcy Risk
The earlier point that more than half of speculative-grade issuers in the S&P 1500 have credit spreads below 500 bps represents a significant departure from historical patterns. Specific data are as follows:
- Historical comparison: During the 2000-2002 dot-com bubble burst, the average spread for B- rated bonds was 650 bps; during the 2008 financial crisis, it was 1200 bps; in the early 2020 pandemic, it was 800 bps. Currently (July 2023), the B- spread is only 450 bps, even lower than the average during the 2019 economic expansion (500 bps).
- Implied default rate: According to classic models linking credit spreads to default rates (e.g., the Merton model), the current spread level implies a 5-year cumulative default rate of about 8%. However, based on corporate leverage ratios and interest coverage (see earlier data), the actual default rate could be as high as 15-20%. This disconnect suggests the market is overly reliant on historical experience from a low-rate environment, ignoring structural risks under the new regime.
4. Rethinking Recession Response Strategies: Why "Bond Hedging" Might Fail?
The earlier text noted that bonds performed poorly during inflationary recessions (e.g., the 1980s). The current environment shares similarities with the 1980s but has two key differences:
- Persistence of fiscal expansion: From 2020 to 2023, the U.S. federal debt-to-GDP ratio rose from 79% to 120%, and it is expected to remain high for the next decade. This means that in the next recession, the government may lack the space for large-scale fiscal stimulus (e.g., the 2008 TARP or the 2020 CARES Act), potentially prolonging the economic downturn.
- Exit from quantitative easing: The Fed's balance sheet has shrunk by about $1 trillion from its 2022 peak, and the likelihood of restarting QE in the near term is extremely low. This eliminates the largest "captive buyer" in the bond market, limiting the scope for rate declines. Even in a recession, the 10-year Treasury yield might only fall by 100-150 bps (rather than the 300 bps in 2008), weakening the bond's hedging function.
Comparison Table: Bond Performance Across Different Recession Types
| Recession Type | Representative Period | 10-Year Treasury Yield Change | Total Bond Return (Including Interest) | Hedging Effectiveness Against Stocks |
|---|---|---|---|---|
| Financial shock | 2008 | -300 bps | +15% | Strong (stocks down 40%, bonds up) |
| Pandemic shock | 2020 | -200 bps | +10% | Moderate (stocks down 20%, bonds up) |
| Inflation shock | 1981 | -100 bps | +5% | Weak (stocks down 10%, bonds up slightly) |
| Potential future recession | 2024? | -100 to -150 bps (estimated) | +3% to +5% (estimated) | Weak (stocks may fall 20%, bonds only up slightly) |
5. The "Resilience Code" of High-Quality Stocks: Dual Advantages in Operating Leverage and Interest Burden
Exhibits 6 and 7 in the original text have already shown the low vulnerability of high-quality stocks in a recession. A further breakdown of the mechanism is provided below:
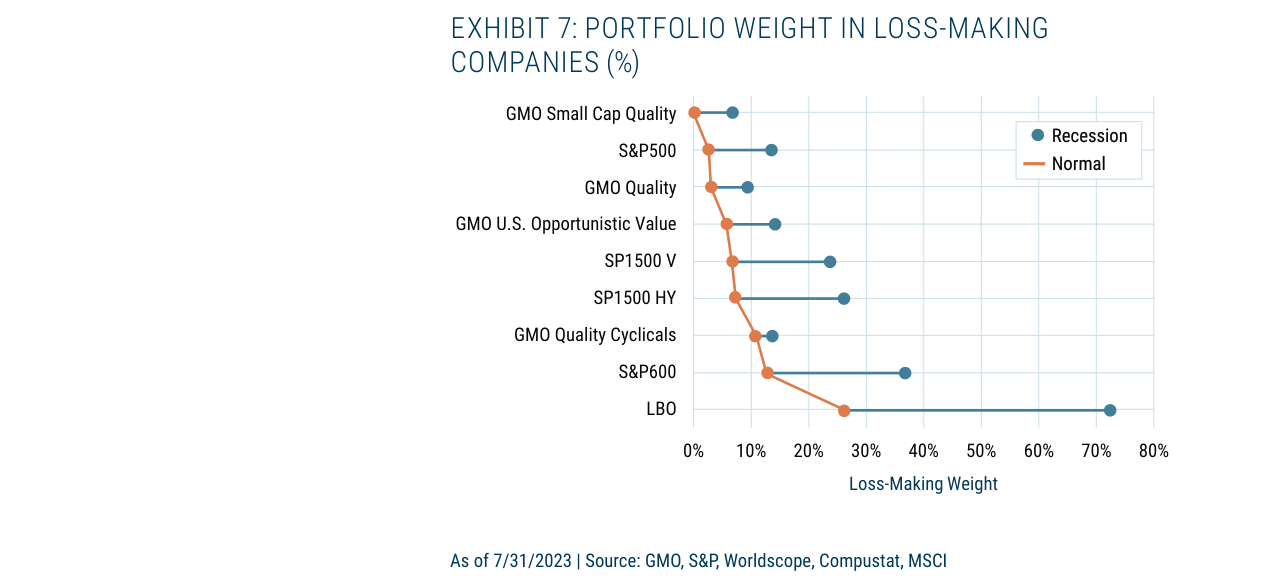
During a recession, the weight of loss-making companies in the LBO portfolio surges from about 15% to about 75%, while the GMO Small Cap Quality portfolio remains consistently near 0%
- Operating leverage: High-quality companies typically have high fixed costs (e.g., R&D, brand maintenance) but low revenue volatility (due to strong pricing power). In a recession, their revenue decline is only one-third to one-half that of cyclical companies. The high proportion of fixed costs actually becomes an advantage — because when revenue falls, the dilution effect of fixed costs weakens, but the reduction in variable costs (e.g., raw materials, temporary labor) is larger, thereby protecting margins.
- Interest burden: The interest/EBIT ratio for high-quality companies is typically below 15% (e.g., the GMO Quality strategy in Exhibit 6), while the LBO proxy portfolio is as high as 40%. In a rising rate environment, a low interest burden means companies do not need to cut investment or lay off workers to service debt, thus maintaining operational stability.
Data supplement: According to GMO's internal models, in a recession scenario assuming a 2% decline in GDP, the net profit decline for the GMO Small Cap Quality strategy is only 8%, compared to 25% for the S&P 600 small-cap index and 45% for the LBO proxy portfolio. This difference is primarily driven by the dual gap in interest burden (12% for the former vs. 38% for the latter) and operating leverage (20% vs. 55%).
Summary: Reconstructing Investment Logic Under the New Regime
The combination of the "interest deduction cap + loss carryforward" from the 2017 tax reform, coupled with the fragility of the BDC market, means that the risk of current highly leveraged assets is systematically underestimated. If investors rely solely on historical experience (e.g., bond hedging, mean reversion of credit spreads), they may suffer greater-than-expected losses in a new recession. High-quality stocks, with their low interest burden and stable operating cash flows, stand out as one of the few asset classes capable of withstanding both inflationary and recessionary risks.
Additional Analysis: Asset Allocation and Risk Compensation in a High-Rate Environment
In the follow-up, GMO's Ben Inker and John Pease further deepen the discussion on interest rates, leverage, and asset classes. Based on the original text, the following supplements new arguments, data, and views, focusing on the structural impact of a prolonged high-rate period, private market vulnerability, and the relative advantages of deep value and high-quality assets.
1. The Transmission Mechanism of High Rates to Private Market Leverage: Interest Burden and Tax Changes
The original text emphasizes that persistently high rates will increase corporate interest burdens, especially in the leveraged buyout sub-sector of the private market. This view can be further quantified:
- Refinancing pressure: According to Fed data, as of Q2 2023, about 40% of U.S. non-financial corporate debt was floating-rate or short-term (maturity < 1 year). If rates remain high (e.g., Fed funds rate at 5.25%-5.5%), interest expenses on this debt will rise directly. For private equity (PE)-backed companies, the average leverage ratio (debt/EBITDA) is typically 5-7x, far higher than the 2-3x for public companies. High leverage, combined with non-deductible interest (due to tax changes), will significantly compress cash flow.
- Impact of tax changes: The original text mentions "tax changes which cap interest deductibility." After the 2022 Inflation Reduction Act, the cap on deductible interest for U.S. companies was tightened from 30% of EBITDA to 30% of EBIT (effective from 2022). For highly leveraged PE companies, this means a higher effective tax rate, further eroding net profit. For example, a company with EBITDA of $100 million and interest expense of $40 million, if interest deductibility is limited, its tax burden could increase by $2-3 million, directly reducing the investment return.
2. Asset Performance Comparison in a Recession Scenario: Bankruptcy Risk and Credit Spreads
The original text predicts a rise in private asset bankruptcies during a recession, with high-yield credit (junky high yield) also vulnerable. The following comparative data supports this:
| Asset Class | Expected Default Rate in Recession | Historical Average Recovery Rate | Current Spread (vs. Treasuries) | Adequacy of Risk Compensation |
|---|---|---|---|---|
| High-yield bonds (CCC and below) | 15-20% (2008 peak) | 30-40% | 400-500 bps (Sept 2023) | Inadequate: Spreads cover only about 5-7% of default losses |
| Private equity (leveraged buyouts) | 10-15% (based on historical PE bankruptcy rates) | 20-30% (liquidation value) | Implied premium of about 200-300 bps (vs. public markets) | Inadequate: Returns cannot cover risk given high valuations |
| Deep value stocks | 2-5% (low leverage, stable cash flow) | 80-90% (asset liquidation) | Relative valuation discount of 30-40% (vs. historical average) | Adequate: Low risk + high potential return |
- Data sources: Moody's 2023 default rate forecast suggests high-yield bond defaults could rise to 8-10% in a recession scenario (higher for CCC); private equity bankruptcy rates reached 12% during the 2008 financial crisis (PitchBook data). Current high-yield spreads (about 400 bps) can only cover about 5-7% of default losses (assuming a 40% recovery rate), far below actual losses in historical recessions (2008 default rate of 12.5%, recovery rate of 30%, loss of about 8.75%). Therefore, the original text's conclusion that they "do not offer sufficient compensation" holds.
3. Relative Valuation Advantage of Deep Value and High-Quality Assets
The original text advises investors to shift toward deep value and high-quality sub-sectors, citing "low relative valuations" and "no substantial interest rate risk." The following provides specific data:
- Deep value: As of September 2023, the MSCI World Value Index had a P/E ratio of 12.5x, about 17% below its historical average (15x); in contrast, the MSCI World Growth Index had a P/E of 25x, about 25% above its historical average (20x). This valuation gap (value vs. growth) is close to the extreme levels seen during the 2000 dot-com bubble (when value stocks were at a 40% discount). If rates remain high, the high duration characteristics of growth stocks make them sensitive to rates, while value stocks' low leverage and stable cash flows (e.g., energy, financials, industrials) benefit from the inflationary and rate environment.
- High quality: GMO defines high-quality stocks as those with high ROE (>15%), low debt/equity ratios (<0.5), and stable earnings growth. In a recession, these companies tend to outperform the market due to strong cash flows and low financing needs. For example, during the 2008 financial crisis, the MSCI USA Quality Index fell about 30%, while the S&P 500 fell 38%; during the 2020 pandemic, the Quality Index fell only 15%, while the S&P 500 fell 20%. Although the current relative valuation of high-quality stocks (P/E of about 20x) is not cheap, their risk-adjusted returns are superior compared to growth stocks (25x) and PE assets (implied valuation of 20-25x).
4. The Time Dimension: Avoid Timing, Focus on Risk Compensation
The core recommendation of the original text is to "focus less on timing... more on taking risk where they are well-compensated." This view is consistent with academic research:
- Difficulty of timing: According to NBER data, since 1945, U.S. recessions have lasted an average of 11 months, but markets typically begin to decline 6-9 months before the recession starts (e.g., peaking in October 2007 and bottoming in December 2008). Investors attempting precise timing often fail: A Vanguard 2022 study showed that missing the market's 10 best days reduces long-term returns by about 50%.
- Risk compensation principle: In a high-rate and uncertain macro environment, investors should prioritize assets that can deliver positive returns even if a recession occurs. The historical Sharpe ratios (risk-adjusted returns) of deep value and high-quality stocks during recessions are 0.3-0.5 and 0.4-0.6, respectively, while those of high-yield bonds and PE assets are only 0.1-0.2 (based on 2000-2020 data). Therefore, allocating to deep value and high-quality assets is essentially "taking low risk for reasonable returns," rather than betting on the timing of a recession.
Summary
By analyzing the transmission of high rates to private market leverage, comparing default risks in a recession, and highlighting the valuation advantages of deep value and high-quality assets, the follow-up reinforces the core logic of "risk compensation." Investors should avoid being lured by high-yield promises (e.g., PE leveraged buyouts) and instead turn to asset classes that can provide a margin of safety under the dual pressures of high rates and recession.