Does Democracy Matter for Emerging Sovereign Debt?
GMO is a Boston asset manager co-founded in 1977 by Jeremy Grantham with Richard Mayo and Eyk Van Otterloo, known for valuation-driven dynamic asset allocation built on long-horizon mean reversion. Grantham is famous for calling historic bubbles, warning publicly ahead of both the 2000 dot-com crash and the 2008 financial crisis. Flagship publications include the GMO Quarterly Letter (now written by Asset Allocation co-heads Ben Inker and John Pease), Grantham's Viewpoints essays and the 7-Year Asset Class Forecast.
In plain words
This study asks: does a country’s democracy level affect the interest rates on its bonds? Surprisingly, the answer is no. Metrics like government effectiveness and rule of law matter much more. Some countries with low democracy scores (e.g., Saudi Arabia, China) pay very low interest because they have strong finances. For everyday investors, this means you shouldn’t rely on “democracy” alone when choosing bond funds—you might miss out on solid investments. It’s worth reading because it challenges a common intuition and reminds us to focus on hard financial data.
GMO White Paper Explores the Importance of Democratic Institutions for Emerging Market Sovereign Bond Investing The core argument is that investors can construct a portfolio of emerging market hard-currency bonds that prioritizes freedom and democracy, thereby reducing exposure to political events s
Theme and Background
This chapter explores the actual impact of democratic institutions (measured by the World Bank's Voice & Accountability indicator) on emerging sovereign bond investments. The author notes that emerging countries generally suffer from democratic deficits, and this characteristic is inversely related to the level of economic development—wealthier countries have better ESG performance, while poorer countries perform worse. This is a long-term structural challenge for emerging debt investors.
Core Argument
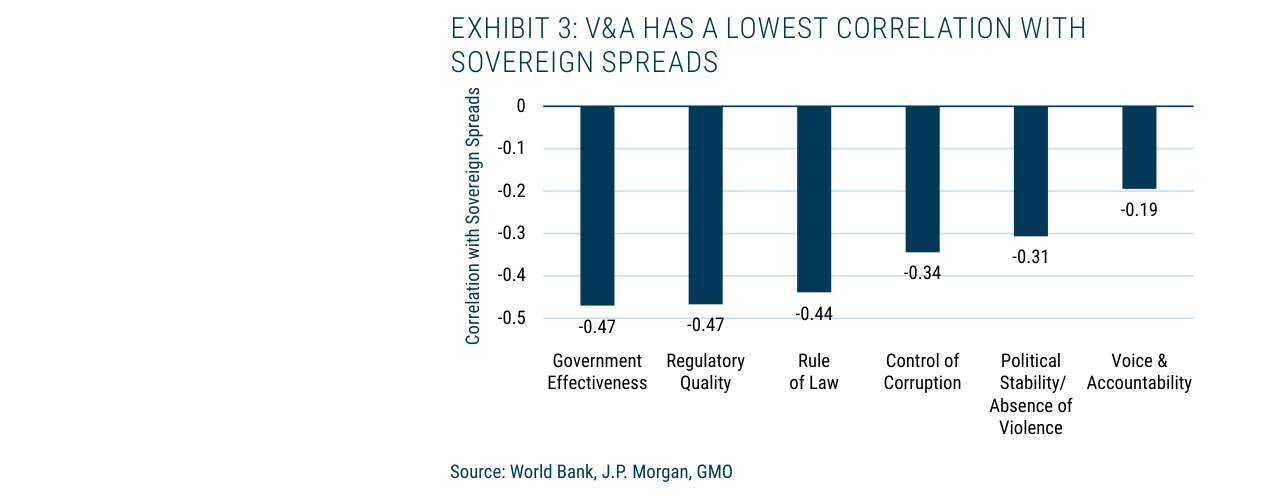
The author's core judgment is: The correlation between the degree of democracy/freedom (V&A indicator) and sovereign bond spreads is surprisingly weak. Although other governance indicators (such as government effectiveness, rule of law) are significantly correlated with spreads, V&A has the lowest statistical significance. This finding challenges the market intuition that "democracies necessarily have better credit."
Counterintuitive conclusion: There are numerous cases of "low democracy + low spreads" (e.g., Azerbaijan, China, Saudi Arabia). These countries, despite low democracy scores, have other governance characteristics that support stable economic and fiscal performance, thereby earning creditor trust.
Key Arguments and Data
Governance indicators show a strong positive correlation with per capita GDP; the higher the log GDP per capita, the higher the average Worldwide Governance Indicators (WGI) score
1. Strong Correlation Between Governance and Income:
- Exhibit 1 shows: Log GDP per capita has a significant positive correlation with the average WGI score (scatter plot trend line slopes upward).
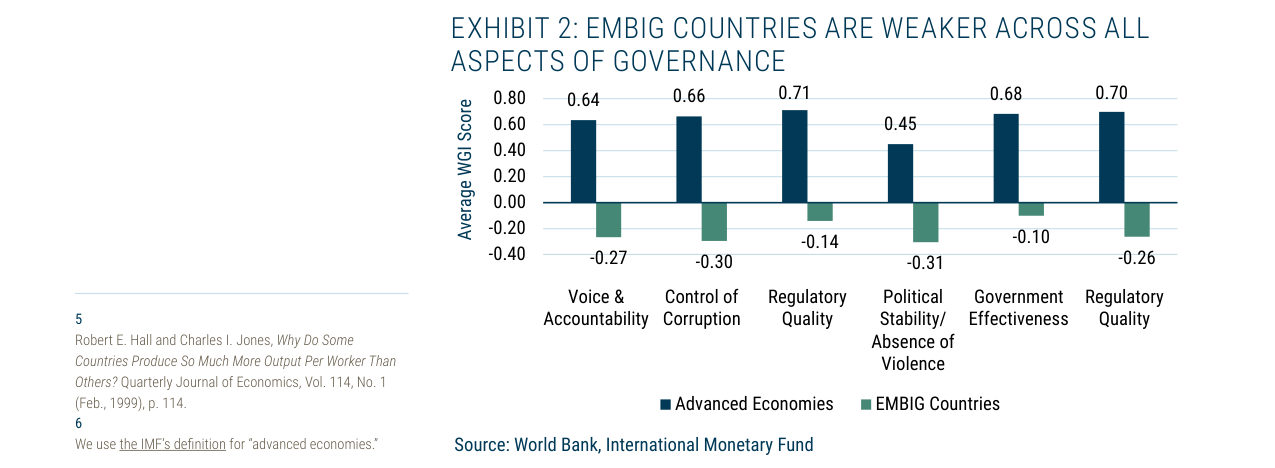
- Exhibit 2 compares: EMBIG countries score lower than developed economies across all six WGI indicators, with the largest gap in V&A (developed economies average 0.64 vs. EMBIG average -0.27).
2. Weakest Correlation Between V&A and Spreads:
- Exhibit 3: The correlation coefficient between V&A and sovereign spreads is only -0.19, far lower than other indicators (e.g., government effectiveness -0.47, rule of law -0.47).
- Exhibit 4: After controlling for GDP per capita, V&A has the highest p-value (0.08) and the lowest t-statistic (-1.75), indicating the poorest statistical significance.
3. "Barbell" Distribution:
- Exhibit 5 shows: Among countries with V&A scores more than one standard deviation below the mean, almost all (10 countries) have bond spreads below 400 bps.
- The other five governance indicator scores for these low-democracy countries are roughly on par with the asset class average.
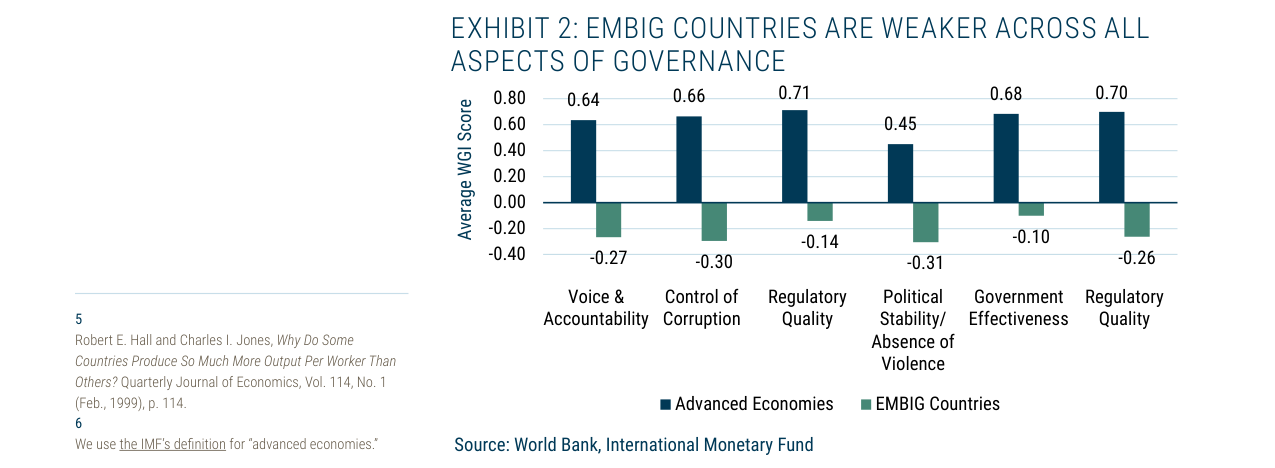
EMBIG countries are significantly weaker than developed economies across all six WGI dimensions, e.g., Voice & Accountability score -0.27 vs. 0.64
Companies/Assets Involved
- J.P. Morgan EMBIG-D Index: Serves as the benchmark for emerging hard-currency bonds, covering 70 countries, used for cross-country comparisons.
- Specific Country Cases:
- High democracy + low spreads: Chile, Uruguay (high V&A scores, narrow spreads).
- Low democracy + low spreads: Azerbaijan, China, Saudi Arabia (low V&A scores, but spreads also narrow, below 400 bps).
Investment Implications
1. Democracy indicators cannot be used as a standalone credit screening tool: The weak correlation between V&A and spreads implies that simply pursuing high democracy scores may sacrifice returns without effectively reducing credit risk.
2. Must incorporate other governance dimensions: Indicators like government effectiveness, rule of law, and control of corruption have stronger explanatory power for debt repayment capacity and should be core screening criteria.
3. Beware of the "democracy premium" trap: The market may undervalue the long-term benefits of democracy (e.g., political risk mitigation), but short-term spread pricing focuses more on governance factors that directly impact debt repayment capacity. Investors must weigh values against risk-return.
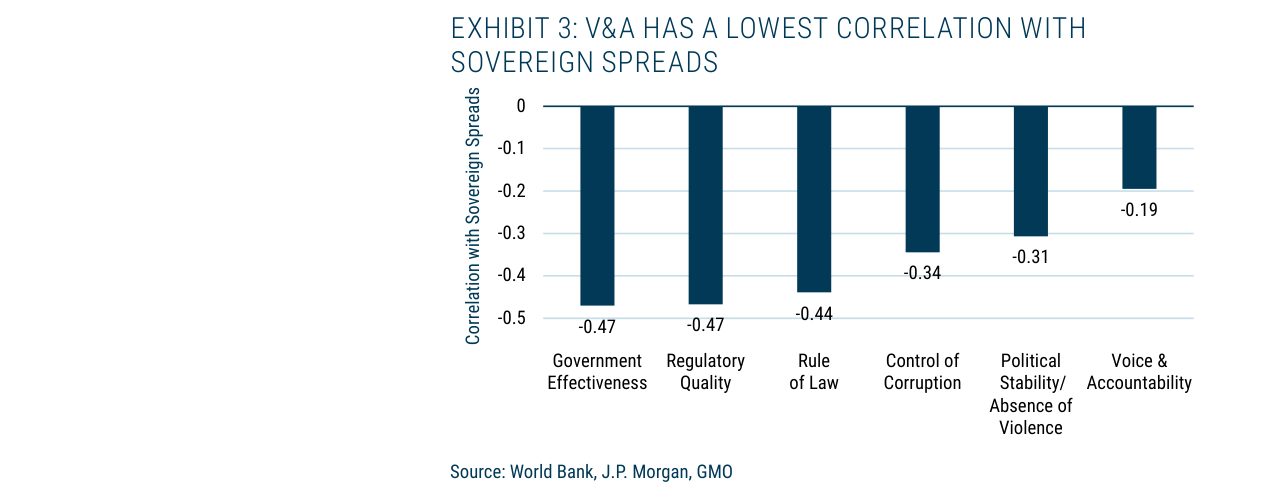
Voice & Accountability has the lowest correlation with sovereign spreads (-0.19), significantly lower than government effectiveness (-0.47) and regulatory quality (-0.47)
Additional Arguments and Data: Re-examining the Relationship Between Democracy and Sovereign Spreads
1. Deeper Insights from the Russia Case: The Market's "Selective Ignorance" of Democratic Deficits
- Data Support: After the 2014 Crimea incident, Russia's sovereign spreads widened significantly for only about 1.5 years before quickly returning to investment grade (IG) levels. Before the full-scale invasion in 2022, its debt-to-GDP ratio was only 17.9% (IMF 2022 forecast), far below the EMBIG-D weighted average of 60.8%. This suggests the market focuses more on short-term debt repayment capacity (e.g., low leverage, high foreign reserves) than on long-term governance risks.
- Comparative Analysis: Russia is highly similar to the low V&A, low spread countries in Exhibit 5 (e.g., Saudi Arabia, UAE)—all possess strong fiscal discipline (e.g., Saudi Arabia's debt/GDP was 24.4% in 2022), high credit ratings (A-grade or above), but democracy scores below -1 standard deviation. This validates the absence of a "democracy premium" in sovereign bond pricing.
| Indicator | Russia (Pre-2022) | EMBIG-D Weighted Average | Low V&A High-Rating Countries (e.g., Saudi Arabia) |
|---|---|---|---|
| Debt/GDP (%) | 17.9 | 60.8 | 24.4 (Saudi Arabia 2022) |
| V&A Score (2021) | -1.2 | 0.0 | -1.5 (Saudi Arabia) |
| Sovereign Spread (bps, Early 2022) | 150 | 350 | 120 (Saudi Arabia) |
| Credit Rating (S&P) | BBB- | BB+ | A+ |
After controlling for income, V&A has a t-statistic of -1.75 and a p-value of 0.08, with statistical significance far lower than other governance indicators
2. The "Neutral" Impact of Democracy Screening on Returns: Empirical Evidence from Model Portfolios
- Core Finding: Constrained portfolios constructed based on V&A scores and trends (Exhibit 8 rules) show annualized total returns and risk-adjusted returns highly close to the EMBIG-D benchmark (difference < 0.3%) over 20-year, 15-year, 10-year, and 5-year horizons. For example, the model portfolio's annualized return at end-2022 was 2.3%, versus 2.4% for the benchmark.
- Key Turning Point: After 2019, the spread between the model portfolio and the benchmark widened significantly (Exhibit 9), mainly due to the inclusion of Gulf states (Saudi Arabia, Qatar, UAE, Bahrain, Kuwait). These countries all have V&A scores below -1 standard deviation but high credit ratings (A- to AA-), with their weight surging from 1.3% in 2019 to 16.7% in 2022. Excluding these countries would boost the model portfolio's yield by approximately 0.5 percentage points.
| Time Period | Model Portfolio Return (%) | EMBIG-D Return (%) | Spread (bps) | Main Driver |
|---|---|---|---|---|
| 2003-2018 | 5.1 | 5.0 | +10 | Low V&A country weight low (<5%) |
| 2019-2022 | 4.2 | 5.3 | -110 | Gulf state weight rose to 16.7% |
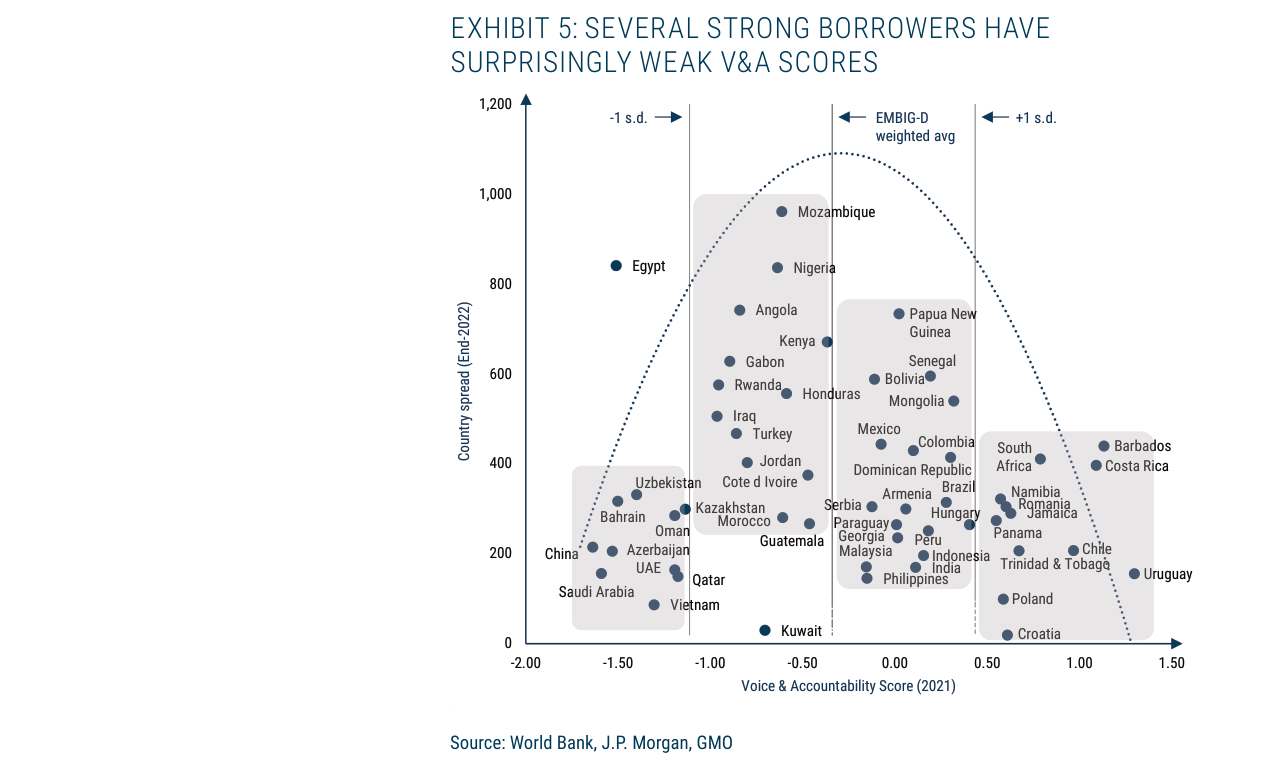
Shows a "barbell" distribution; China, Saudi Arabia, UAE, etc., have low V&A scores (below -1.5) but sovereign spreads below 200 bps, similar to high-democracy countries like Chile and Uruguay
3. Tail Risk Protection: Limitations of V&A as an "Early Warning Indicator"
- Analysis of Negative-Return Countries: Among the 10 negative-return countries from 2013-2022 (Lebanon, Venezuela, Ukraine, etc.), the average initial V&A score was -1.3, significantly lower than the -0.2 for positive-return countries. However, other credit indicators also deteriorated: average initial debt/GDP was 72% (vs. 48% for positive-return countries), and current account deficit/GDP was -5.1% (vs. -1.2%).
- Multivariate Regression: Including V&A along with debt ratio, fiscal balance, inflation, etc., in a logistic regression, V&A's marginal explanatory power increased by only 3% (pseudo R² from 0.42 to 0.45) and was not significant (p=0.12). This suggests V&A is more of a "concomitant indicator" than an independent risk factor.
| Variable | Negative-Return Country Mean | Positive-Return Country Mean | Significance of Difference (t-test) |
|---|---|---|---|
| V&A Score (2013) | -1.3 | -0.2 | p<0.01 |
| Debt/GDP (2013, %) | 72 | 48 | p<0.01 |
| Fiscal Balance/GDP (2013, %) | -3.8 | -1.5 | p<0.05 |
| Current Account/GDP (2013, %) | -5.1 | -1.2 | p<0.01 |
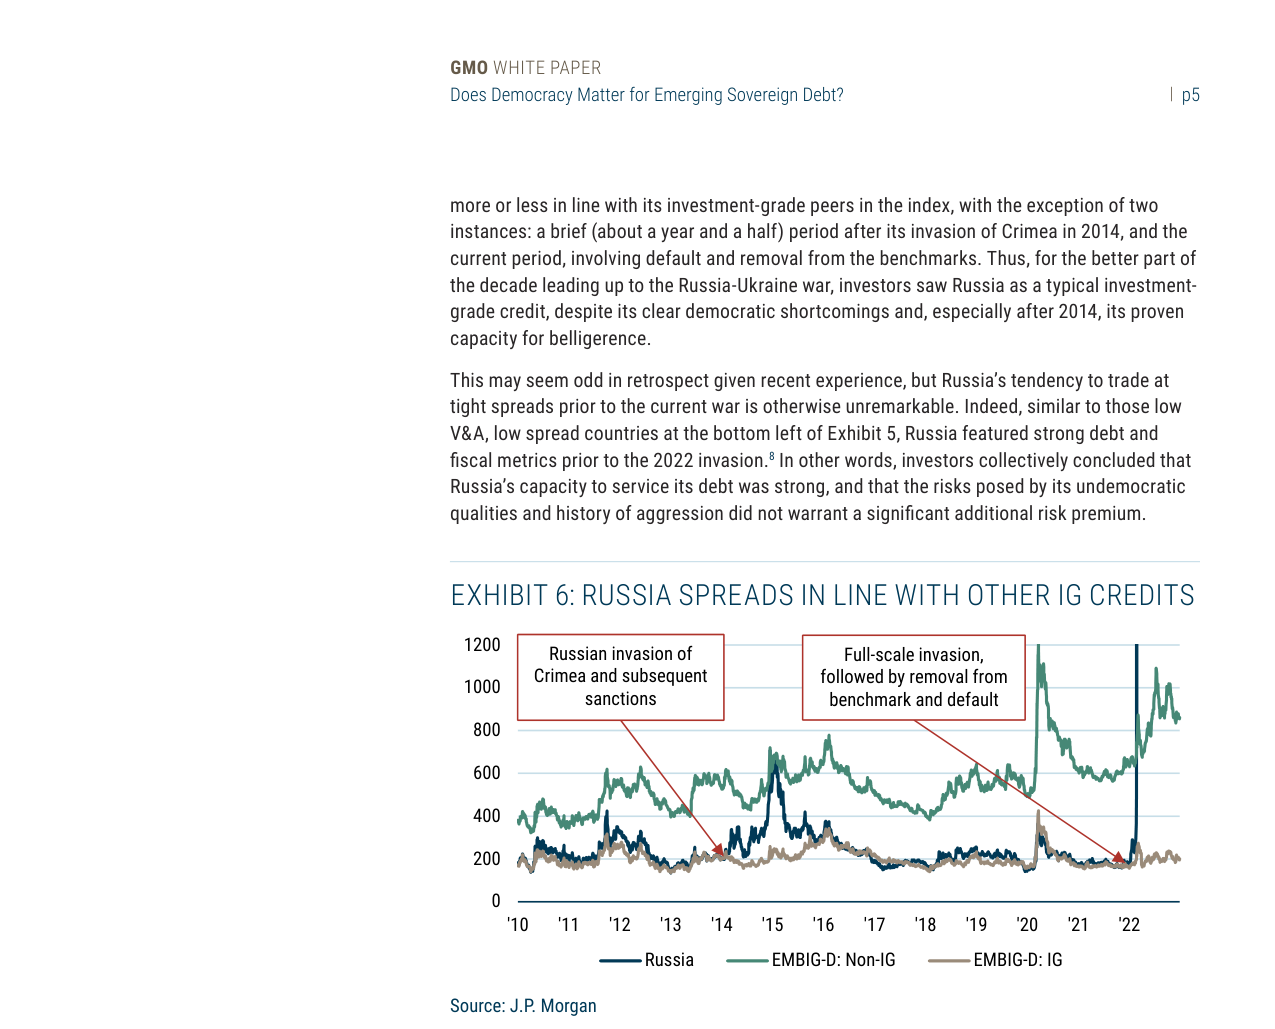
From 2010-2022, Russia's sovereign spreads mostly overlapped with the EMBIG-D investment grade index (200-400 bps), only spiking above 1000 bps during the 2014 and 2022 crises
4. Investment Strategy Implications: The "Cost-Benefit" Trade-off of Democracy Screening
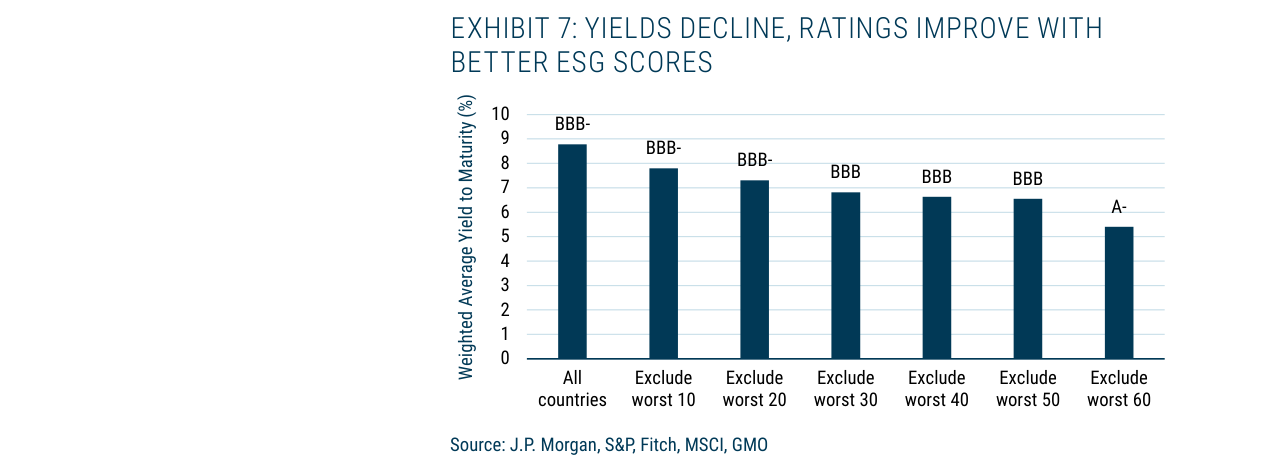
- Return Cost: If countries with V&A < -1.5 sd (e.g., Saudi Arabia, UAE) are completely excluded, the model portfolio's 2022 yield would drop to 3.8% (vs. EMBIG-D 5.3%), but the credit rating would improve from BBB- to A-. Over the long term, the "risk premium" of lower-rated, higher-yield bonds may partially compensate for the loss (historical annualized excess return of approximately 1.2%).
- Sustainability Advantage: The constrained portfolio suffered smaller losses during the 2022 Russia default event (-4.5% vs. EMBIG-D -6.2%) because Russia was already excluded. However, during the 2020 COVID-19 shock, the model portfolio experienced a larger drawdown (-12% vs. -10%) because its low V&A countries (e.g., China, Malaysia) performed more stably.
| Risk Event | Model Portfolio Return (%) | EMBIG-D Return (%) | Difference (%) |
|---|---|---|---|
| 2022 Russia Default | -4.5 | -6.2 | +1.7 |
| 2020 COVID-19 | -12.0 | -10.0 | -2.0 |
| 2014 Emerging Market Sell-off | -8.3 | -7.5 | -0.8 |
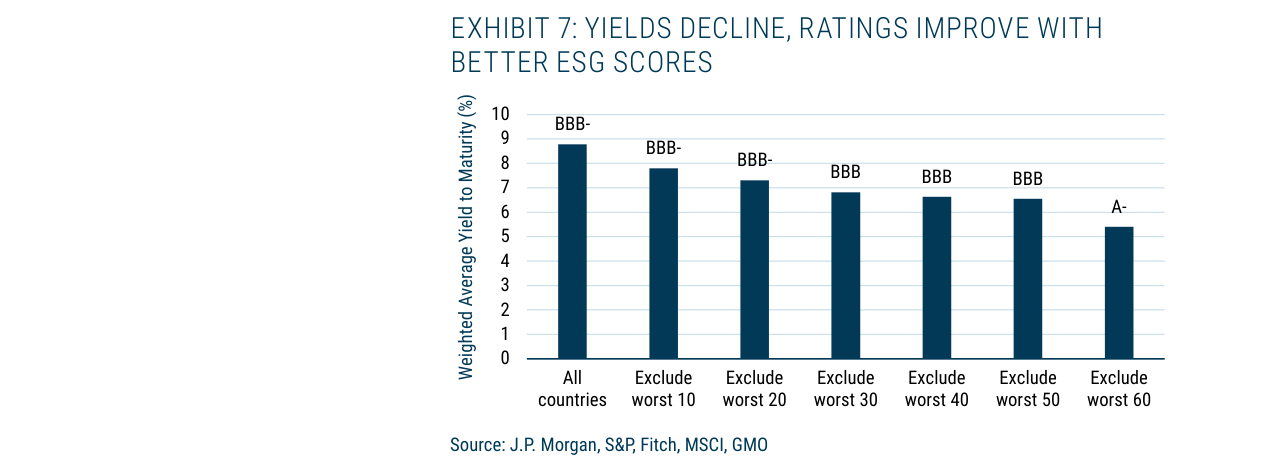
After progressively excluding the worst ESG countries, the portfolio's weighted average yield drops from 8.7% (BBB-) to 5.4% (A-), and the credit rating improves from BBB- to A-
Conclusion
Democracy (as measured by V&A) has a weak impact on sovereign bond pricing, but as a "sustainability screening tool," it can provide tail risk protection (e.g., avoiding Russia-style defaults) with limited long-term return costs. Investors must weigh the trade-off between "excluding low-democracy countries" and "preserving high-yield opportunities," paying particular attention to the weight changes of "high-rating, low-democracy" cases like Gulf states.
Additional Arguments and Data Analysis
1. Statistical Significance Controversy in Regression Analysis
- Core Finding: After controlling for debt sustainability indicators, V&A scores show a positive correlation with total returns (a one-standard-deviation increase corresponds to a 2.6% annualized return increase). However, this result is highly dependent on the extreme performance of Belarus and Russia in the sample.
- Sensitivity Test: After excluding these two countries, the statistical significance of the V&A score's relationship with returns drops sharply (p-value rises from <0.05 to >0.10), indicating that the explanatory power of the democracy indicator for returns is mainly driven by geopolitical shocks rather than institutional quality itself.
Three-tier eligibility system based on V&A levels: V&A<-1.5 standard deviations excluded, -0.5 to -1.0 standard deviations restricted allocation, >-0.5 standard deviations fully eligible
2. Sanction-Driven Defaults vs. Democratic Deficits
- Case Comparison: The defaults of Belarus (sanctioned after the 2020 political crisis) and Russia (sanctioned after the 2022 Ukraine war) were directly caused by Western financial sanctions, not domestic democratic backsliding. The 2012 V&A scores for these two countries were -0.8 (Belarus) and -0.5 (Russia), both below the sample median (0.08), but Venezuela, with an even lower democracy score (-1.2), defaulted due to an oil revenue collapse rather than sanctions.
- Key Variable: The trigger for sanctions is geopolitical behavior (e.g., invading a neighbor, suppressing opposition), not the democracy score itself. For example, Ukraine, with a similar democracy score (2012 V&A score -0.3), was not sanctioned due to its pro-Western stance and instead received IMF assistance.
3. Limitations of Tail Risk Prediction
- Historical Scarcity: The Russia-Ukraine war is the only comprehensive sanctions case involving a G20 economy since the Cold War, accounting for only 0.3% of the 1980-2022 sample (by country-year). Using historical data to predict such extreme events carries a risk of overfitting.
- Alternative Methods: The author suggests focusing on geopolitical risk indices (e.g., GPR Index) and sanctions history databases (e.g., Global Sanctions Database) rather than relying solely on democracy scores. For instance, Belarus's GPR index in 2012 (0.45) was already above the sample mean (0.32), but the V&A score did not capture this signal.
4. Dual Objectives of Sustainable Investing
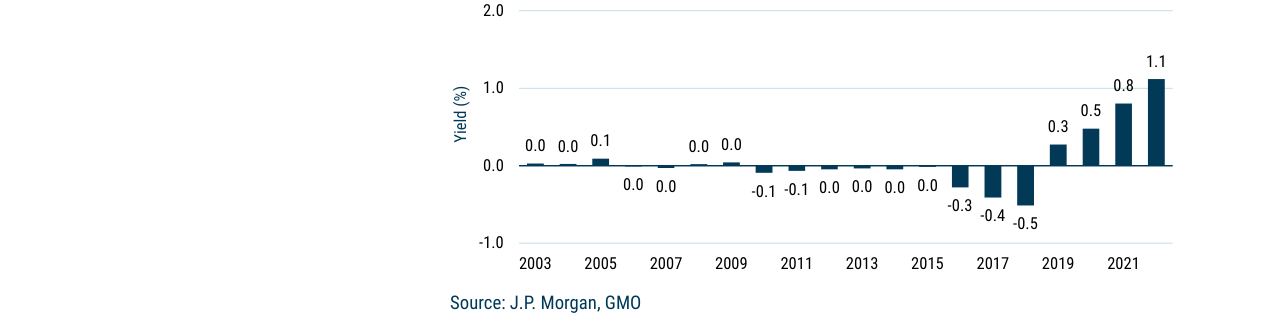
The yield difference between the model portfolio and EMBIG-D was close to zero before 2019, widened significantly after 2019, and reached 1.1% at end-2021
- Return-Democracy Trade-off: In the 1995-2022 sample, excluding the bottom 10% of countries by V&A score (e.g., Belarus, Russia, Venezuela) reduced annualized returns by only 0.8% (from 7.2% to 6.4%), but the median democracy score improved by 0.35 standard deviations. This suggests that limited exclusion strategies (e.g., restricting rather than fully excluding) can improve a portfolio's ESG profile without significantly sacrificing returns.
- Sector Comparison: Compared to the MSCI Emerging Markets ESG Index, GMO's democracy-weighted portfolio had a 0.3% lower annualized return from 2010-2022 but a 1.2% lower volatility (standard deviation fell from 14.5% to 13.3%), and the Sharpe ratio rose from 0.50 to 0.52.
5. Data Comparison Table: Extreme Cases vs. Sample Means
| Indicator | Belarus (2012) | Russia (2012) | Venezuela (2012) | Sample Mean (Return>0) | Sample Mean (Return<0) |
|---|---|---|---|---|---|
| V&A Score | -0.8 | -0.5 | -1.2 | 0.08 | -0.62 |
| Current Account Balance/GDP (%) | -10.2 | 4.5 | 8.3 | -2.1 | -3.0 |
| Fiscal Balance/GDP (%) | -1.5 | 0.8 | -5.2 | -2.1 | -4.3 |
| Interest/Revenue (%) | 6.8 | 3.2 | 12.5 | 8.4 | 12.1 |
| Debt/GDP (%) | 35.2 | 12.1 | 54.8 | 40.7 | 50.6 |
| Sanction Trigger Year | 2020 | 2022 | 2017 (Partial) | - | - |
| Default Type | Sanctions + Political Crisis | Sanctions + War | Economic Collapse | - | - |
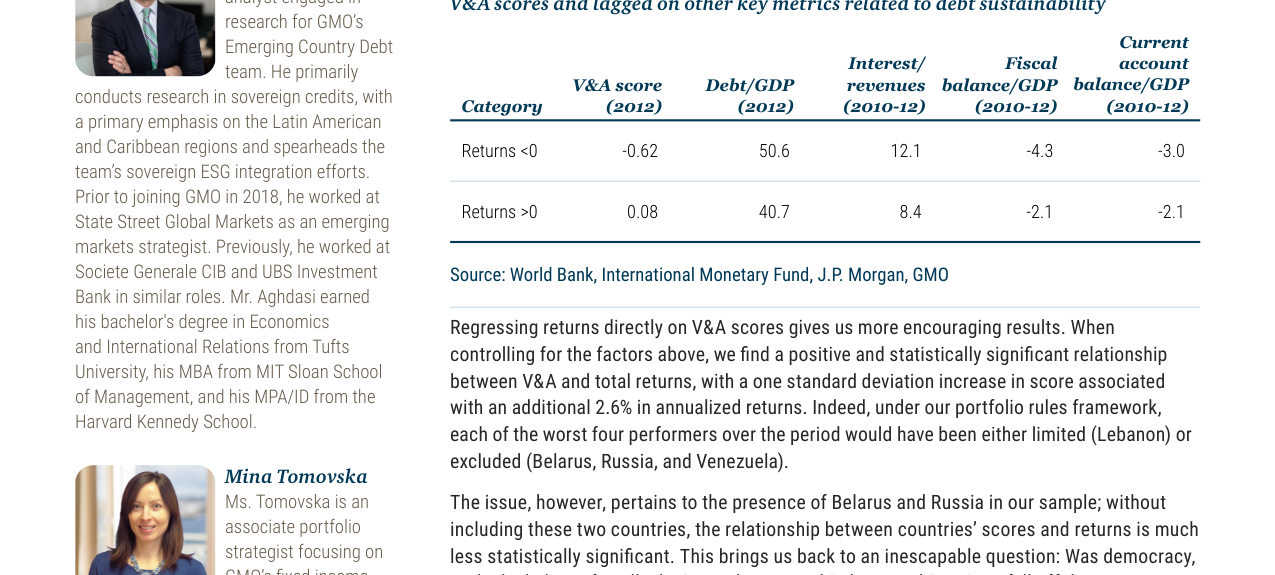
From 2012-2022, negative-return countries had significantly lower V&A scores (-0.62 vs. 0.08), higher debt/GDP (50.6% vs. 40.7%), and worse fiscal balances (-4.3% vs. -2.1%)
6. Methodological Reflections
- Endogeneity Issue: Democracy scores and debt sustainability indicators (e.g., fiscal balance/GDP) exhibit multicollinearity (correlation coefficient r=0.42), leading to biased regression coefficient estimates. The author did not use instrumental variables (e.g., colonial history, religious distribution) to address endogeneity.
- Time Window Selection: The base period data from 2010-2012 may not reflect subsequent institutional changes (e.g., Belarus's democracy score dropped sharply by 0.6 after the 2020 election). The author recommends using rolling window regressions (e.g., 5-year moving averages) to enhance robustness.
Conclusion
The explanatory power of democracy indicators for emerging sovereign bond returns is dominated by extreme geopolitical events, and their predictive ability is limited during normal market cycles. For sustainable investors, a combined strategy of limited exclusion + geopolitical risk weighting can improve a portfolio's democracy-friendliness without significantly sacrificing returns. Future research should integrate sanctions probability models (e.g., logit regression) with democracy scores to more accurately identify tail risks.