Turbulence on the Path to Transformation
GMO is a Boston asset manager co-founded in 1977 by Jeremy Grantham with Richard Mayo and Eyk Van Otterloo, known for valuation-driven dynamic asset allocation built on long-horizon mean reversion. Grantham is famous for calling historic bubbles, warning publicly ahead of both the 2000 dot-com crash and the 2008 financial crisis. Flagship publications include the GMO Quarterly Letter (now written by Asset Allocation co-heads Ben Inker and John Pease), Grantham's Viewpoints essays and the 7-Year Asset Class Forecast.
In plain words
Clean energy stocks have crashed over 70% from their 2021 peak, even though companies are making more money and policies like the US Inflation Reduction Act (IRA, a big subsidy package) are in place. The report says this selloff isn't a bubble bust but a normal growing pain: rules for the IRA took time to finalize, delaying projects, and investors panicked over small earnings misses. Some stocks now trade at less than 5 times annual earnings while growing 25-30% a year—a possible bargain. For ordinary investors, it's a contrarian play: pick profitable, solid firms, avoid hype stocks, and be patient.
GMO Research Report: Turbulence on the Path of Transition The report focuses on the clean energy sector, which, after outperforming the MSCI ACWI by over 200% from 2020 to early 2021, experienced a sharp correction of over 70% from its peak in February 2021. The core argument identifies excessive va
Theme and Background
This chapter, as the opening of the report, focuses on the clean energy sector's absolute decline of over 70% from its February 2021 peak and the severe divergence between this decline and the improvement in industry fundamentals. The author argues that despite significant policy support (especially the Inflation Reduction Act, IRA) and corporate earnings growth, changes in market sentiment and the macroeconomic environment have led to a sharp stock price correction, creating opportunities for long-term investors.
Core Thesis
The author's core judgment is: The crash in the clean energy sector is not a bubble burst, but a normal adjustment in the industry's maturation process. Counterintuitively, the report argues that major positive policies like the IRA actually exacerbated the stock price decline in the short term due to project delays caused by unresolved details; simultaneously, the market's overreaction to quarterly earnings (e.g., a slight revenue miss triggering a stock price drop of over 30%) precisely indicates that valuations have entered an extremely undervalued territory.
Key Arguments and Data
1. Historical Performance Comparison: The Wilderhill Clean Energy Index outperformed the MSCI ACWI by over 200% from 2020 to early 2021, then fell over 70% (absolute decline) from its February 2021 peak, erasing all excess returns and declining further.
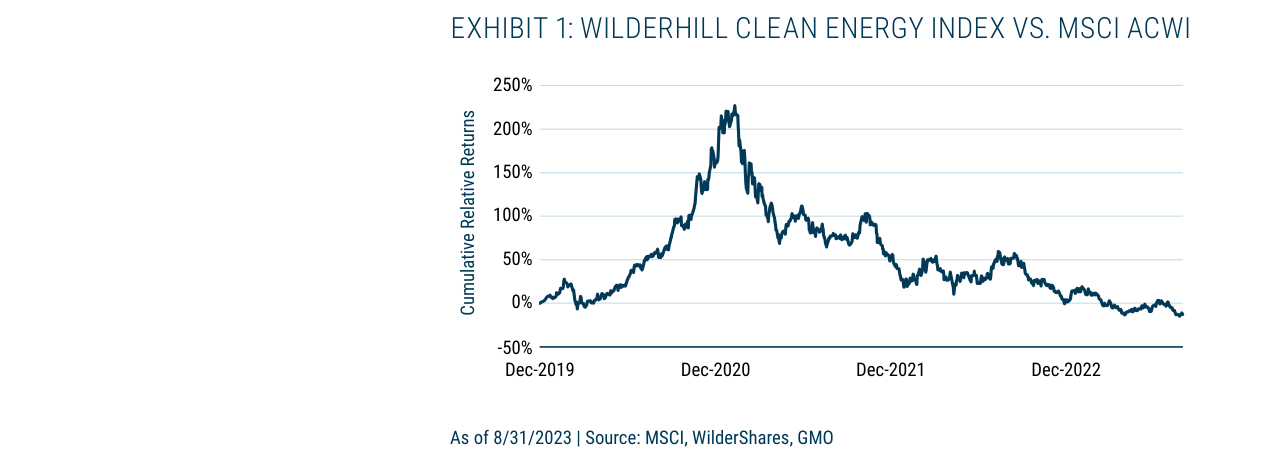
The Wilderhill Clean Energy Index outperformed the MSCI ACWI by over 200% from 2020 to early 2021, then fell over 70% from its February 2021 peak
2. Cost Trend Reversal: After over a decade of decline, the levelized cost of energy (LCOE) for solar and wind power rebounded in 2021-2023 due to material inflation and supply chain issues (Exhibit 2 shows the cost curve moving upward after 2021).
3. Short-Term Negative Effects of the IRA: Although the IRA is a long-term positive (with potential final federal spending estimated at up to $2.7 trillion, far exceeding the initial estimate of $369 billion), in the short term, project delays caused by unresolved government rules have pushed demand backward rather than forward.
4. Divergence Between Corporate Earnings and Market Reaction:
- Canadian Solar: Q2 net profit grew nearly 130% year-over-year, and revenue grew about 40% quarter-over-quarter. However, revenue was only at the low end of guidance, causing the stock price to fall over 30% from early July. The current P/E ratio is less than 5x (the company has an annual growth rate of 25-30%).
- SolarEdge: Q2 revenue grew about 40%, and earnings per share grew nearly 700% year-over-year. However, due to inventory overhang requiring several quarters to digest, the stock price fell over 40% from its July high. The P/E ratio is about 16x (lower than the MSCI ACWI's 20x and the S&P 500's 22x).
5. Valuation Comparison:
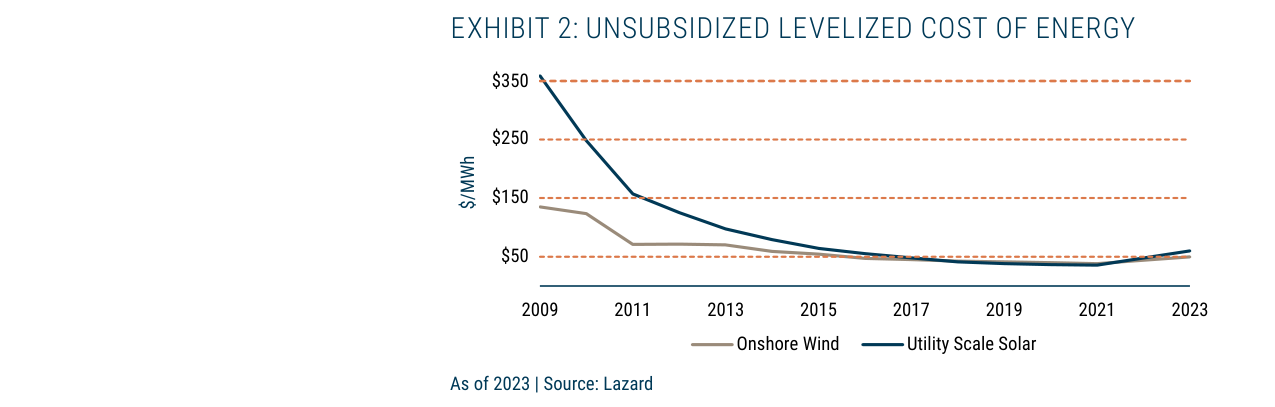
From 2009 to 2023, utility-scale solar costs fell from approximately $350/MWh to about $50/MWh, with onshore wind reaching a similar level
| Metric | Canadian Solar | SolarEdge | MSCI ACWI | S&P 500 |
|---|---|---|---|---|
| Forward P/E | <5x | ~16x | 20x | 22x |
| Annual Growth Rate | 25-30% | 20-30% | - | - |
Companies/Assets Involved
- Canadian Solar (one of the world's largest solar developers): Bullish. Q2 net profit grew nearly 130% YoY, revenue grew 40% QoQ, but the stock price plunged over 30% due to a slight revenue miss. The P/E ratio is below 5x, which the author believes is severely undervalued.
- SolarEdge (solar inverter manufacturer): Bullish. Q2 EPS grew nearly 700% YoY, maintaining a 20-30% long-term growth guidance. However, inventory overhang caused the stock price to fall over 40%. The P/E ratio is 16x, representing a significant discount relative to the broader market.
- Wilderhill Clean Energy Index: As an industry benchmark, it has fallen over 70% from its February 2021 peak. The author believes the index has overly discounted pessimistic expectations.
- Invesco Solar ETF (TAN): As a reference for solar sector performance, it briefly rallied another 50% from late 2020 to early 2021 before a significant correction.
Investment Implications
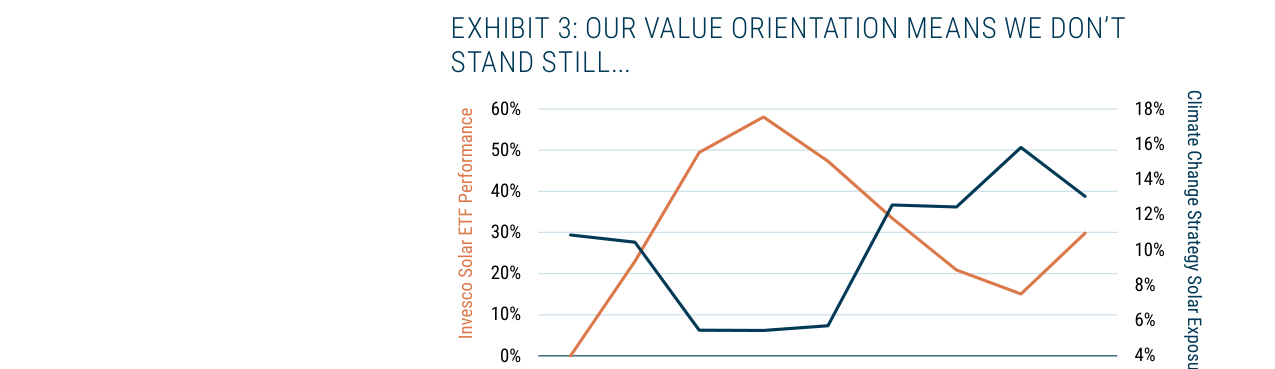
From October 2020 to June 2021, the Invesco Solar ETF gained 60%, and GMO's Climate Change Strategy's solar exposure peaked at 16% in May 2021
1. Time for Contrarian Positioning Has Arrived: Clean energy sector valuations have fallen to extreme lows (e.g., Canadian Solar's P/E ratio below 5x), while industry fundamentals (earnings growth, policy support) have not deteriorated. The current period is a window for long-term investors to gradually build positions.
2. Focus on Quality and Value: Avoid chasing speculative, high-valuation, unprofitable names. Select companies with competitive advantages (e.g., cost control, technological moats), confirmed earnings growth, and reasonable valuations (e.g., Canadian Solar, SolarEdge).
3. Use Volatility for Dynamic Rebalancing: Actively reduce positions when the sector overheats and valuations spike due to sentiment (e.g., solar stocks briefly rallying another 50% in late 2020). Re-add positions when panic leads to excessive declines. This contrarian approach can significantly enhance long-term returns.
4. Monitor Policy Implementation Pace: The long-term benefits of the IRA (expected to last into the 2040s) are not yet priced into the market. However, in the short term, be wary of project delays before rules are finalized. Once the government clarifies the rules, demand could be released in a concentrated burst.
Sequel Analysis: The IRA's Short-Term Lag and Long-Term Certainty
1. The Contradiction Between the IRA's "Policy Time Lag" and Market Short-Termism
The sequel explicitly states that the substantive impact of the IRA has yet to be felt ("The impact of the IRA has yet to be felt"). Much of 2023 was spent finalizing various incentive rules, leading to delays in corporate investment decisions. This "policy time lag" is not historically uncommon—for example, after the U.S. Clean Air Act Amendments (1990), it took about three years for the acid rain emissions trading market to form effective price signals. The current timeline for finalizing IRA rules (late 2023 to early 2024) implies a significant mismatch between the market's short-term pessimism towards clean energy (e.g., the clean energy index hitting a 52-week low in August 2023) and the long-term policy dividend.
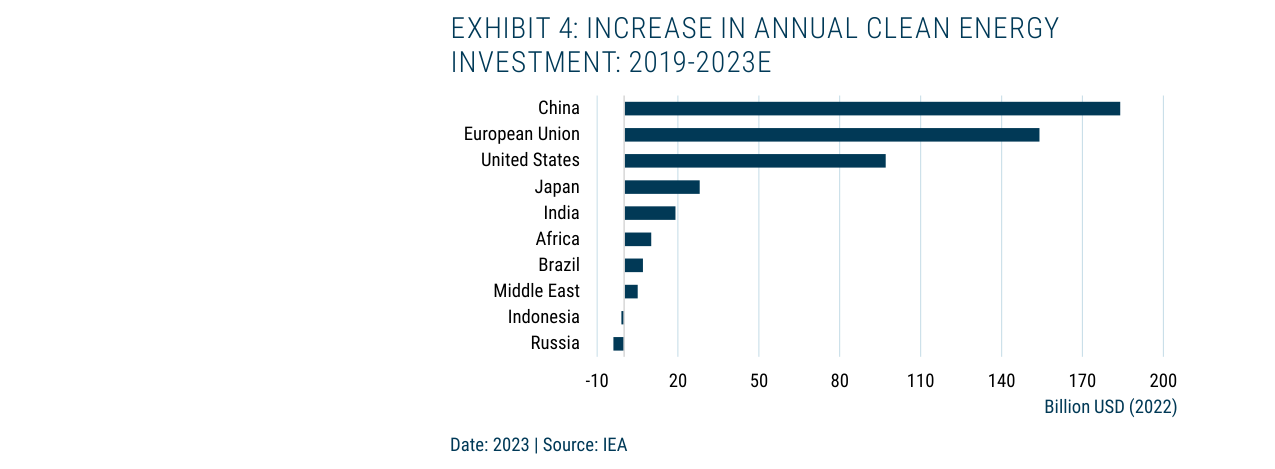
From 2019 to 2023, China led in clean energy investment growth with approximately $190 billion, followed by the EU with about $160 billion, and the US with about $100 billion
Key Data Comparison:
| Metric | 2023 Status | Expected Change |
|---|---|---|
| IRA-related Investment Announcements | Manufacturing >$110B, Power Generation >$120B | Accelerated deployment post-2025 |
| Clean Energy Jobs | 170,000 jobs created (White House data) | Projected 1.5 million by 2030 (Labor Energy Partnership) |
| Clean Energy vs. Fossil Fuel Investment | $1.75T vs. $1T (IEA 2023) | Gap expected to widen |
2. Global Clean Energy Investment Landscape: The US Catches Up with China and Europe
The sequel cites IEA data (Exhibit 4) showing the incremental clean energy investment by country from 2019 to 2023. The US increase during this period (approximately $50 billion) significantly lagged behind China (approximately $170 billion) and the EU (approximately $80 billion). However, the enactment of the IRA marks the US's shift from a "follower" to an "aggressive pursuer." Notably, fossil fuel exporting countries like Indonesia and Russia saw near-zero or negative investment growth, reflecting a "winner-takes-all" effect in the global energy transition—capital is increasingly concentrating in regions with clear policies and pronounced cost advantages.
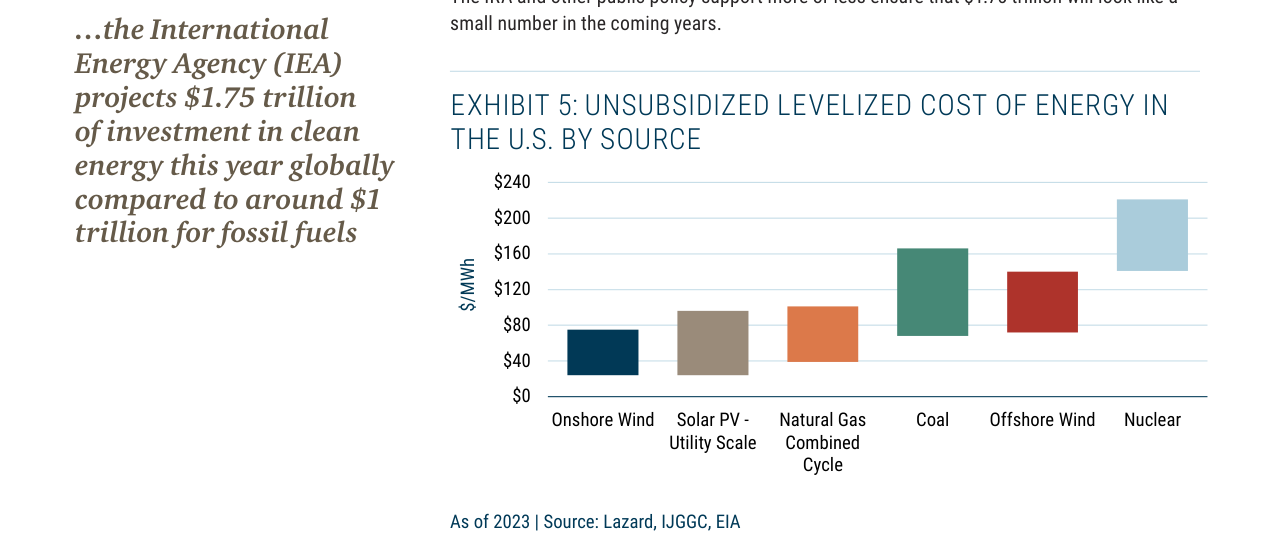
In 2023, US onshore wind costs were the lowest at ~$30/MWh, solar ~$40/MWh, both lower than natural gas, coal, and nuclear
Regional Investment Growth Comparison (2019-2023E, USD Billion):
| Region | Investment Growth | Core Drivers |
|---|---|---|
| China | +170 | Dominance in PV + EV supply chain |
| EU | +80 | Mature wind + hydrogen policy framework |
| US | +50 | Expected to double after IRA rule finalization |
| India | +30 | Third-largest global solar tender scale |
| Africa | +10 | Primarily off-grid solar projects |
3. Cost Competitiveness: Renewables Have Achieved "Unsubsidized Parity"
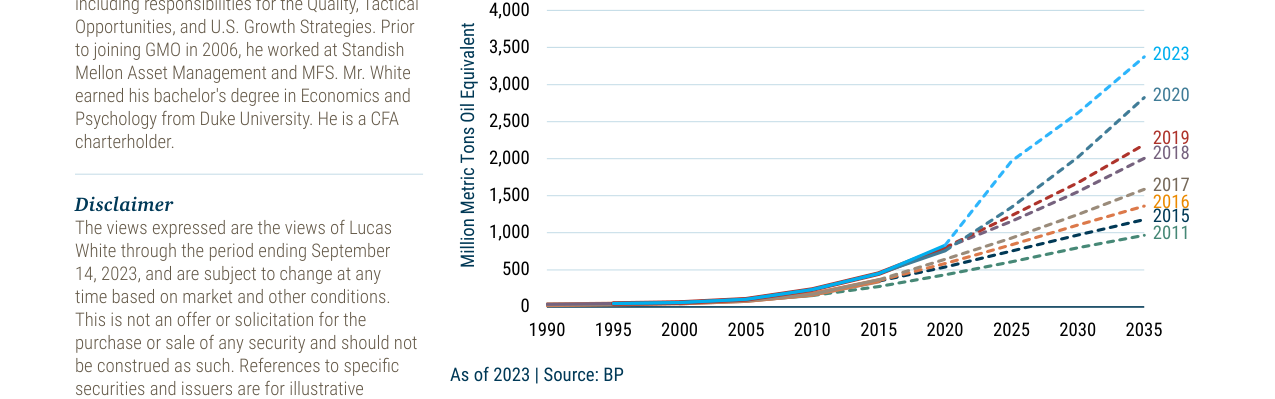
BP forecasts global renewable energy consumption to increase from ~1,000 million tonnes of oil equivalent in 2020 to ~3,500 million tonnes in 2035
Exhibit 5 shows that even without IRA subsidies, the levelized costs of US utility-scale solar (approx. $40/MWh) and onshore wind (approx. $45/MWh) are already lower than natural gas combined cycle (approx. $60/MWh) and coal power (approx. $80/MWh). This trend aligns with Lazard's annual cost analysis: solar costs in 2023 were 89% lower than in 2009, and wind costs were 70% lower. More critically, the IEA predicts that global clean energy investment in 2023 ($1.75 trillion) will surpass fossil fuel investment ($1 trillion) for the first time, and the gap will widen with policies like the IRA—meaning clean energy's "cost advantage" has transitioned from a technical factor to a structural shift in capital allocation.
4. Valuation vs. Fundamentals Divergence: A Historic Buying Opportunity?
The sequel reveals a core contradiction: clean energy companies have strong fundamentals (growth, policy support, cost advantages), yet valuations are at historic lows. As of August 2023, the S&P Global Clean Energy Index and the Invesco Solar ETF traded at a forward P/E of approximately 16x, a 30% discount to the S&P 500. More importantly, GMO's DCF models show that even without considering the IRA's impact, many solar and biofuel companies still have significant upside. Such valuation discounts have historically appeared in sectors like energy before the 2012 shale gas revolution and semiconductors before the 2016 AI boom—representing "golden pits" before technological breakthroughs and policy catalysts.
Valuation Comparison:
| Index/Strategy | Forward P/E (Aug 2023) | Discount to S&P 500 |
|---|---|---|
| S&P Global Clean Energy Index | 16x | -30% |
| Invesco Solar ETF | 16x | -30% |
| S&P 500 | 23x | Benchmark |
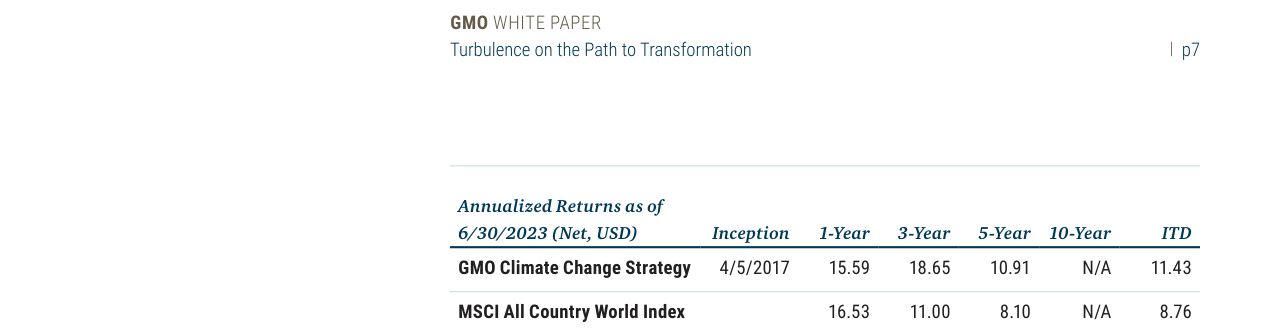
GMO's Climate Change Strategy has an annualized return of 11.43% since inception in 2017, outperforming the MSCI ACWI's 8.76%
5. Political Risk and the "Red State Paradox"
The sequel points out that the jobs and investments created by the IRA are highly concentrated in Republican-controlled "red states" (e.g., Georgia, Oklahoma, Louisiana). This creates a "political lock-in effect": even with a future change in administration, repealing the IRA would directly harm red state economies. For example, Qcells' $2.5 billion factory in Georgia creates 2,000 jobs, and First Solar's $1.1 billion factory in Louisiana creates 1,650 jobs—all located in Republican Senate districts. Historical experience suggests US energy policy has a "one-way ratchet effect": once subsidies and jobs are established, the political cost of repeal is extremely high (e.g., ethanol subsidies, implemented in 2005, have never been abolished).
6. Long-Term Demand Certainty: The "Conservatism" of BP's Forecasts
Exhibit 6 shows that BP's forecasts for renewable energy consumption (2023 version) have been significantly revised upward compared to earlier forecasts from 2011-2017, yet actual consumption continues to exceed expectations. This "forecast bias" is systematic in the clean energy sector: institutions like the IEA, BP, and EIA have, on average, underestimated solar and wind installation growth by 30-50% over the past decade. The core reason is the persistent underestimation of the cost decline rate (learning curve effect) and the scale effect of installations. While BP currently forecasts renewable energy consumption of about 3,500 million tonnes of oil equivalent in 2035, extrapolating the actual growth rate of the past decade (12% annually) suggests the actual figure in 2035 could reach 4,500-5,000 million tonnes of oil equivalent.
7. Risk Factors: Balancing Short-Term Volatility with Long-Term Certainty
The sequel acknowledges multiple risks for clean energy: high financing costs (Fed rate hike cycle), supply chain bottlenecks (polysilicon, lithium), grid interconnection constraints (US transmission line construction cycles up to 10 years), and insufficient storage (lithium price volatility affecting battery costs). However, it is worth noting that these risks are being hedged by policy tools: the IRA's Advanced Manufacturing Production Credit (Section 45X) directly lowers supply chain costs, the Department of Energy's Loan Programs Office (LPO) provides low-interest financing, and the Federal Energy Regulatory Commission (FERC) is advancing transmission planning reforms. Short-term market risks (high beta characteristics) instead offer better entry points for long-term investors—as the sequel concludes: "For investors with the conviction to look beyond the short term, the opportunity in clean energy is extraordinary."