Weighted Average Green Revenue (WAGR): Integrating climate solutions into portfolio construction
GMO is a Boston asset manager co-founded in 1977 by Jeremy Grantham with Richard Mayo and Eyk Van Otterloo, known for valuation-driven dynamic asset allocation built on long-horizon mean reversion. Grantham is famous for calling historic bubbles, warning publicly ahead of both the 2000 dot-com crash and the 2008 financial crisis. Flagship publications include the GMO Quarterly Letter (now written by Asset Allocation co-heads Ben Inker and John Pease), Grantham's Viewpoints essays and the 7-Year Asset Class Forecast.
In plain words
This report introduces a metric called Weighted Average Green Revenue (WAGR), which measures how much of a company's income comes from climate-friendly products like solar panels or electric vehicles. For everyday investors, it offers a more nuanced view than simply labeling a company 'green' or not—it shows actual revenue exposure. However, the data can be distorted by stock market ups and downs, and many private firms don't report it. So use it as one tool alongside others. Worth reading because the green economy is growing fast, and this metric helps spot opportunities more accurately.
A report jointly released by GMO and FTSE Russell focuses on metric-based approaches for integrating climate solutions into portfolio construction. The core argument is that the transition to a net-zero economy creates significant investment opportunities, and companies providing climate and environ
Theme and Background
This section focuses on how to incorporate climate solutions into portfolio construction through systematic metrics. The report notes that the transition to a net-zero economy not only creates risks but also generates significant investment opportunities—companies providing climate and environmental solutions have grown at a compound annual growth rate of approximately 13% over the past decade and have consistently outperformed the market. However, investors lack comparable and standardized metric tools to measure portfolio-level exposure to climate solutions.
Core Thesis
The author's core investment argument is: The Weighted Average Green Revenue (WAGR) is currently the most promising metric for integrating climate solutions measurement into portfolio construction. The counterintuitive insight is that while the WAGR of the FTSE All-World Index declined during the 2022 market downturn (from 8.6% to approximately 6.1%), the unweighted green revenue showed more stable year-over-year growth. This reveals the distorting effect of market capitalization fluctuations on "green exposure"—investors focusing solely on weighted data may underestimate the structural growth trend of the green economy.
Key Arguments and Data
- Growth and Performance: The green economy has grown at a compound annual growth rate of approximately 13% over the past decade (based on the market-cap-weighted green revenue of the FTSE All-World); since 2003, companies with green revenue ≥20% (FTSE EOAS Index) have consistently outperformed the broader market (see Figure 2).
- Future Investment Needs: Achieving net-zero emissions by 2050 requires an investment of $109–$275 trillion (public and private combined); to limit global warming to 1.5°C, the green revenue share of FTSE All-World companies must rise from the current ~6% to 25% by 2050.
- Key WAGR Data: The WAGR of the FTSE All-World grew from 5.5% in 2016 to 8.6% in 2021, but fell back to approximately 6.1% in 2022; in contrast, the unweighted green revenue share rose steadily from 5.0% in 2016 to 6.1% in 2022 (see Figure 1).
- Metric Comparison: The report examines four metrics—green revenue, green capital expenditure, green patents, and avoided emissions—and argues that green revenue is the most advantageous due to its ease of interpretation, direct link to cash flows and real-world impact, high data availability, and strong comparability.
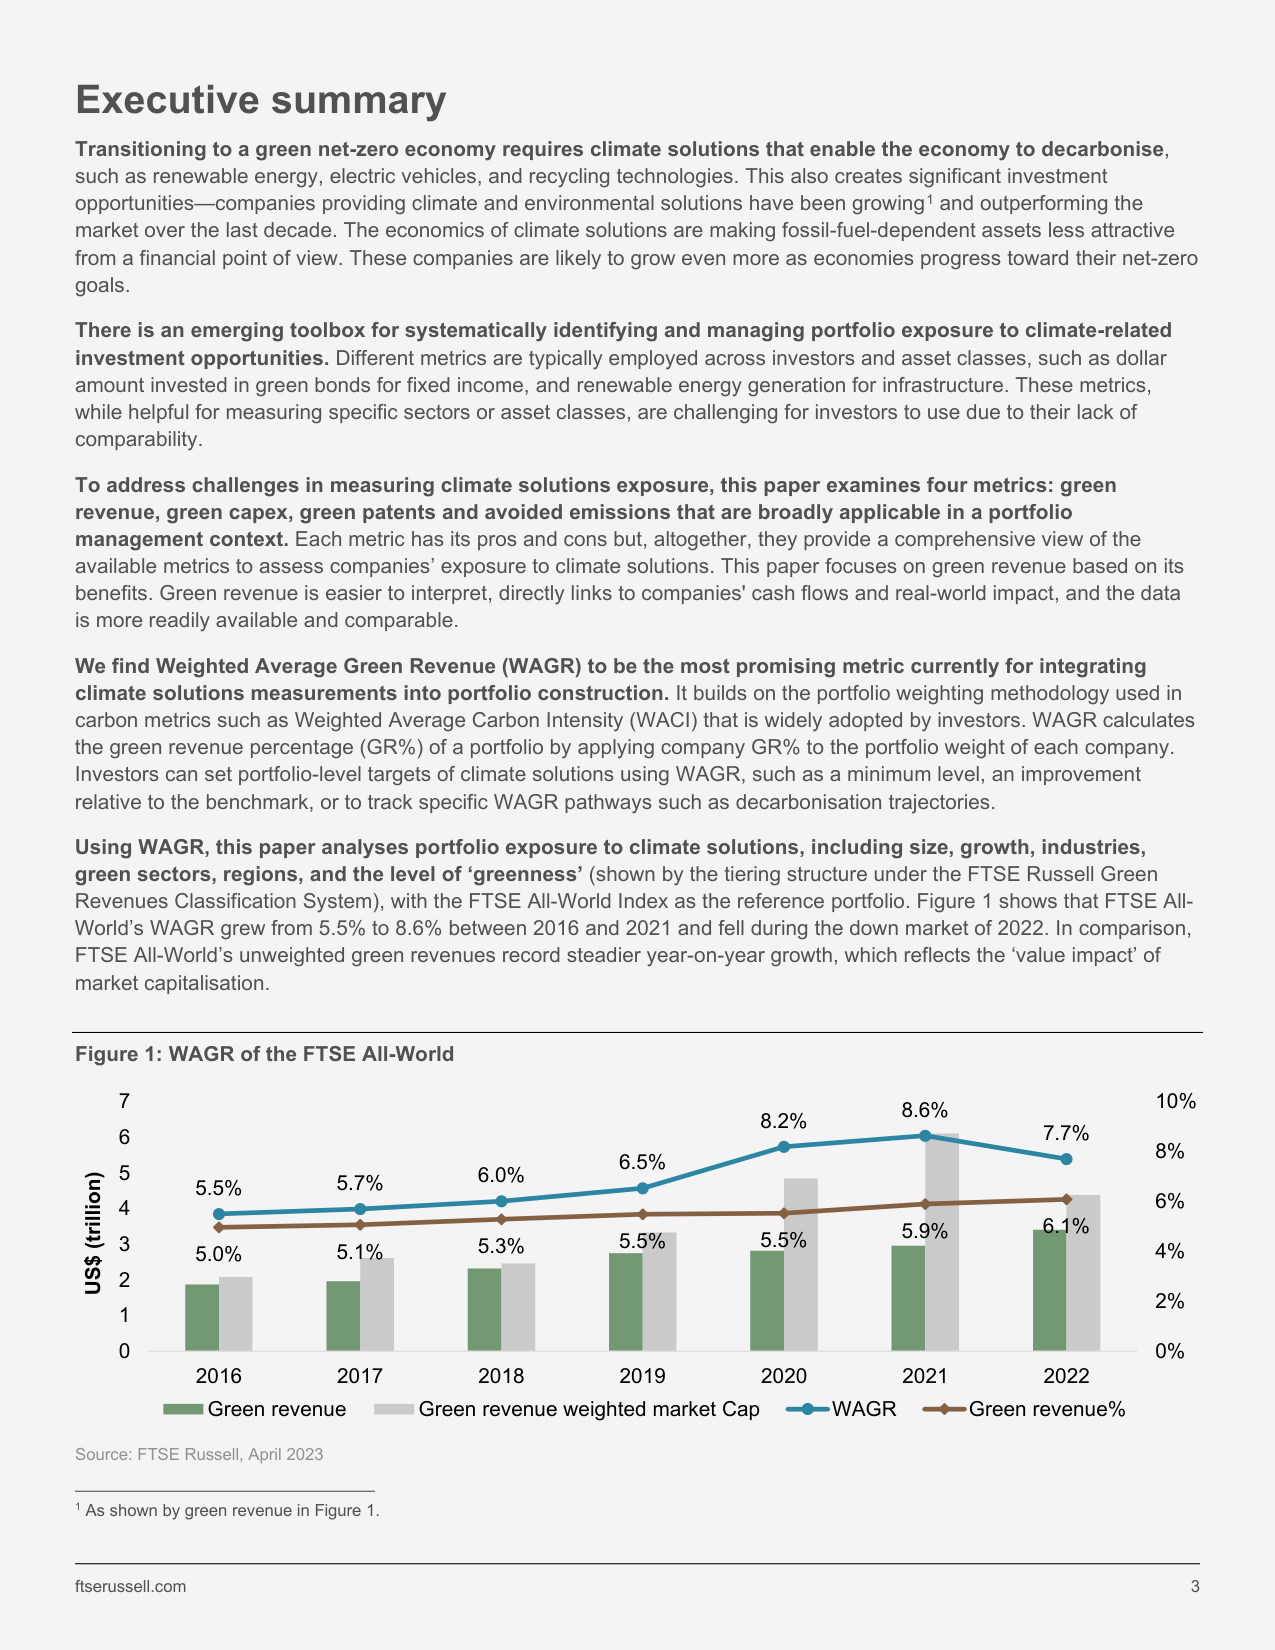
The Weighted Average Green Revenue (WAGR) of the FTSE All-World rose from 5.5% in 2016 to 8.6% in 2021, then fell back to 7.7% in 2022
Companies/Assets Involved
- FTSE All-World Index: Used as a reference portfolio, its WAGR data is analyzed to assess the size, growth, industry, region, and "greenness" of climate solutions exposure.
- FTSE Environmental Opportunities All-Share (EOAS) Index: Includes companies with green revenue ≥20%, which have consistently outperformed the FTSE All Cap Index since 2003, serving as empirical evidence of excess returns from green companies.
- No specific companies are named directly, but the report implicitly references companies in renewable energy, electric vehicles, industrial energy efficiency, and recycling technologies as core beneficiaries of climate solutions.
Investment Implications
- Adopt WAGR as a Portfolio Construction Tool: Investors can set portfolio-level climate solutions targets, such as a minimum WAGR level, improvement relative to a benchmark, or tracking a specific decarbonization pathway (similar to the application of WACI).
- Beware of Market Cap Distortion of "Green Exposure": Unweighted green revenue more stably reflects the structural growth of the green economy. Investors should monitor both weighted and unweighted data to avoid misjudging long-term trends during market downturns (e.g., 2022).
- Focus on Disclosure Improvements and Data Limitations: Green revenue disclosure is still in its early stages, and private market data is scarce. Investors must be aware of trade-offs such as industry/country concentration, volatility, and reduced investable universe that may come with high-WAGR portfolios.
- Combine with Other Sustainability Metrics: WAGR should serve as a complementary tool, used alongside carbon footprint, temperature alignment tracking, and other metrics to comprehensively manage climate risks and opportunities.
Continuation Analysis: Deepening and Challenges of Climate Solutions Metrics
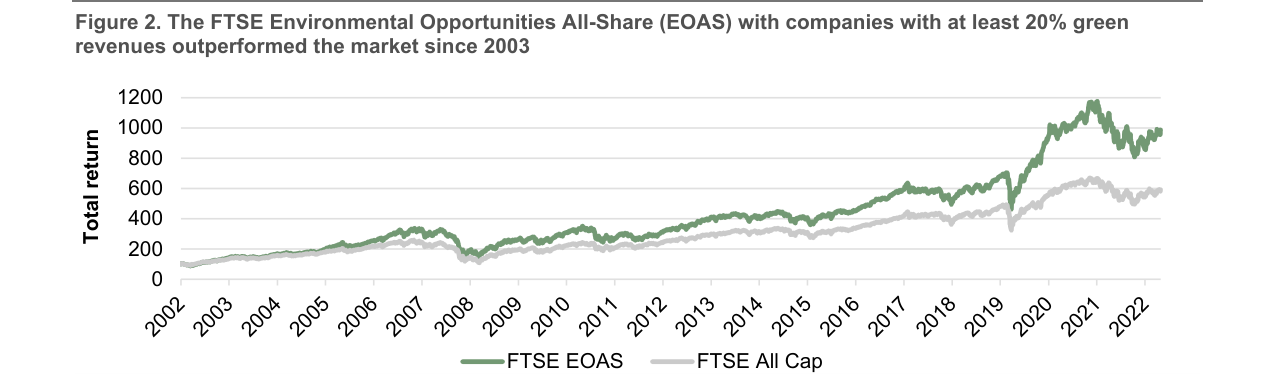
Since 2003, the FTSE EOAS (companies with at least 20% green revenue) has consistently outperformed the FTSE All Cap Index, with total returns rising from approximately 100 to approximately 1000
I. The Binary Deficiency of Current Disclosure Practices
Current asset owner disclosures of green investment exposure suffer from a fundamental limitation—the use of a "yes/no" binary classification. This black-and-white approach primarily identifies pure-play green companies but fails to capture the complexity of business models. For example, a traditional energy company may also operate a renewable energy division, yet it is still labeled as "non-green." This binary classification also overlooks corporate transition progress: fossil fuel companies developing climate solutions business lines (even if currently small in scale) are uniformly classified as non-green.
Key Data Point: An analysis of annual reports from 48 asset owners (including pension funds, sovereign wealth funds, and endowments in North America, Europe, the Middle East, and Asia-Pacific) by GIC reveals that the green metrics used by these institutions are highly fragmented and lack a unified framework. Specific metrics include:
- Renewable energy generation (GWh) or installed capacity (GW)
- Emissions avoided from sustainable energy investments (mtCO₂)
- Proportion of green assets in private equity investments
- Proportion of green assets in real estate investments
- Area or number of assets with green building certifications
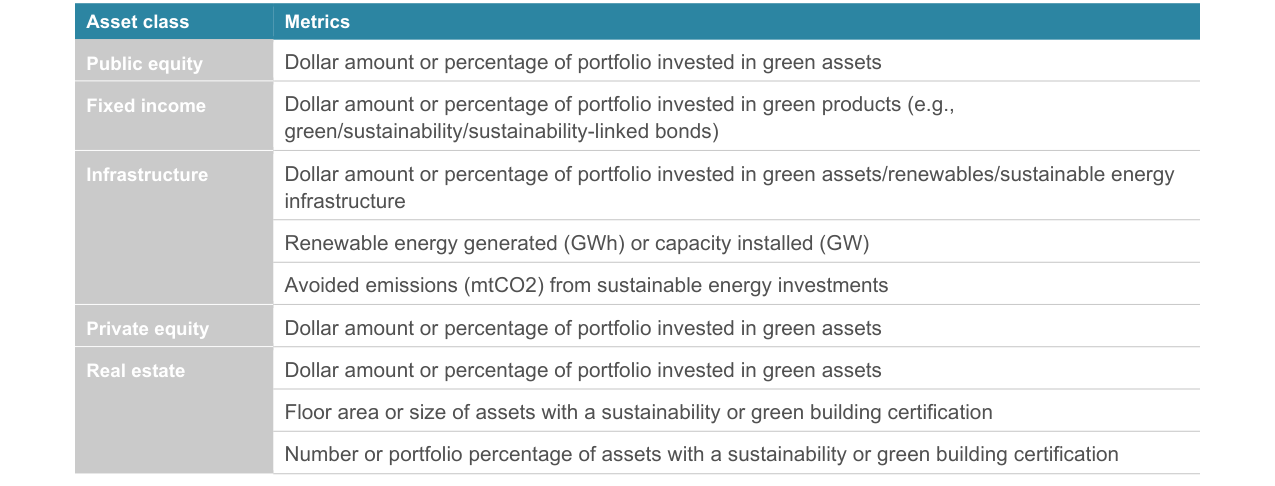
Lists common metrics used to measure climate solutions exposure across different asset classes (equities, fixed income, infrastructure, etc.)
While these metrics are useful for specific sectors or asset classes, they lack comparability, making it difficult for investors to conduct performance comparisons across asset classes and aggregate at the portfolio level.
II. Comparative Analysis of Four Mainstream Climate Solutions Metrics
| Metric | Data Availability | Comparability | Financial Materiality | Current Exposure Indication | Future Direction Indication |
|---|---|---|---|---|---|
| Green Revenue | High (companies disclose revenue per accounting standards) | High (structured data, segmented by business line) | High (directly reflects the commercial value of green products/services) | High (directly shows sales of commercialized green products/services) | Medium (can infer current growth rates but does not directly reflect future strategy) |
| Green Capital Expenditure | Low (companies rarely provide segmented data) | Low (non-uniform reporting standards) | High (shows financial commitment to green products/services) | Low (provides limited information on the greenness of the current business model) | High (shows investment commitment to climate solutions) |
| Green Patents | Medium (accessible via databases like PATSTAT) | Low (patenting behavior varies significantly across companies, industries, and regions) | Low (patent count alone does not reflect R&D importance or potential impact) | Low (only reflects patented innovations; not all climate solutions require patents) | High (shows long-term innovation direction) |
| Avoided Emissions | Low (lack of disclosure guidelines and standards) | Low (no consensus on baselines, boundaries, or attribution methods) | Medium (can complement carbon footprint metrics, showing environmental benefits) | Medium (shows the existence and impact scale of climate solutions) | Medium (implies the value proposition of customer emission reduction cost savings) |
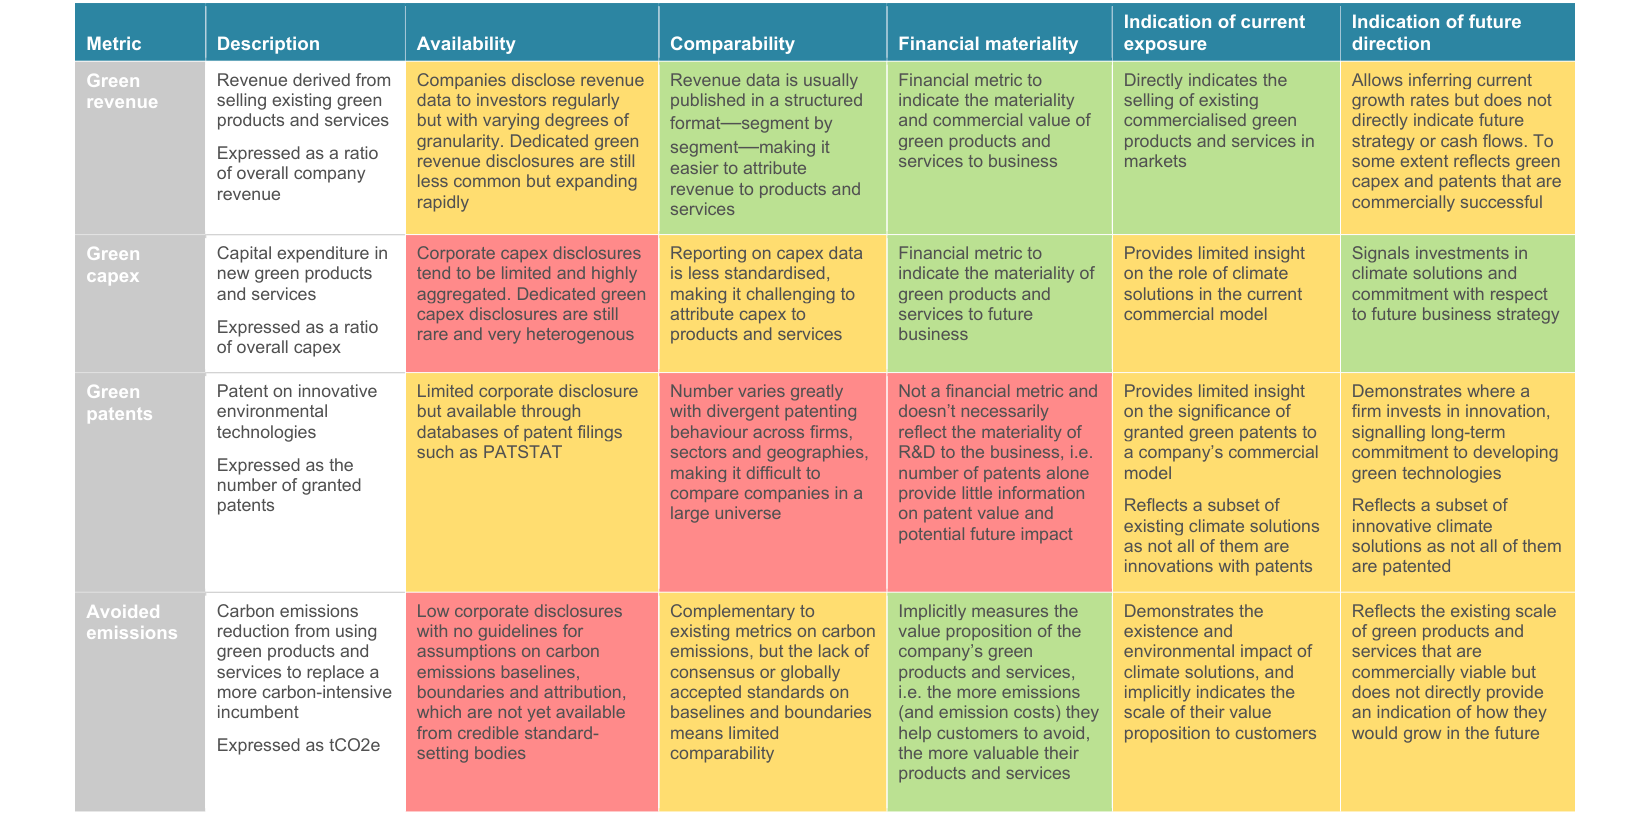
Compares the performance of green revenue, green capital expenditure, green patents, and avoided emissions across dimensions such as availability, comparability, and financial materiality
III. In-Depth Analysis of Each Metric's Limitations
Green Revenue's limitation lies in its focus on currently commercialized climate solutions, potentially missing early-stage green activities. For example, a company may be developing breakthrough carbon capture technology but has not yet generated revenue; the green revenue metric cannot capture its potential.
Green Capital Expenditure, while indicating a company's direction, is limited by the fact that companies rarely provide segmented capital expenditure data. According to a report by the EU TEG on Sustainable Finance (2020), the non-uniform reporting standards for capital expenditure data make cross-company comparisons extremely difficult.
Green Patents have more significant limitations: not all climate solutions require innovation, not all climate inventions necessarily apply for patents (OECD, 2015), and not all patented technologies are actually implemented. Research by Kruse et al. (2020) shows that patent count alone provides limited information on patent value or potential environmental impact.
Avoided Emissions, while integrable with existing carbon footprint metrics, suffers from a lack of methodological consensus. Russell (2018) notes that the absence of globally recognized standards for baseline setting, boundary definition, and attribution methods severely limits data comparability.
IV. Rationale for Green Revenue as the Preferred Metric
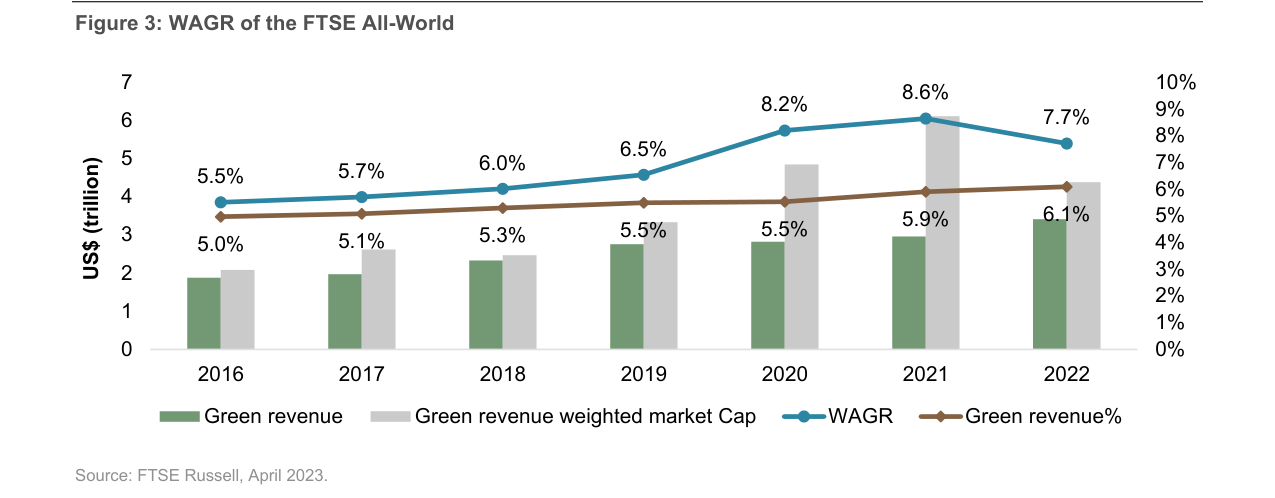
The WAGR of the FTSE All-World grew from 5.5% in 2016 to 8.6% in 2021, then declined to 7.7% in 2022, while total green revenue showed steady growth
Among the four metrics, green revenue is selected as the core metric for subsequent analysis due to the following advantages:
1. Ease of Interpretation: Directly linked to company cash flows and real-world environmental impact
2. High Data Availability: Companies disclose revenue data per accounting standards, and green revenue disclosure is rapidly expanding
3. Strong Estimability: Even if companies do not specifically disclose green revenue, it can be estimated through business line segmentation
4. Direct Financial Materiality: Reflects the true contribution of green products/services to a company's business model
Key Data Point: The EU Taxonomy Regulation already requires companies to report green revenue and green capital expenditure from sustainable economic activities, providing regulatory impetus for standardized disclosure.
V. Comprehensive Application Recommendations
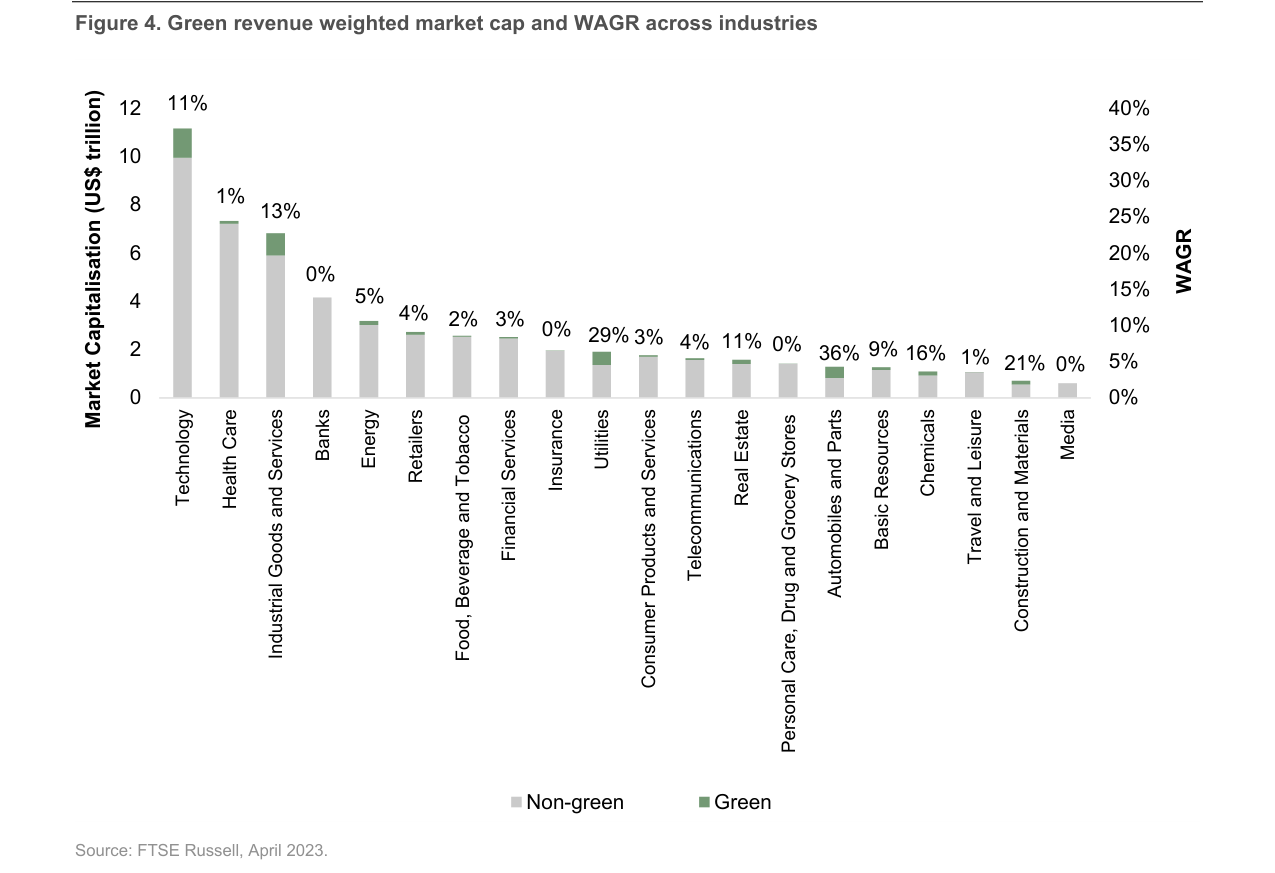
The automotive industry has the highest WAGR at 36%, utilities at 29%, while technology and healthcare have the largest green revenue-weighted market caps (approximately $11 trillion and $7 trillion, respectively)
Although green revenue is the most practical metric currently, the combined use of all four metrics provides a more comprehensive perspective:
- Green Revenue: Reflects current commercial success
- Green Capital Expenditure: Shows future investment direction
- Green Patents: Indicates long-term innovation capability
- Avoided Emissions: Measures actual environmental benefits
As data and methodologies mature, these metrics can together form a comprehensive indicator system for measuring portfolio exposure to climate solutions.
New Arguments and Data: Industry and Regional Heterogeneity of WAGR and Expanded Investment Applications
1. Industry Concentration and Emerging Growth Drivers: Differentiated Drivers of WAGR
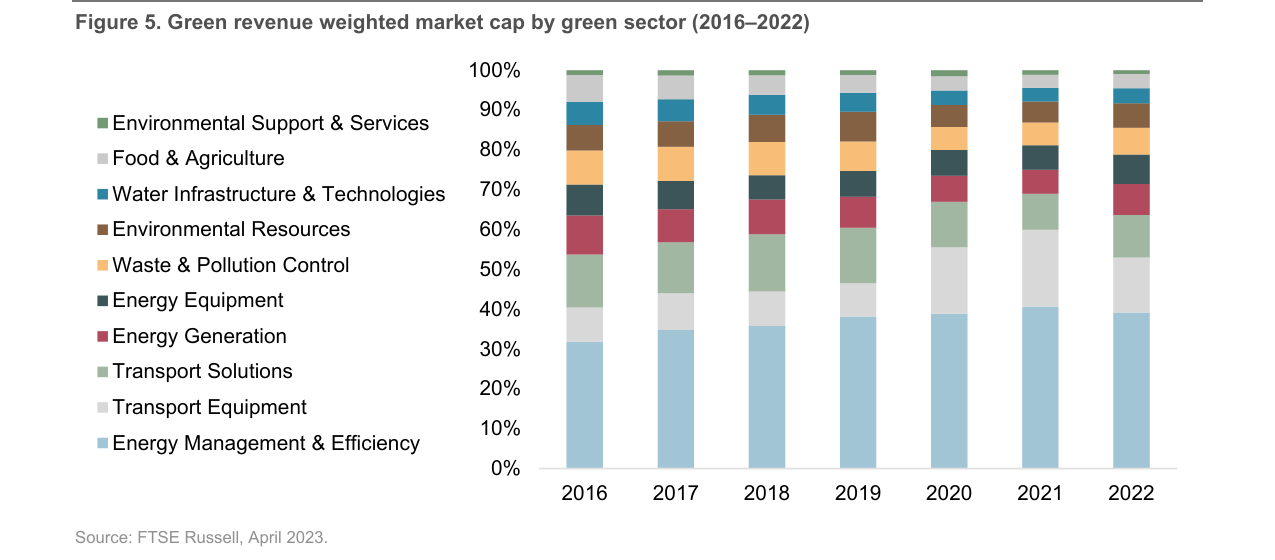
The stacked chart of market cap shares by green sector from 2016 to 2022 shows that categories such as energy management and efficiency, and transport solutions constitute the main parts of the green economy
The industry distribution of WAGR reveals a "two-speed" growth model for climate solutions. Although technology and industrial goods and services dominate green revenue market cap (Figure 4), the automotive industry (36%) and utilities (29%) have significantly higher WAGR than other sectors, primarily driven by demand for electric vehicles (EVs) and renewable energy generation. Notably, the green revenue-weighted market cap of the automotive industry grew by over 350% between 2019 and 2020, closely aligning with the surge in global EV sales (43% year-over-year growth in 2020, per IEA data).
In contrast, the energy management and efficiency sector, while not leading in WAGR rankings, has maintained a share of at least one-third of the green economy since 2016 (Figure 5), demonstrating "invisible" but sustained growth resilience. For example, green revenue from building and industrial energy efficiency measures (e.g., smart grids, LED lighting) has remained stable, indicating that climate solutions do not rely solely on a single technological breakthrough but evolve through multiple pathways.
Comparative Data: Industry WAGR and Green Revenue Market Cap Share
| Industry | Green Revenue-Weighted Market Cap Share (2023) | WAGR (%) | Key Drivers |
|---|---|---|---|
| Automobiles & Components | 11% | 36% | EV penetration rate increase (global EV sales accounted for 14% of new car sales in 2022) |
| Utilities | 13% | 29% | Renewable energy generation share (global renewable energy generation accounted for 29% in 2022) |
| Technology | 40% | 11% | Semiconductor, data center energy efficiency technologies |
| Industrial Goods & Services | 15% | 16% | Industrial energy-saving equipment, carbon capture technologies |
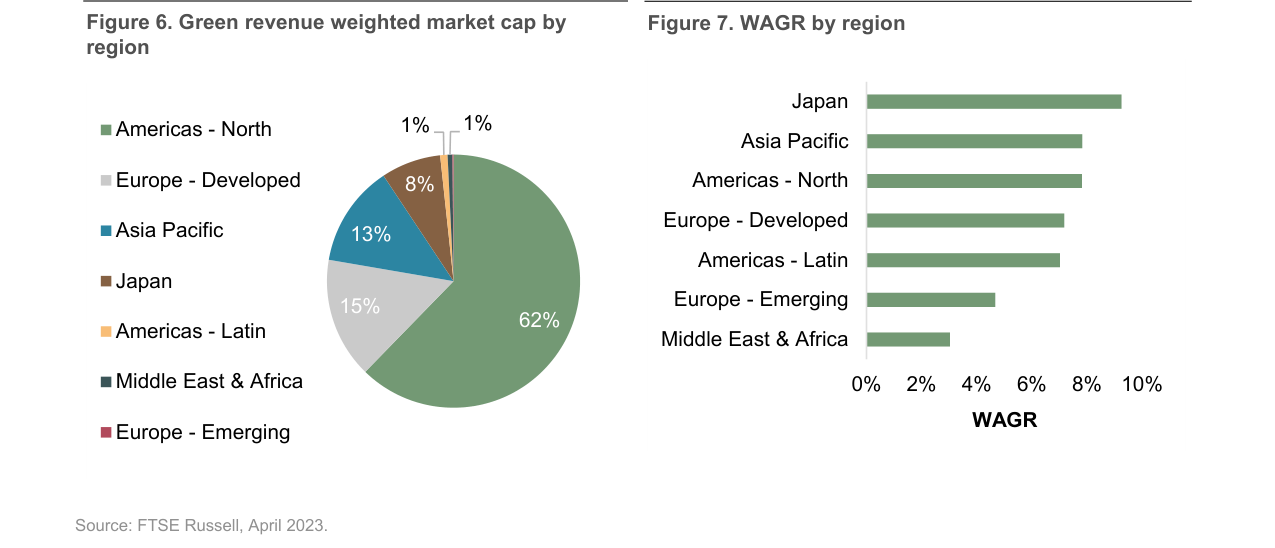
North America accounts for 62% of global green revenue-weighted market cap, Developed Europe 15%, Asia-Pacific 13%, and Japan 8%
Sources: FTSE Russell, April 2023; IEA Global EV Outlook 2023; IRENA Renewable Capacity Statistics 2023
2. Regional Differences: Developed Markets Dominate, but Asia-Pacific and Japan Have Higher "Green Density"
From a regional perspective, North America (62%) and Developed Europe (15%) together account for 77% of global green revenue-weighted market cap, closely tied to their large capital markets and early policy support (e.g., EU Green Deal, US Inflation Reduction Act). However, Japan (WAGR 8%) and Asia-Pacific (WAGR 7%) have higher WAGR than North America (6%) and Europe (5%) (Figure 7). This "high green density" phenomenon stems from:
- Japan: The EV transition in the automotive industry (Toyota, Honda, etc.) drives up the green revenue share, despite the overall smaller market cap.
- Asia-Pacific: The semiconductor industry (TSMC, Samsung) contributes a high proportion of green revenue through energy-efficient chips and renewable energy equipment manufacturing.
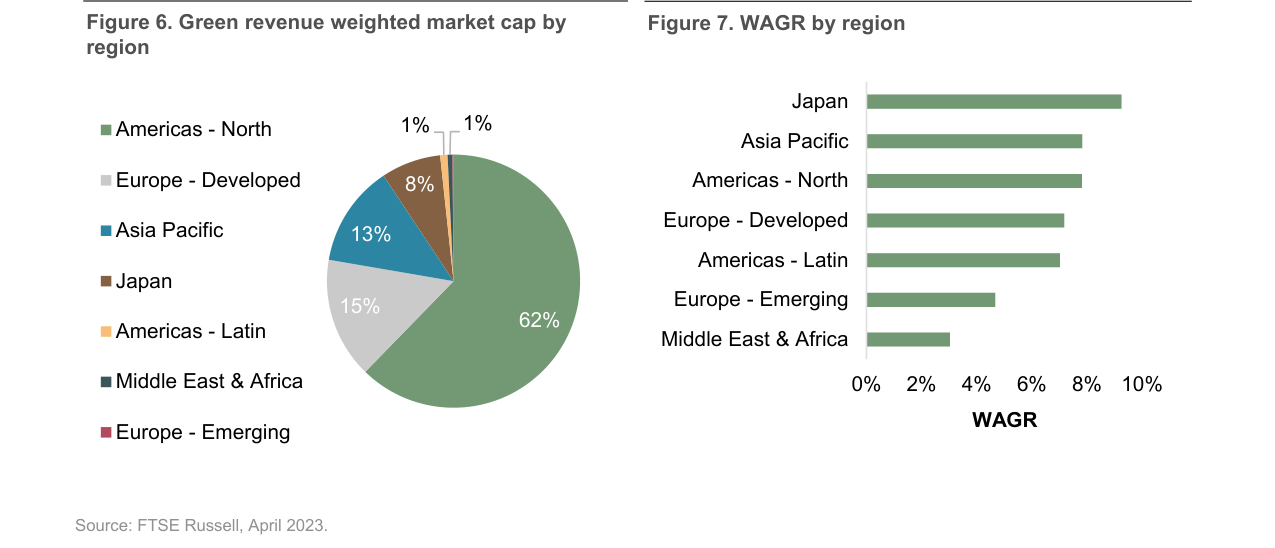
Japan has the highest WAGR at approximately 9%, Asia-Pacific around 8%, North America and Developed Europe around 7%, and the Middle East and Africa the lowest at approximately 3%
Comparative Data: Regional WAGR and Green Revenue Market Cap
| Region | Green Revenue-Weighted Market Cap Share (%) | WAGR (%) | Representative Industries |
|---|---|---|---|
| North America | 62% | 6% | Technology, Renewable Energy |
| Developed Europe | 15% | 5% | Utilities, Automotive |
| Japan | 1% | 8% | Automotive, Electronics |
| Asia-Pacific (ex-Japan) | 13% | 7% | Semiconductors, Manufacturing |
| Latin America | 1% | 4% | Agriculture, Biofuels |
| Emerging Europe | 0.5% | 3% | Wind, Solar |
Source: FTSE Russell, April 2023
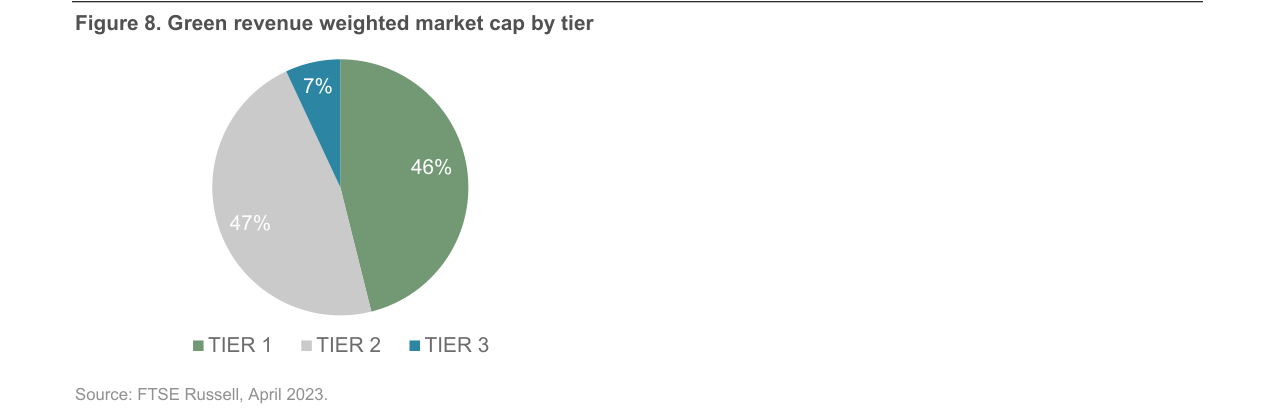
Tier 1 (significant environmental benefits) accounts for 46%, Tier 2 (limited but net positive benefits) for 47%, and Tier 3 (neutral or negative) for only 7%
This difference indicates that WAGR better reflects an economy's "green transition intensity" rather than absolute scale—although Japan and Asia-Pacific have smaller market caps, their industrial structures (high-value-added manufacturing) are naturally coupled with green technologies, leading to stronger performance on the WAGR metric.
3. Expanded Investment Applications of WAGR: From Reporting to Target Setting and Engagement
The modular design of WAGR (decomposable into 10 industries, 64 sub-industries, and 133 micro-industries) elevates it beyond a simple climate reporting tool, making it a core metric for target setting, thematic investing, and corporate engagement:
- Target Setting: The FTSE EU Climate Benchmarks Index Series explicitly requires WAGR to be higher than the benchmark. For example, its Paris-Aligned Benchmark (PAB) requires a WAGR increase of at least 20% relative to the parent index. This provides passive investors with a quantifiable green transition target.
- Thematic Investing: BlackRock's iShares Environmental Infrastructure and Industrials ETF (ticker EFRA) directly uses FTSE Russell green revenue data to screen companies, focusing on energy efficiency, pollution reduction, and resource optimization. As of 2023, the ETF had $1.2 billion in assets under management and a 5-year annualized return of 8.2%, outperforming the MSCI World Index's 6.5% over the same period.
- Corporate Engagement: In its 2021 TCFD report, GPIF (Japan's Government Pension Investment Fund) used WAGR decomposition to identify the green revenue sources of its portfolio (by country, tier, and technology), pinpointing energy management and efficiency as its largest green exposure area (34% of green revenue market cap). This guided dialogues with relevant companies (e.g., requesting improved disclosure of energy-efficient products).
Comparative Data: WAGR vs. Traditional Green Revenue Metrics
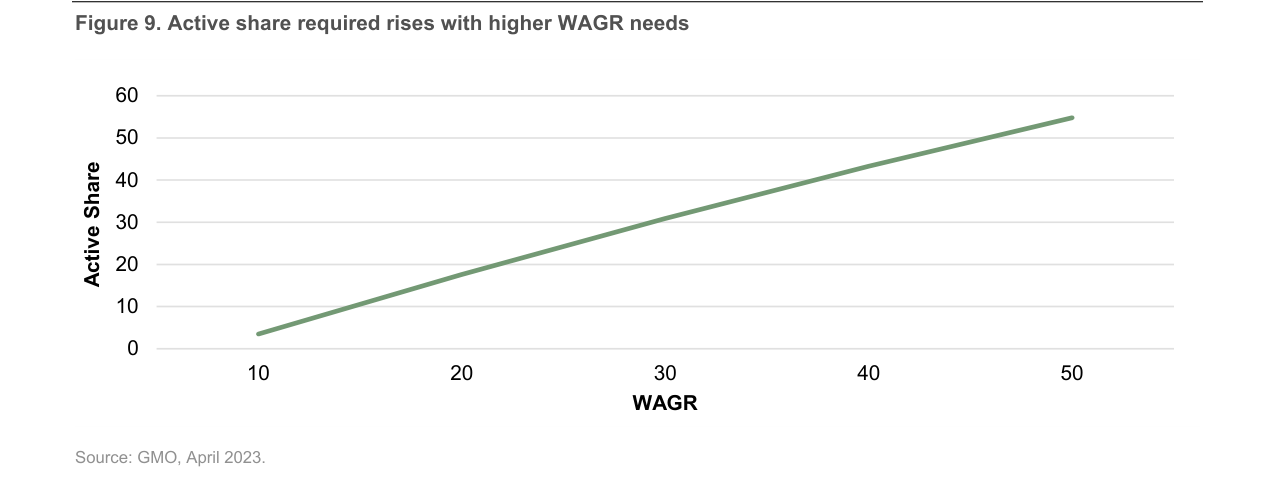
As the target WAGR increases from 10% to 50%, the required active share rises linearly from approximately 5% to approximately 55%
| Metric | Definition | Advantages | Limitations |
|---|---|---|---|
| WAGR | Weighted Average Green Revenue (market-cap weighted) | Aligns with portfolio weights, facilitates benchmark comparison | Affected by market fluctuations (declined in 2022) |
| Unweighted Green Revenue | Simple average green revenue share | Reflects company-level trends, unaffected by market cap | Does not reflect actual portfolio exposure |
| Absolute Green Revenue | Total green revenue of a company | Intuitively measures scale | Ignores company size differences, not comparable across portfolios |
Source: FTSE Russell, April 2023
4. Data Limitations and Future Improvement Directions
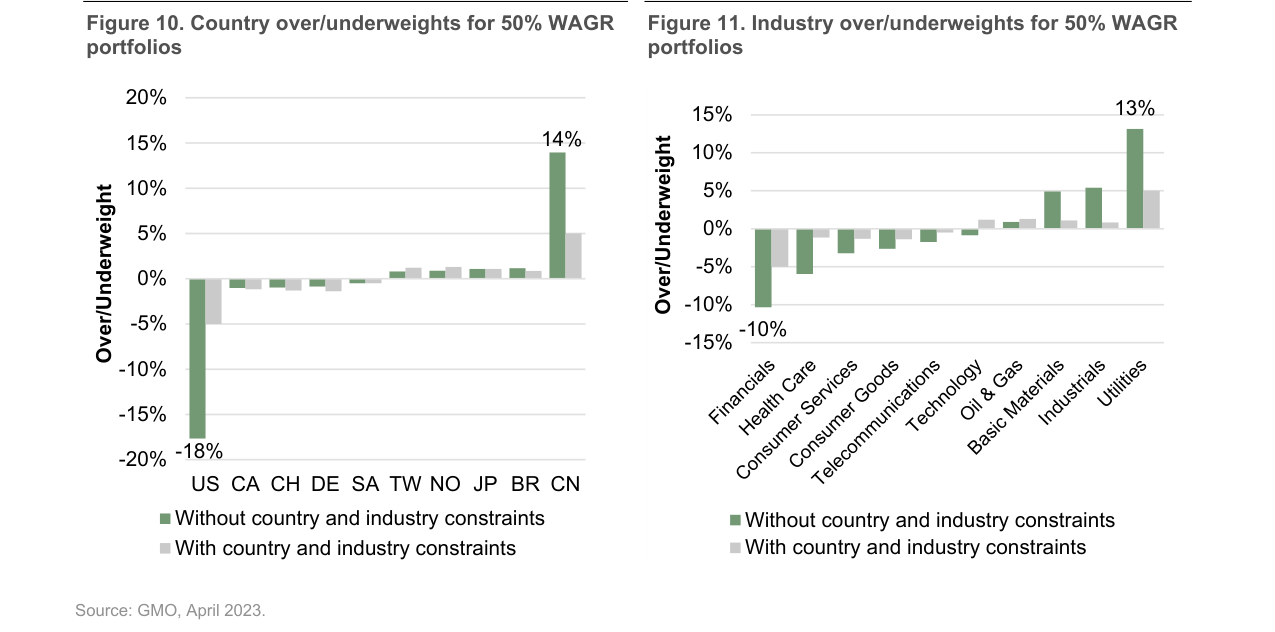
In a 50% WAGR portfolio, China is overweight by 14%, the US is underweight by 18%, and other countries show smaller deviations (within ±1%)
Despite providing a more granular perspective, WAGR's application is still constrained by:
- Disclosure Quality: Green revenue data is still in its early stages, especially in private markets (private equity, infrastructure), where disclosure is severely lacking. For example, only about 15% of global private funds report green revenue data (PRI 2022 survey), leading to biases in multi-asset portfolio WAGR calculations.
- Taxonomy Differences: Different green taxonomies (e.g., EU Taxonomy, China Green Bond Catalogue) have inconsistent definitions of "green," requiring mapping adjustments for cross-regional comparisons. Although FTSE Russell's GRCS covers 133 micro-industries, approximately 20% of green revenue activities cannot be directly mapped to the EU Taxonomy (e.g., the Tier 3 classification controversy over nuclear energy).
- Lack of Forward-Looking Perspective: WAGR reflects currently commercially viable green products and services and cannot directly predict future growth. For instance, the 2022 decline in WAGR (from 8.6% to 8.2%) was primarily driven by valuation corrections in technology stocks, not an actual reduction in green revenue.
5. Key Trends: Resilient Growth and Structural Changes in WAGR
From 2016 to 2022, the WAGR of the FTSE All-World grew from 5.5% to 8.2% (Figure 3), a compound annual growth rate (CAGR) of 5.8%, while the unweighted green revenue only increased from 5.0% to 6.1% (CAGR 2.9%). This difference indicates:
- Market Cap Effect: High-green-revenue companies (e.g., Tesla, CATL) experienced faster market cap growth than low-green-revenue companies, driving WAGR upward.
- Cyclical Resilience: During the 2022 market downturn, WAGR fell by only 0.4 percentage points (from 8.6% to 8.2%), while the MSCI World Index declined by 18%, suggesting that green revenue companies' valuations were relatively resilient.
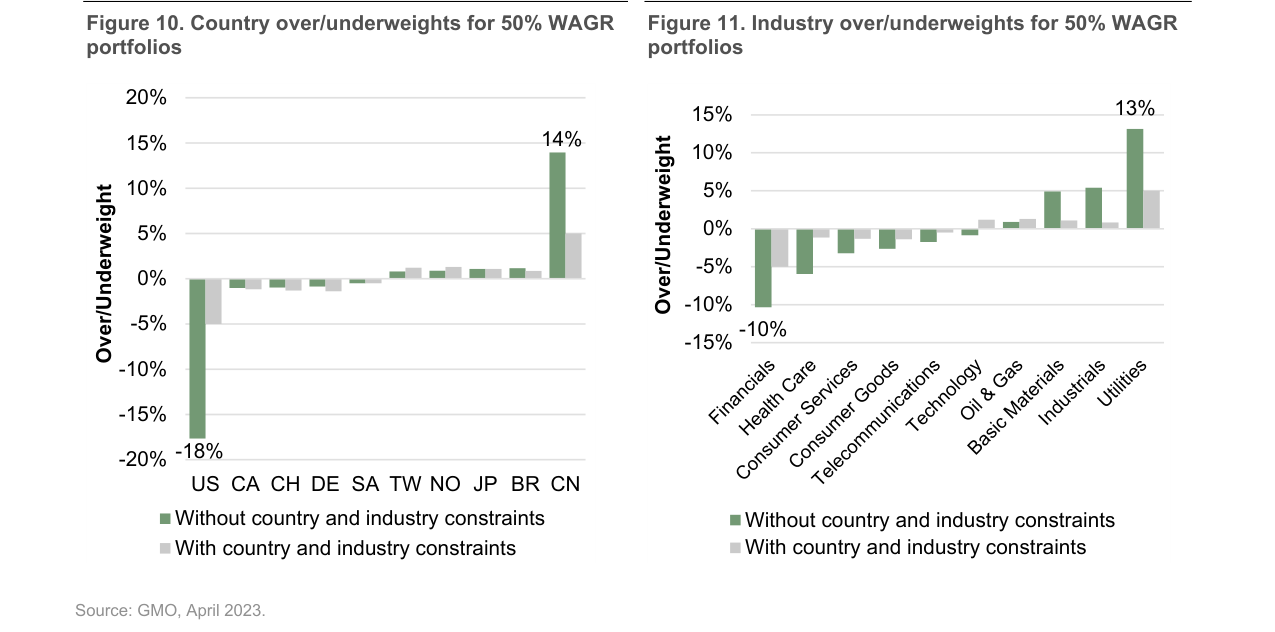
In a 50% WAGR portfolio, utilities are overweight by 13%, basic materials by 5%, financials are underweight by 10%, and healthcare by 7%
Structural Changes: Figure 5 shows that the green revenue share of energy management and efficiency declined from 35% in 2016 to 30% in 2022, while transport equipment (primarily EVs) rose from 12% to 20%, and energy generation (renewable energy) increased from 18% to 22%. This reflects a shift in the green economy from "efficiency first" to a dual-engine model of "clean energy + electrification."
Summary
WAGR, through market-cap weighting and modular decomposition, provides investors with a quantitative tool for measuring climate solutions exposure. Its industry and regional heterogeneity reveals the diverse pathways of the green transition. Despite challenges related to data disclosure and taxonomy coordination, WAGR's applications in reporting, target setting, and thematic investing have already demonstrated potential beyond traditional metrics. In the future, as private market disclosure improves and taxonomies converge, WAGR is expected to become a standard metric for multi-asset portfolio climate risk-opportunity analysis.
New Analysis: Construction Logic and Quantitative Validation of the GMO Horizons Portfolio
1. Quantitative Relationship Between Green Revenue and Active Deviation
GMO used FTSE Russell data to validate the active deviation cost required to achieve a high WAGR (Weighted Average Green Revenue). The data shows that when WAGR increases from 10% to 50%, the active share rises from approximately 15% to over 55% (Figure 9). This non-linear relationship indicates that investors seeking exponential green revenue exposure must accept significant portfolio deviations. For example, a 50% WAGR portfolio requires an overweight of 14% in China and an underweight of 18% in the US, while at the industry level, it requires an overweight of 13% in utilities and an underweight of 10% in financials (Figures 10-11). This concentration risk may create vulnerability to policy changes in a single country or industry.
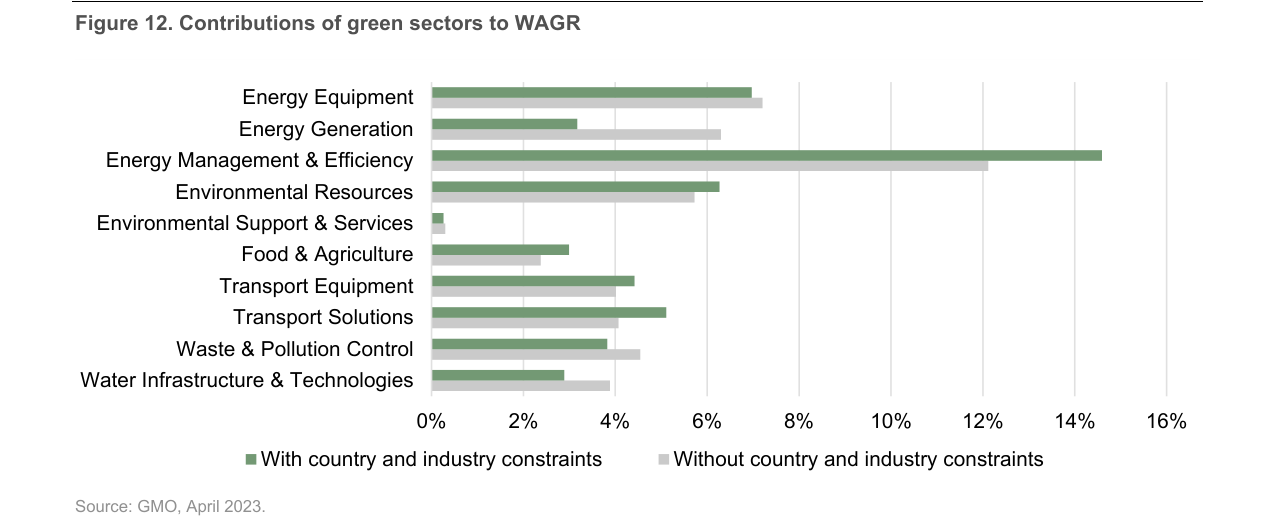
Energy management and efficiency contribute the most to WAGR (approximately 14%), followed by energy equipment (approximately 7%) and transport solutions (approximately 5%)
2. Portfolio Optimization Under Constraints
To mitigate concentration issues, GMO introduced constraints of ±5% over/underweight for countries and industries. The comparison shows that the constrained portfolio still maintains a WAGR of 50%, but the green revenue contribution structure changes only slightly: the contribution from the energy generation sector declines by 3% (from 14% to 11%), while the distribution of other green sectors remains largely unchanged (Figure 12). Additionally, 17 of the top 25 holdings overlap between the constrained and unconstrained portfolios, indicating that the constraints do not significantly sacrifice core green exposure. This result validates that systematic constraints can achieve a more balanced factor exposure while maintaining a high WAGR.
3. Non-Linear Relationship Between Emission Intensity and Green Revenue
GMO's emission intensity analysis (Figure 13) reveals a key contradiction: low-green-revenue companies typically have high emission intensity (e.g., traditional energy companies), but some high-green-revenue companies (e.g., wind turbine manufacturers) may have high direct emissions (Scope 1) during the manufacturing phase, resulting in a full-lifecycle emission intensity that could be higher than the industry average. For example, the manufacturing emissions of a wind turbine account for over 80% of its total emissions over a 30-year lifespan, but its operational carbon emissions per megawatt-hour are only 1% of those from a coal-fired power plant. Therefore, GMO uses the GMO Indirect Emissions Model (covering Scope 2+3) instead of the traditional GHG Protocol classification to avoid misjudging high-green-revenue companies with high upfront emissions.
4. Portfolio-Level ESG and Emissions Management Strategy
The GMO Horizons portfolio balances green revenue and sustainability through a three-tier mechanism:
- ESG Score Screening: Requires the portfolio's ESG score to outperform the benchmark index, prioritizing companies with strong governance structures.
- Controversy Exclusion: Excludes companies that violate international norms such as the UN Global Compact and OECD Guidelines for Multinational Enterprises.
- Emission Intensity Optimization: Minimizes the portfolio's weighted average emission intensity (tCO2e/US$ million market cap) while maintaining the WAGR target.
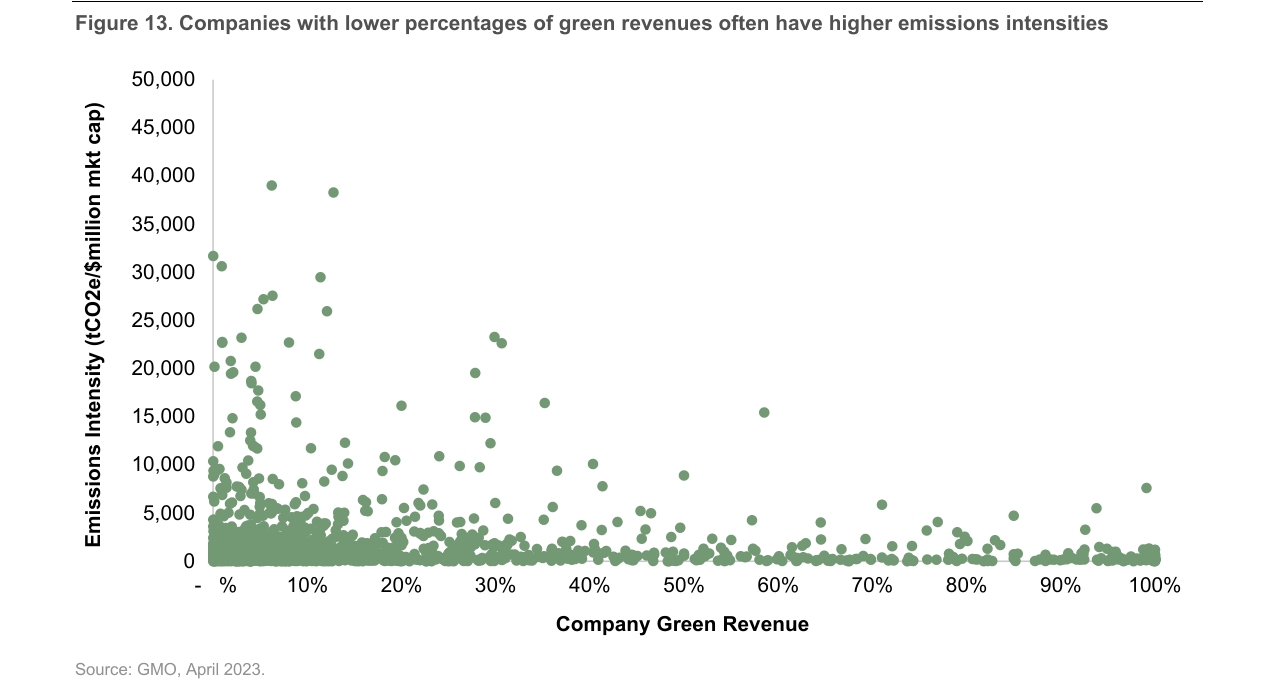
The scatter plot shows a negative correlation between a company's green revenue percentage and emission intensity; companies with low green revenue tend to have higher emission intensity
5. Green Revenue per US$1 Million Investment
Table 3 shows that the GMO Horizons portfolio finances $456,504 in green revenue per US$1 million invested, which is 2.7 times that of the FTSE All-World Index ($170,173) and 11.3 times that of the GMO active management strategy ($40,517). Among these, the energy equipment sector contributes the most ($172,240), accounting for 37.7% of the total, compared to only 9.1% in the benchmark index. This data indicates that systematic indexing strategies have a significant advantage in scaling green capital allocation.
| Green Sector | GMO Horizons Portfolio | GMO Climate Change Strategy | FTSE All-World Index |
|---|---|---|---|
| Energy Equipment | $172,240 | $3,539 | $15,439 |
| Energy Generation | $29,405 | $3,707 | $3,831 |
| Energy Management & Efficiency | $58,466 | $12,104 | $51,812 |
| Environmental Resources | $45,583 | $4,262 | $33,729 |
| Environmental Support & Services | $5,608 | $360 | $820 |
| Food & Agriculture | $25,640 | $1,891 | $15,428 |
| Transport Equipment | $47,303 | $7,071 | $14,974 |
| Transport Solutions | $2,549 | $2,313 | $9,423 |
| Waste & Pollution Control | $32,840 | $3,399 | $13,004 |
| Water Infrastructure & Technology | $35,870 | $1,870 | $11,714 |
| Total | $456,504 | $40,517 | $170,173 |
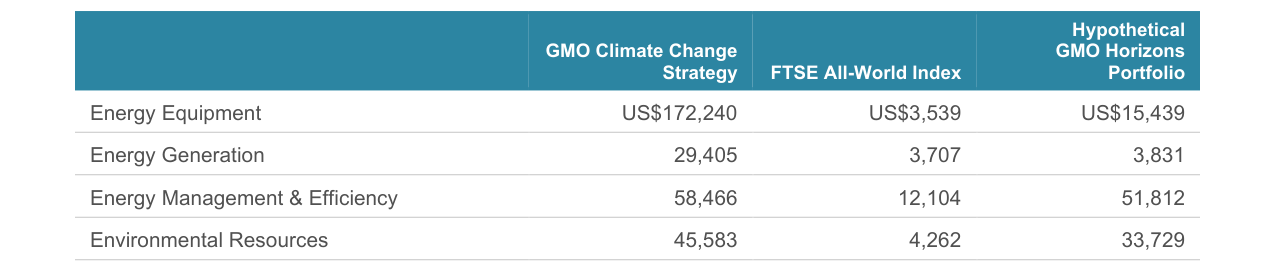
The GMO Climate Change Strategy generates $456,504 in green revenue per US$1 million invested, significantly higher than the FTSE All-World Index's $40,517
6. Key Takeaways
- Active Management vs. Systematic Indexing: Although the GMO Climate Change Strategy achieved a 13.6% annualized return (vs. 8.3% for the benchmark), its green revenue per US$1 million was only $40,517, far below the systematic portfolio. This indicates that high returns do not necessarily correspond to high green revenue exposure; investors must clarify their objectives.
- Feasibility of Constraints: Through country/industry constraints, systematic portfolios can reduce concentration risk without sacrificing WAGR, and the green revenue structure remains stable.
- Complexity of Emissions Management: High-green-revenue companies may be accompanied by high upfront emissions, requiring the use of full value-chain emissions models (e.g., GMO Indirect Emissions Model) to avoid misjudgment.
New Analysis: Thematic Investing, Corporate Engagement, and Trade-offs in WAGR Application
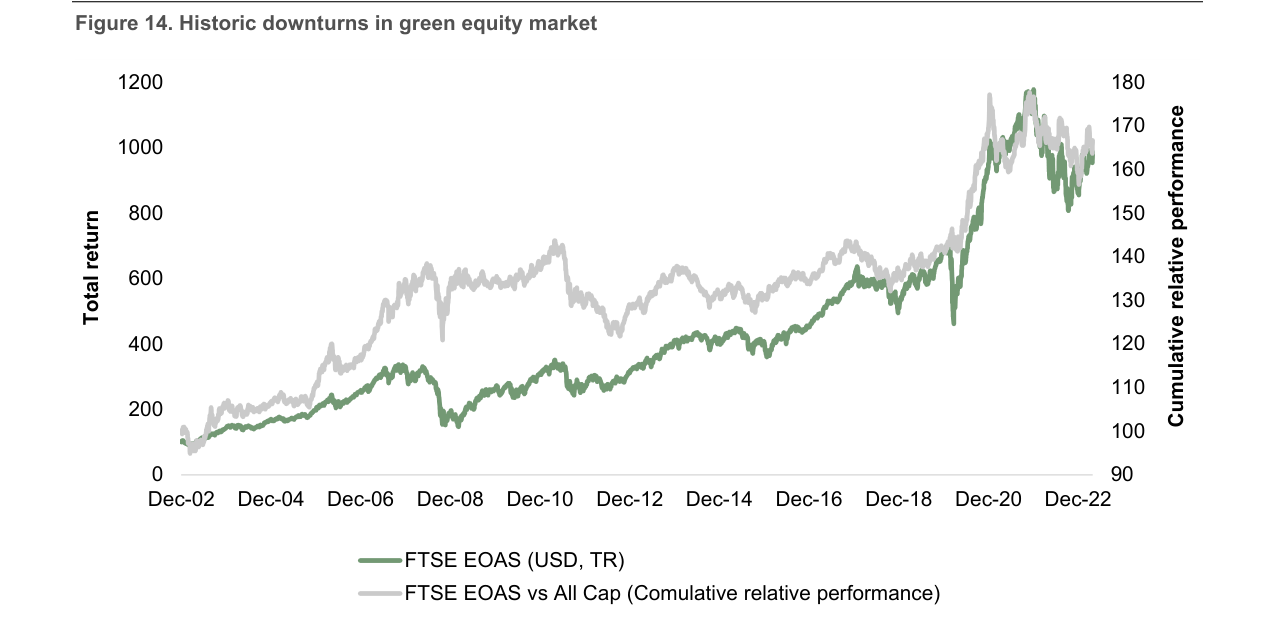
The FTSE EOAS has significantly outperformed the All Cap Index in cumulative returns from 2002 to 2022, but has been more volatile during market downturns
Thematic Investing: The Double-Edged Sword of High Green Revenue Concentration
Thematic investment strategies, by focusing on high-green-revenue companies (e.g., the FTSE Environmental Opportunities Index Series requires at least 20% green revenue), significantly enhance both the environmental impact and financial return potential of a portfolio. Data shows that this index has a WAGR of 46% and a market cap of $8.2 trillion, compared to the benchmark FTSE Global All Cap's WAGR of 8.4% and market cap of $68.6 trillion. However, this high concentration also brings distinct risk characteristics:
- Long-Term Excess Returns: The thematic index outperforms the market over the long term, but performs weaker during downturns (as shown in Figure 14), and carries a significant valuation premium (as seen in the forward P/E ratio comparison in Figure 15).
- Trade-off Between Scale and Active Share: Figure 16 clearly illustrates the inverse relationship between the green revenue threshold and the size of the investable universe—the higher the threshold, the fewer companies are available for investment. Compared to a tilting strategy, achieving the same WAGR level with a selection strategy requires a higher active share (i.e., greater deviation from the benchmark), increasing tracking error and liquidity risk.
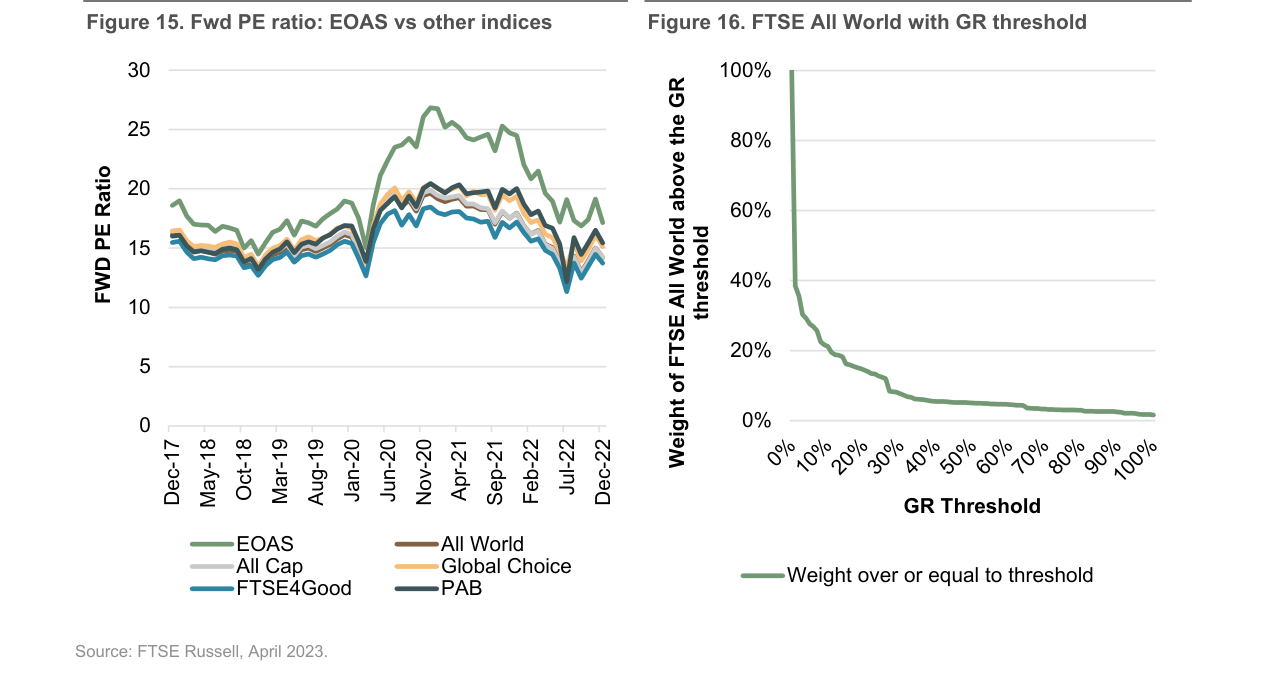
The forward P/E ratio of the EOAS is generally higher than that of the FTSE All World, FTSE4Good, and other indices, peaking at approximately 27x at the end of 2020
| Metric | FTSE Environmental Opportunities Index Series | FTSE Global All Cap (Benchmark) |
|---|---|---|
| WAGR | 46% | 8.4% |
| Market Cap | $8.2 trillion | $68.6 trillion |
| Green Revenue Threshold | ≥20% | No explicit threshold |
| Risk Characteristics | Growth-oriented, low defensiveness, weak during downturns | More balanced, stronger defensiveness |
Corporate Engagement: Green Revenue as a Communication Tool for Decarbonization Strategy
Beyond portfolio construction, green revenue can also be used for corporate engagement to drive companies to disclose climate solutions revenue. For example, Indicator 5 of the Climate Action 100+ Net Zero Company Benchmark requires companies to disclose:
- The proportion of revenue or production from climate solutions;
- A target to increase that proportion.
The assessment results are fed back to companies, encouraging further disclosure and influencing investor actions such as voting during the engagement cycle. This represents an upgrade of green revenue from passive screening to active influence—investors are no longer solely focused on a company's own emission reductions, but on its contribution capacity to the broader economic decarbonization.
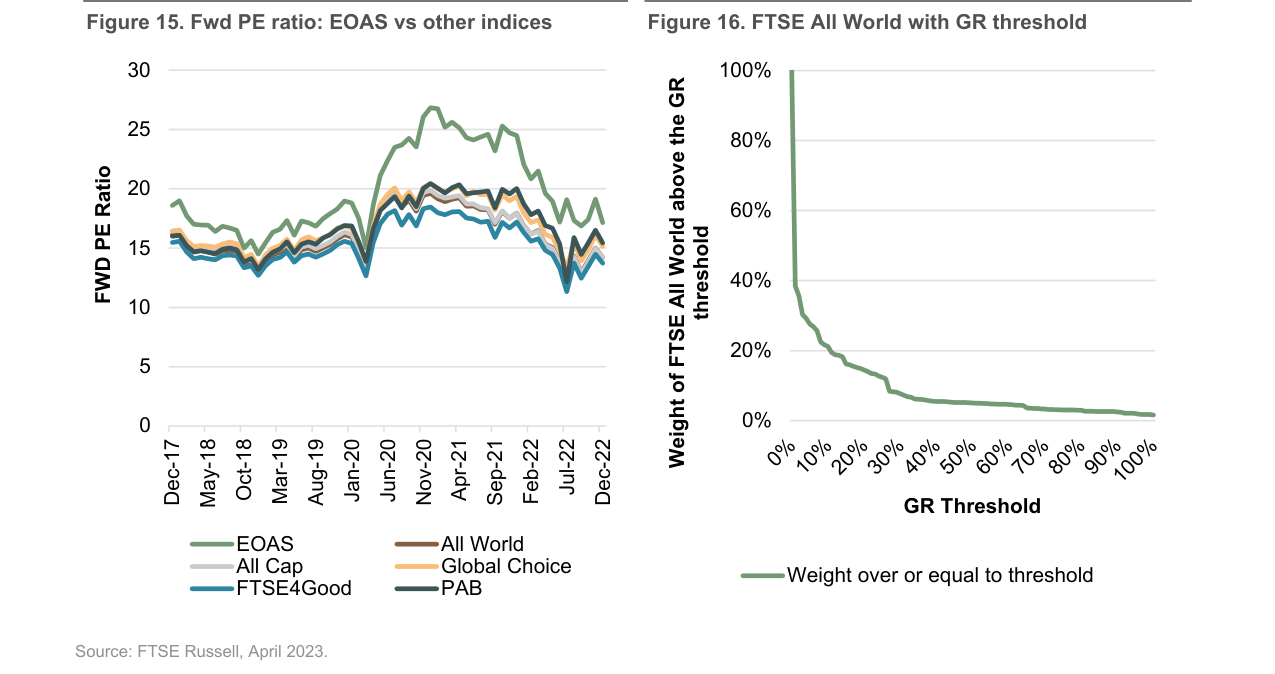
As the green revenue threshold increases from 0% to 100%, the weight of stocks meeting the criteria in the FTSE All World drops sharply from 100% to nearly 0%
Conclusion: WAGR as the Core Tool for Integrating Climate Solutions
The report concludes that in the green economy transition, identifying and measuring climate solutions requires multi-dimensional metrics (green revenue, green capital expenditure, green patents, avoided emissions). Among these, green revenue and WAGR are central due to the following advantages:
- High Data Availability: Easier to obtain for public markets compared to private assets;
- Strong Interpretability: Directly linked to company cash flows;
- Flexible Application: Usable for climate reporting, target setting, thematic investing, and corporate engagement.
As data and methodologies for WAGR and other green metrics continue to mature, they will together form a comprehensive indicator system for measuring portfolio exposure to climate solutions. Currently, WAGR already provides investors with a practical tool for integrating green opportunities within the constraints of limited data.
Conclusion
This continuation section not only serves as a legal protection tool but also reveals the mature practices of the index industry in data responsibility, regulatory compliance, and risk disclosure. Its multi-layered nested liability structure, dual disclaimer mechanism for forward-looking statements, legal risk disclosure for back-tested data, and multi-entity licensing model all reflect the legal complexity faced by financial index providers in global operations. For investors, understanding these statements helps identify potential risks in index products (e.g., data source reliability, back-testing biases, regulatory compliance differences), thereby enabling more prudent investment decisions.