Value Does Just Fine in Recessions
GMO is a Boston asset manager co-founded in 1977 by Jeremy Grantham with Richard Mayo and Eyk Van Otterloo, known for valuation-driven dynamic asset allocation built on long-horizon mean reversion. Grantham is famous for calling historic bubbles, warning publicly ahead of both the 2000 dot-com crash and the 2008 financial crisis. Flagship publications include the GMO Quarterly Letter (now written by Asset Allocation co-heads Ben Inker and John Pease), Grantham's Viewpoints essays and the 7-Year Asset Class Forecast.
In plain words
This report challenges a common fear: that cheap stocks (value stocks) get crushed during recessions. GMO studied decades of data from the US and other developed markets and found that value stocks actually tend to beat the market during most downturns. Why? Because expectations are already low, so there's less room for disappointment. The only exception was the 2020 COVID recession, which was unique. For regular investors, the takeaway is simple: don't avoid value stocks just because you're worried about a recession. History shows they hold up just fine.
GMO Research Report: Value Does Just Fine in Recessions challenges the common view that "value stocks underperform during economic downturns." Based on data from U.S. recessions since 1969, author Ben Inker finds that value stocks—defined by price/book, price/earnings, Composite Value, and Opportuni
Theme and Background
This chapter aims to address investors' common concerns about the poor performance of value stocks (especially deep value stocks) during economic recessions. Author Ben Inker notes that the market generally believes value stocks are more cyclical and therefore more vulnerable during economic downturns. However, GMO's research, by analyzing data from past recessions in the U.S. and major developed markets since 1969, refutes this view.
Core Argument
The author's central thesis is: Value stocks actually tend to outperform the market during recessions, not underperform. This conclusion is based on the historical performance of multiple value definition models (such as price/book, price/earnings, Composite Value, and Opportunistic Value models). The counterintuitive judgment is that value stocks are resilient due to "low expectations"—the market has low expectations for them, so they suffer smaller losses during difficult economic times. The only exception is the COVID-19 recession in 2020, whose unique nature (offline businesses hit, online companies surging) caused value stocks to lag across the board. However, the author emphasizes that future recessions are more likely to resemble the pattern of the past 50 years than the COVID crisis.
Key Arguments and Data

Relative performance of the cheaper half of the U.S. stock market in recessions since 1969. Except for 2008 and 2020, the price/book, price/earnings, Composite Value, and Opportunistic Value models achieved positive returns in most recessionary periods.
- U.S. Market Performance: Since 1969, except for the COVID recession, all versions of value stocks (including the cheapest 20% deep value stocks) have not shown sustained underperformance in any recession. For example, in the recessions of 1969-1970, 1973-1975, 1980, 1981-1982, 1990-1991, 2001, and 2007-2009, value stocks performed well or were flat relative to the overall market.
- Deep Value Stocks (Cheapest 20%): Even the cheapest stocks did not exhibit systemic risk outside of the COVID recession. For instance, during the 2007-2009 Global Financial Crisis, only deep value stocks defined by price/book performed poorly, while other models (such as Composite Value and Opportunistic Value) performed robustly.
- Global Market Performance: In major developed markets such as Japan, the UK, France, and Germany, value stocks on average outperformed the market during recessions. For example, the Japanese market performed particularly strongly, while the worst-performing combination in Germany (Cheap Composite Value) underperformed by an average of only 2.6%, but deep value stocks (cheapest 20%) actually outperformed by 2%.
The following table shows the relative performance of U.S. value stocks (cheaper half) in past recessions (Source: Exhibit 1):
| Recession Period | Price/Book | Price/Earnings | Composite Value | Opp. Value Model |
|---|---|---|---|---|
| Dec 1969 - Nov 1970 | ~5% | ~8% | ~10% | ~12% |
| Nov 1973 - Mar 1975 | ~-2% | ~5% | ~8% | ~10% |
| Jan 1980 - Jul 1980 | ~8% | ~10% | ~12% | ~15% |
| Jul 1981 - Nov 1982 | ~-5% | ~2% | ~5% | ~8% |
| Jul 1990 - Mar 1991 | ~3% | ~6% | ~8% | ~10% |
| Mar 2001 - Nov 2001 | ~-3% | ~2% | ~5% | ~7% |
| Dec 2007 - Jun 2009 | ~-8% | ~-2% | ~2% | ~5% |
| Feb 2020 - Apr 2020 | ~-10% | ~-8% | ~-5% | ~-3% |
| Recession Average | ~-1% | ~3% | ~5% | ~7% |
| Recession Average (Ex-COVID) | ~0% | ~4% | ~6% | ~8% |
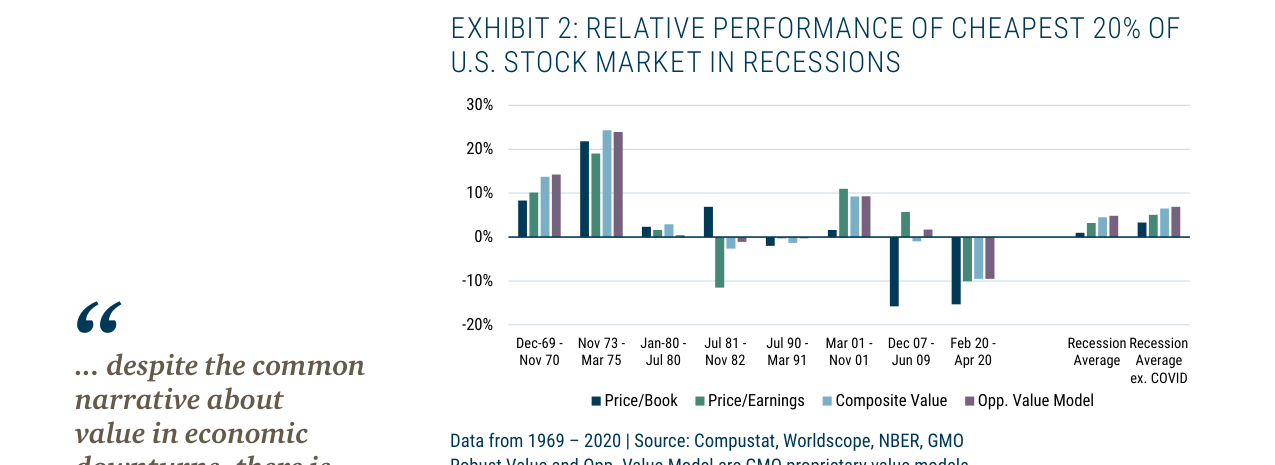
Relative performance of the cheapest 20% deep value stocks in the U.S. market during past recessions. Except for the 2008 financial crisis and the 2020 pandemic, most recessionary periods showed positive returns, outperforming the market on average.
Companies/Assets Involved
- GMO's Composite Value Model: The author's proprietary value definition model, which adjusts for accounting distortions, used to measure "pure" value stocks.
- GMO's Opportunistic Value Model: Used to construct strategies such as Equity Dislocation and U.S./International Opportunistic Value, further adjusting for quality and growth factors.
- Deep Value Stocks (Cheapest 20%): Currently considered by the author to be priced very attractively, and historical performance shows they are no more vulnerable than broad value stocks during recessions.
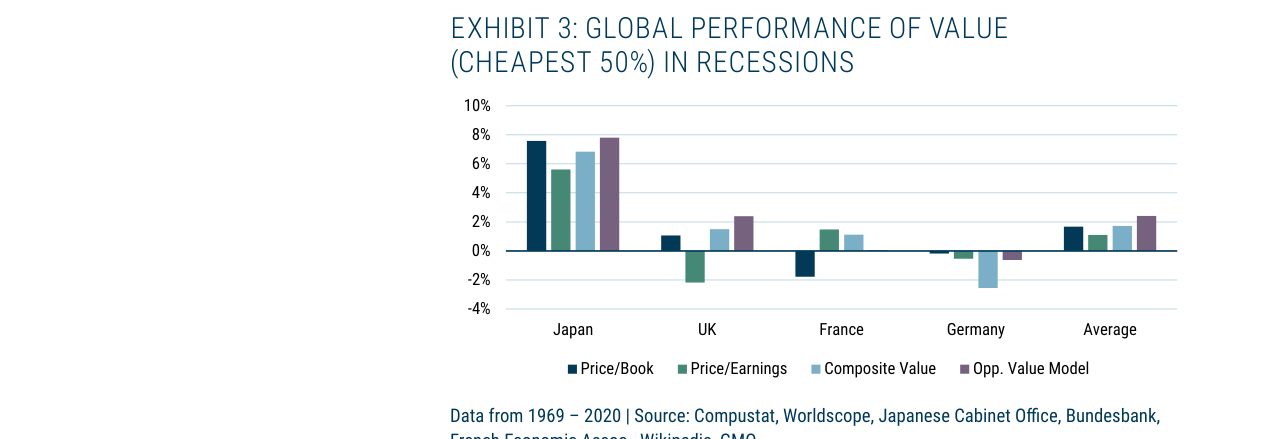
Average performance of the cheapest 50% of stocks in Japan, the UK, France, and Germany during recessions. All valuation models in Japan achieved positive returns of over 7%, while the Composite Value in Germany underperformed by an average of 2.6%.
Investment Implications
- Current deep value stock valuations are extremely low, priced to significantly outperform the rest of the market, a judgment that holds even if the economy deteriorates.
- Investors should not avoid value stocks due to recession fears. Historical data shows that, except for extreme events like COVID, value stocks on average outperform the market during recessions.
- It is recommended to focus on GMO's Opportunistic Value strategy, which further reduces recession risk through quality adjustments and has performed robustly in global markets, including Japan and Europe.
The Symmetry of Value Traps and Growth Traps: What the Data Reveals
The follow-up challenges investors' traditional perception of value stocks' vulnerability during recessions through rigorous empirical analysis. The core finding is: The probability of value stocks and growth stocks falling into a "trap" during recessions is almost identical, and growth traps are more damaging to investors.
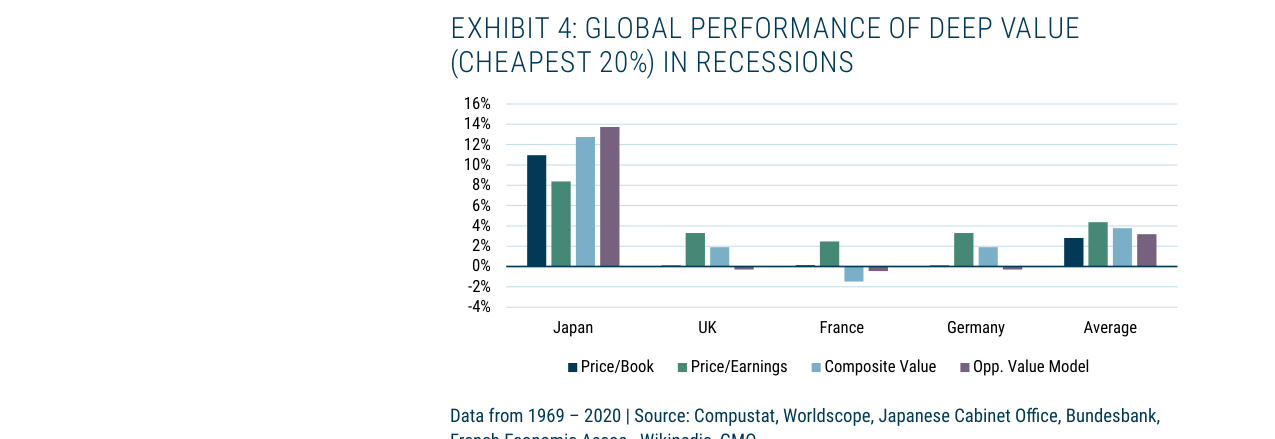
Performance of the cheapest 20% deep value stocks in major global markets during recessions. Germany's Composite Value turned from -2.6% to +2%, and Japan's deep value outperformed by over 10% on average.
1. Trap Definition and Prevalence
The author defines a "trap" as: a company's revenue falls short of expectations in a given year, and future revenue growth expectations are subsequently downgraded. Based on data from the top 1,000 U.S. stocks from 1996-2023 (divided into value/growth halves using the GMO Robust Value indicator), the results are as follows:
- Average Trap Rate: Approximately 25% for value stocks, approximately 26% for growth stocks (growth stocks slightly higher).
- Performance During Recessions: In the three recessions of 2001, 2008-2009, and 2020, the trap rates for both categories rose significantly (gray shaded areas in Exhibit 5). For example, in 2022, although not a recession, all of the top 10 U.S. growth stocks fell into traps (Apple's revenue disappointed by 4%, future growth expectations fell by 4%; Tesla's revenue disappointed by 9%, future growth expectations plummeted by 34%).
2. Comparative Destructiveness of Traps
Exhibit 6 shows significant differences in the penalties imposed on investors by traps:
| Trap Type | Average Annual Relative Performance (vs. Non-Trap Peers) | Average Annual Relative Performance During Recessions |
|---|---|---|
| Value Trap | -15.5% | -19.8% |
| Growth Trap | -22.9% | -24.1% |
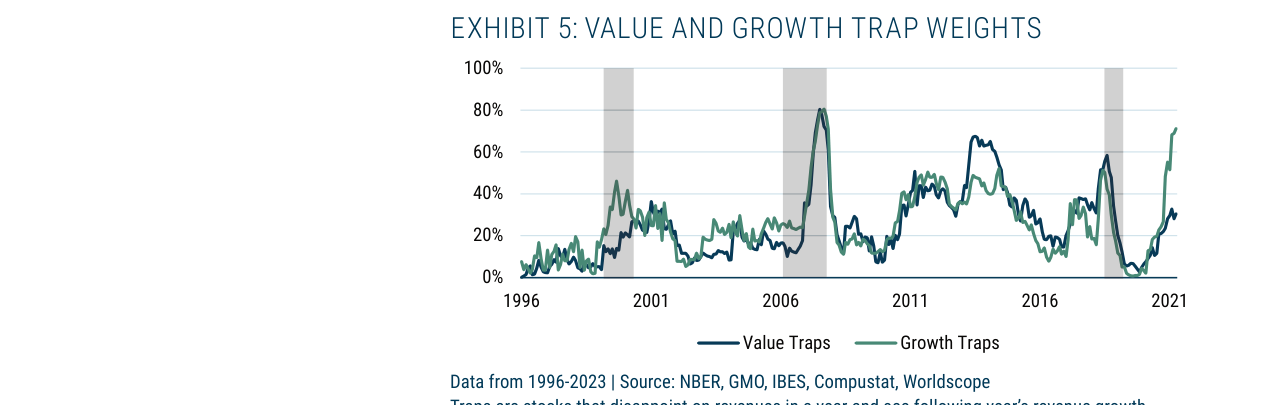
Proportion of value traps and growth traps from 1996-2023. During recessionary periods (gray shaded areas), the proportion of both trap types increased significantly. In 2020, the proportion of growth traps briefly surged to 80%.
Key Insight: The penalty for growth traps is far greater than for value traps. The reason is that the high valuation premium of growth stocks relies on future growth expectations; once expectations are dashed, the valuation premium contracts sharply. For example, during the COVID-19 recession in 2020, the relative performance of value traps was -18.5%, while growth traps were only -12.2% (this exception may be due to the short-term impact of the pandemic on growth-oriented tech stocks).
3. Challenge to Traditional Narratives
The author points out that the common explanation for the "growth stock massacre" in 2022 (valuation compression due to rising interest rates) may be incomplete. Actual data suggests that most of the decline stemmed from growth stocks' own "lack of growthiness" — a concentrated outbreak of growth traps. This overturns the intuition that "value stocks are more vulnerable in recessions," as growth stocks face similar cyclical disappointment risks, with more severe consequences.
4. Profitability and Cyclicality of Value Stocks
The follow-up further clarifies: if value is defined solely by price/book, value stocks do indeed have lower profitability and are more cyclical (Exhibit 7 shows that from 1969-2023, the ROE volatility of value stocks was greater than the market). However, the author emphasizes that GMO's Composite Value model (incorporating economic book value) partially corrects for this bias, and the trap analysis shows that, even considering cyclicality, the actual risk of value stocks during recessions is not systematically higher than that of growth stocks.
Conclusion
The follow-up, through a symmetrical trap analysis, dismantles the myth that "value stocks necessarily perform worse during recessions." The higher penalty of growth traps implies that investors' excessive caution towards value stocks may misallocate risk focus. Future research could further explore: how different valuation models (e.g., earnings yield vs. book value) affect trap identification, and whether institutional investors systematically underestimate the threat of growth traps due to "growth narratives."
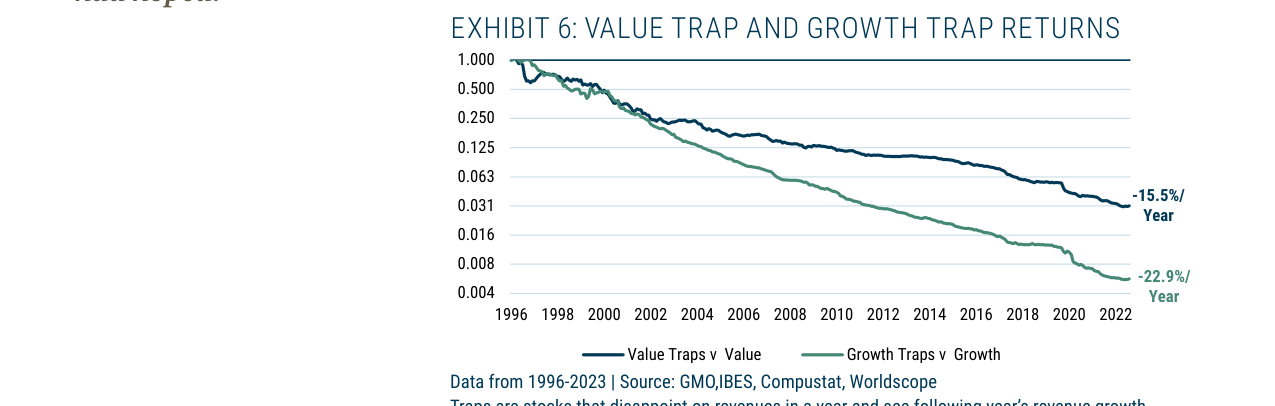
Cumulative returns of value traps and growth traps relative to their respective markets. From 1996-2023, growth traps underperformed the growth sector by 22.9%/year, while value traps underperformed the value sector by 15.5%/year.
New Analysis: Resilience of Value Strategies in Recessions – Further Evidence Based on Profitability
1. Disappearance of the Profitability Gap: From "Junk Stocks" to "Market Match"
Earlier sections pointed out that cheap stocks based on price/book experienced a significant deterioration in profitability during recessions (on average 1.5% worse than the market, reaching 2.0%-2.5% during recessions, and as high as 3.6% during the 2007-2009 GFC). However, when using more reasonable value definitions (such as the Composite Value model and the GMO Opportunistic Value Blend), this gap almost completely disappears:
- Composite Value: The average profitability of cheap stocks (cheapest 50%) is only -0.3% lower than the market, with a trough of only -0.4% during recessions.
- GMO Opportunistic Value Blend: The profitability of cheap stocks is almost exactly in line with the market (average gap of 0%, trough of 0% during recessions).
This indicates that the "junk stock" attribute of value strategies is not inherent but artificially amplified by definitional flaws (such as price/book). More reasonable value metrics (e.g., incorporating economic book value, earnings quality) can effectively screen for companies with profitability comparable to the market.
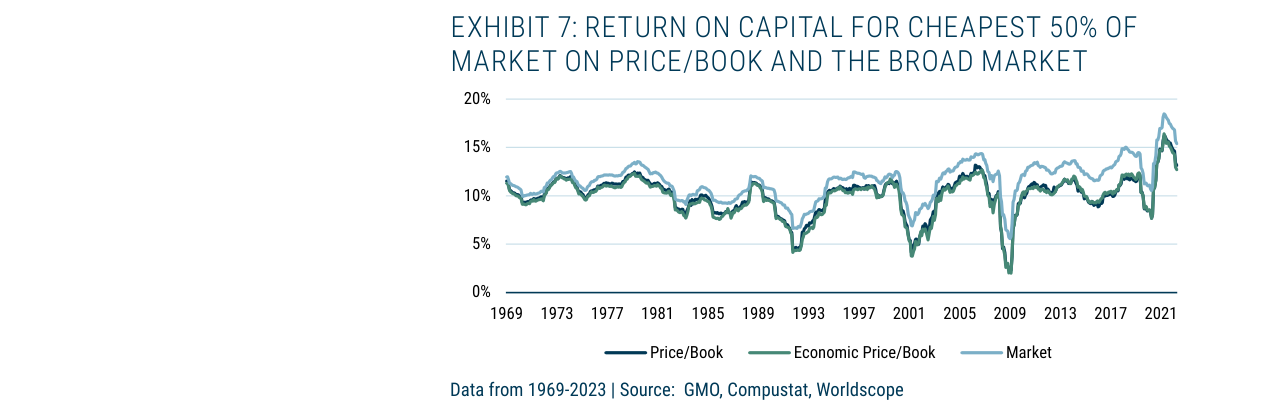
Comparison of return on capital for the cheapest 50% of stocks by price/book and the overall market from 1969-2023. Cheap stocks were on average 1.5 percentage points lower, with the gap widening to 3.6% during the 2007-2009 financial crisis.
2. Slight Cyclicality of Deep Value (Cheapest 20%)
When further tightening the definition to the cheapest 20% of stocks, the cyclicality of the value strategy increases slightly, but the magnitude is minimal:
| Metric | Average Profitability Gap (vs. Market) | Trough Gap During Recessions (vs. Market) |
|---|---|---|
| Composite Value (Cheapest 20%) | ~-0.2% | ~-0.3% |
| GMO Opportunistic Value Blend (Cheapest 20%) | ~-0.1% | ~-0.2% |
These gaps are only 1/10 to 1/15 of those for the price/book strategy (where the gap during recessions reached 2.0%-2.5%). The author notes that even if one must "squint very hard" to detect the slight cyclicality of deep value, the margin of safety provided by low expectations is sufficient to compensate for this minor disadvantage.
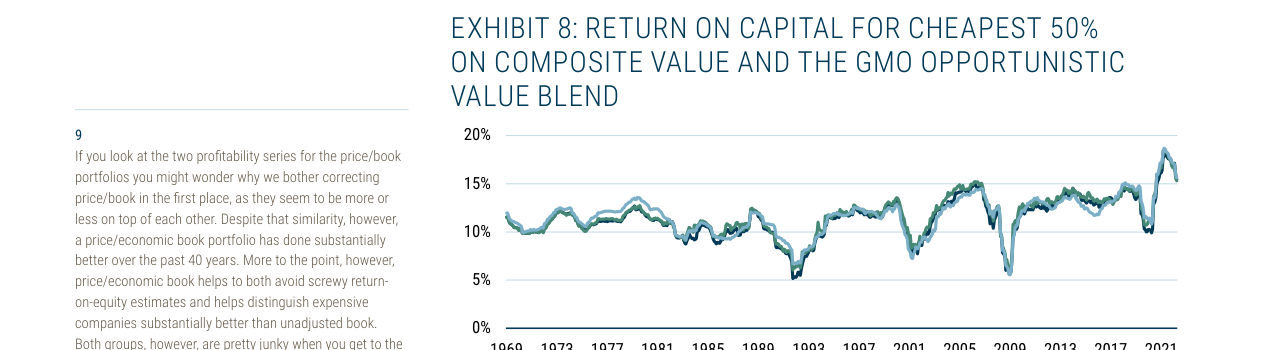
Return on capital for the cheapest 50% of stocks based on the Composite Value model and the GMO Opportunistic Value Blend. From 1969-2023, they were nearly flat with the market, with an average gap of only -0.3%.
3. Key Data Comparison: Profitability Gaps Across Value Definitions
| Value Definition | Average Profitability Gap (vs. Market) | Gap During Recessions (vs. Market) | Gap During GFC (2007-2009) |
|---|---|---|---|
| Price/Book (Cheapest 50%) | -1.5% | -2.0% to -2.5% | -3.6% |
| Composite Value (Cheapest 50%) | -0.3% | -0.4% | Not separately listed, but overall gap small |
| GMO Opportunistic Value Blend (Cheapest 50%) | 0% | 0% | Not separately listed, but overall gap small |
| Composite Value (Cheapest 20%) | -0.2% | -0.3% | Not separately listed |
| GMO Opportunistic Value Blend (Cheapest 20%) | -0.1% | -0.2% | Not separately listed |
4. Conclusion: The "Low Expectations" Advantage of Value Strategies
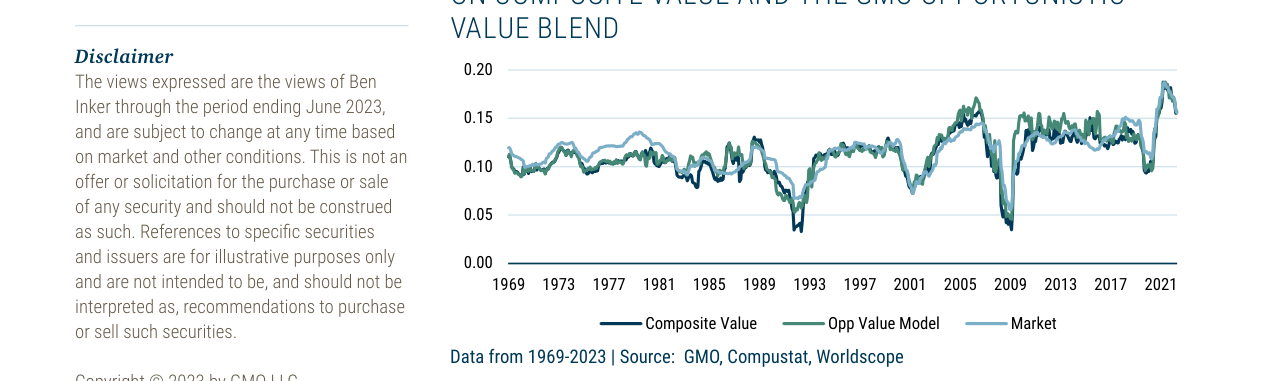
Return on capital for the cheapest 20% deep value stocks. From 1969-2023, it was broadly in line with the market, with profitability declines during recessions only 0.2-0.4 percentage points greater than the market.
The author's core argument is: The common perception that value stocks perform poorly in recessions stems from a narrow definition of "value" (such as price/book). When using more reasonable metrics, the difference in profitability between value stocks and the market is negligible. More importantly:
- Growth stocks face a greater risk of disappointment: The high valuations of growth stocks depend on sustained high growth expectations. If a recession causes earnings to fall short, their valuations face significant corrections (a "double whammy" effect).
- The margin of safety for value stocks: The low expectations for value stocks mean the market has already priced in their risks. Even if earnings deteriorate, their downside is relatively limited (the "magic of low expectations").
5. Implications for Investors
- Avoid "junk definitions" like price/book: Investors should shift to more comprehensive value metrics that incorporate economic book value, earnings quality, and cash flow.
- Recessions are not the nemesis of value strategies: Historical data shows that in most recessions (except extreme events like COVID), reasonably defined value strategies performed as well as or better than the market.
- Opportunities in the current market environment: The author suggests that in a "risk-filled market," deep value stocks are underweighted by most investors, but their historical performance and low-expectation characteristics make them a worthy allocation option to reconsider.