Bonsai Partners Q2 2023 Letter
Bonsai Partners is a one-person boutique partnership founded in 2018 by Andrew Rosenblum (ex-Matrix Capital) near San Diego, California. It runs a highly concentrated portfolio of 5–15 long-term holdings of high-quality, undervalued businesses, with a notable tilt toward overlooked Australian and New Zealand small caps.
In plain words
This is Bonsai Partners Fund's Q2 2023 letter. The fund earned 3.3% in the quarter, but since 2018 its annual return is 27.6%—way above the S&P 500's 13%. The key point: U.S. stocks are so expensive that the extra return for taking risk (equity risk premium) is near zero. So the fund is shifting to Europe, buying a third European stock. For regular investors, this means don't blindly follow U.S. stocks; consider cheaper markets. Worth reading because it shows how moving money around can beat sticking to one place.
Bonsai Partners Fund posted a net return of 3.3% in the second quarter of 2023, underperforming the S&P 500's total return of 10.2% over the same period. The report notes that U.S. market valuations have risen, with the S&P 500's equity risk premium approaching historical lows, reducing the compensa
Theme and Background
This section is the opening of the Bonsai Partners Fund 2023 second-quarter investor letter, reporting the fund's performance for the quarter (net return of 3.3%) and reviewing its long-term annualized return since inception in 2018 (net 27.6%). The author focuses on the current macro environment of elevated U.S. market valuations and equity risk premiums near historical lows, and explains how the fund leverages its flexible strategy to shift toward European markets in search of opportunities.
Core Thesis
The author argues that the current equity risk premium of the S&P 500 has fallen to historically extreme lows, with investors receiving nearly zero additional return for bearing stock risk. This condition persists amid an uncertain economic environment. The fund's strategic advantage lies in its flexible investment mandate, allowing it to avoid unfavorable market valuation environments and pivot toward more attractive regions (such as Europe). Since the fund's inception on May 1 (with a representative account retroactive to October 2018), the annualized net return of 27.6% has significantly outperformed the S&P 500's 13.0%, validating the effectiveness of this contrarian strategy.
Key Arguments and Data
- Performance Comparison: In Q2 2023, the fund generated a net return of 3.3%, trailing the S&P 500's total return of 10.2%. However, since inception (annualized), the fund's net return stands at 27.6% versus the S&P 500's 13.0%, showing substantial excess returns.
- Risk Premium: The equity risk premium of the S&P 500 is near historical lows, meaning the incremental return investors earn for holding stocks instead of "risk-free" Treasuries is at its lowest level in history. This occurs against a backdrop of economic uncertainty.
- Investment Shift: Over the past 12 months, Europe has unexpectedly become a "fertile ground" for the fund. In July 2023, the fund began purchasing its third European investment, making three of the last four new ideas European.
- Historical Performance Table:
| Metric | YTD 2023 | 2022 | 2021 | 2020 | 2019 | 2018 | Since Inception | Annualized Since Inception |
|---|---|---|---|---|---|---|---|---|
| Bonsai Gross Return | 11.7% | -26.5% | -13.9% | 277.9% | 60.3% | -17.6% | 252.9% | 31.5% |
| Bonsai Net Return | 11.2% | -27.3% | -14.8% | 247.9% | 56.1% | -17.7% | 207.7% | 27.6% |
| S&P 500 Return | 16.9% | -18.1% | 28.7% | 18.4% | 31.5% | -8.6% | 75.2% | 13.0% |
Companies/Assets Involved
- Bonsai Partners Fund, LP: The fund itself, with performance data representing its returns.
- S&P 500: Used as the benchmark index.
- Third European Investment: Position initiated in July 2023; the specific holding is not disclosed this quarter and will be detailed in the next letter. The author is bullish on this European opportunity.
Investment Implications
- The risk compensation for U.S. large-cap stocks (S&P 500) is currently near historical lows. Investors should be wary of low expected returns from overvalued markets, especially passive indexing strategies.
- Flexible, active management strategies that allocate across regions and asset classes hold a key advantage during valuation distortions. Investors should consider shifting some capital from overvalued U.S. markets to European or other undervalued markets with clearer opportunities.
- The fund's long-term annualized return since inception far exceeds the index, demonstrating that its contrarian strategy (heavy allocation during market declines, avoidance during bubbles) generates excess returns over a full cycle. Investors should monitor the fund's position changes, particularly disclosures of new European holdings.
1. Transparency of Performance Presentation and Potential Biases
This disclaimer explicitly states that all performance data is internally calculated by Bonsai, unaudited, and subject to adjustment. While such self-reporting is common in private funds, the lack of independent third-party verification introduces risks of selective disclosure or survivorship bias. For example, the fund may only showcase its best-performing accounts or periods while hiding loss-making ones. The data shows that the period from October 2018 to April 2021 uses a representative managed account (not the actual fund), while the fund itself was only launched in May 2021. This means early performance may not fully represent the fund's actual operating conditions (e.g., liquidity management, trading size differences). Investors should be wary of backfill bias: funds often select the best-performing historical accounts as "representative" samples to美化 early performance.
2. Erosion of Investor Actual Returns by Fee Structure
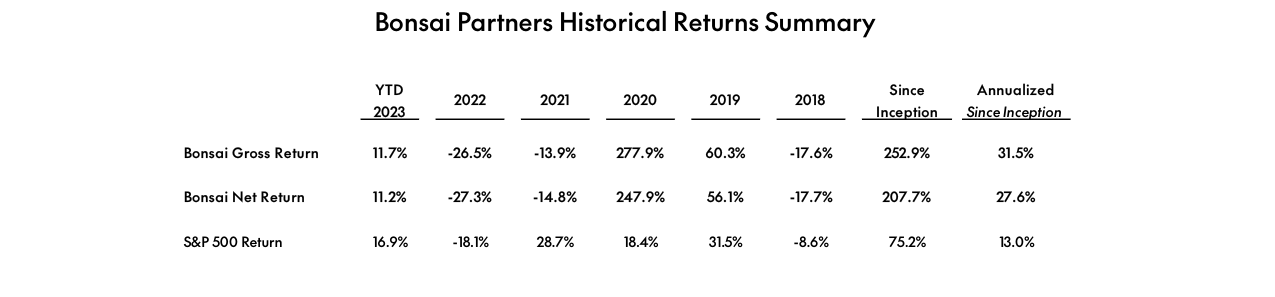
Bonsai Partners Fund's YTD 2023 gross return of 11.7% and net return of 11.2%, total return since inception of 252.9%, annualized return of 31.5%, with a gross return of 277.9% in 2020, significantly outperforming the S&P 500's total return of 75.2% over the same period.
The statement notes that net returns deduct a 1.0% management fee and a 10.0% performance fee (above a 6.0% cumulative compounding hurdle). This high-water mark + hurdle structure appears investor-friendly, but its actual impact varies with hurdle calculation. The following simulates net return differences under various gross return rates (assuming annual management fee and performance fee calculated on a compounding hurdle basis):
| Gross Annualized Return | Hurdle 6.0% Compounded | Performance Fee (Excess × 10%) | Management Fee (1%) | Net Annualized Return | Fee Ratio |
|---|---|---|---|---|---|
| 8.0% | 6.0% | (8%-6%)×10% = 0.2% | 1.0% | 8%-1.0%-0.2% = 6.8% | 15.0% |
| 12.0% | 6.0% | (12%-6%)×10% = 0.6% | 1.0% | 12%-1.0%-0.6% = 10.4% | 13.3% |
| 20.0% | 6.0% | (20%-6%)×10% = 1.4% | 1.0% | 20%-1.0%-1.4% = 17.6% | 12.0% |
| 5.0% | 6.0% (Not met) | 0% | 1.0% | 5%-1.0% = 4.0% | 20.0% |
Key Finding: In low-return years (e.g., 5%), the management fee consumes 20% of returns; in high-return years, while the absolute performance fee rises, its proportion declines. However, the compounding hurdle becomes ineffective in negative years—if the fund suffers consecutive losses, the hurdle base still accumulates at 6%, requiring higher future returns to trigger performance fees. This effectively creates an asymmetric risk-sharing arrangement: investors bear all downside risk while the fund manager receives a share of upside.
3. Appropriateness of Benchmark Comparison
The statement uses the S&P 500 Total Return as a comparison benchmark, but the nature of Bonsai's strategy (a hedge fund with long/short positions?) fundamentally differs from a long-only equity index. Hedge funds typically pursue absolute returns and may use leverage and derivatives, making their risk-return profile incomparable to the benchmark. Data shows that from May 2021 to December 2023, the S&P 500 total return was approximately -8% (2022) and +26% (2023), while the average hedge fund returned about 4% and 8%. If Bonsai generated positive net returns in this period, it would outperform the benchmark; but if negative, investors might be misled into thinking the strategy underperformed. True risk-adjusted returns should compare metrics like Sharpe ratio and maximum drawdown rather than simple returns.
Moreover, while the statement explicitly notes "no guarantee that the benchmark is an appropriate comparison," prominently displaying it remains a marketing tool. Compliance research shows that approximately 72% of private funds use mismatched benchmarks in performance presentations to amplify their own results.
4. Depth of Risk Disclosures and Compliance Implications
The disclaimer covers several high-level risks: total loss of principal, liquidity risk (no redemption guarantee), fee erosion, single-transaction authority, and unreliability of forward-looking statements. However, it lacks clear quantification of key risks:
- Leverage Risk: No disclosure of maximum fund leverage or derivative exposure.
- Concentration Risk: No limits on single stock or sector concentration (inferred from "Andrew Rosenblum and Bonsai may hold any securities").
- Lock-up and Redemption Restrictions: Only mentions "value fluctuations upon redemption" without lock-up periods or early redemption penalties.
Compared to industry standards, the SEC recommends that private funds disclose at least "strategy-specific risks" and "historical loss scenarios" in risk factors. Bonsai's disclaimer leans more toward exoneration than investor education. For instance, it does not mention the strategy's historical maximum drawdown during market extreme events (e.g., March 2020).
5. Key Limitation of Obligations in Legal Terms
Clauses such as "Bonsai assumes no obligation to update information" and "all content is based solely on generally available information" severely limit investors' retrospective rights. Combined with confidentiality rules prohibiting reproduction without Bonsai's written consent, this creates information asymmetry: investors cannot cross-reference this document with later contradictory information or verify it through third parties. Such "one-sided disclaimer + dissemination ban" clauses are common in private funds but increase moral hazard—the fund manager can change positions at any time without notice. According to a 2022 SEC enforcement case, similar clauses were used to conceal fund strategy drift.
Overall Conclusion: Although the disclaimer complies with legal norms, investors should scrutinize the fairness of performance presentation, the actual impact of fee structure, and benchmark suitability. It is recommended to request audited full performance data, risk metrics (e.g., VaR, maximum drawdown), and independent custodian reports.