Why We Are Not Worried About Elevated Profit Margins
GMO is a Boston asset manager co-founded in 1977 by Jeremy Grantham with Richard Mayo and Eyk Van Otterloo, known for valuation-driven dynamic asset allocation built on long-horizon mean reversion. Grantham is famous for calling historic bubbles, warning publicly ahead of both the 2000 dot-com crash and the 2008 financial crisis. Flagship publications include the GMO Quarterly Letter (now written by Asset Allocation co-heads Ben Inker and John Pease), Grantham's Viewpoints essays and the 7-Year Asset Class Forecast.
In plain words
This report explains why high corporate profit margins in the US are unlikely to fall sharply. Many worry that margins are too high and must revert to historical averages, but the authors argue this fear is overblown. The rise in margins comes mainly from a shift in the index toward high-profit companies (like tech), plus lower taxes and interest rates—not from companies squeezing more out of their operations. For ordinary investors, this means don't bet against the market just because margins look high. Some firms like Apple and Amazon actually report lower profits than their true economic value, making their earnings more stable. Worth reading because it uses data to show why margins may stay elevated, helping you avoid a common investing mistake.
GMO Research Report Why We Are Not Worried About High Profit Margins argues that although a U.S. economic recession would temporarily suppress corporate earnings, the market's excessive concern over the S&P 500's net profit margin rising from a historical median of 9% to 15.1% in 2019 is unwarranted
Theme and Background
This section focuses on the market's widespread concern over persistently high profit margins for U.S. corporations. The report argues that while a recession would temporarily suppress earnings, investors' long-term worries about the S&P 500 net profit margin rising from a historical median of 9% to 15.1% in 2019 are overly exaggerated. The author attempts to demonstrate that the core drivers of margin expansion are durable and will not naturally revert to historical averages.
Core Thesis
The author's central investment argument is: The S&P 500 net profit margin will not necessarily decline simply because it is "too high." Counter-intuitive judgments include:
- Margin expansion is primarily driven by changes in the composition of index constituents (mix effect), not by a deterioration in corporate operations themselves, so there is no natural pressure to revert to the historical median.
- If margins were to revert to the median, earnings would fall by 44%, but the author believes such concerns are unfounded.
- High-quality companies (such as those in the Quality Strategy) can recover and maintain their original profitability levels after the pandemic.
Key Arguments and Data
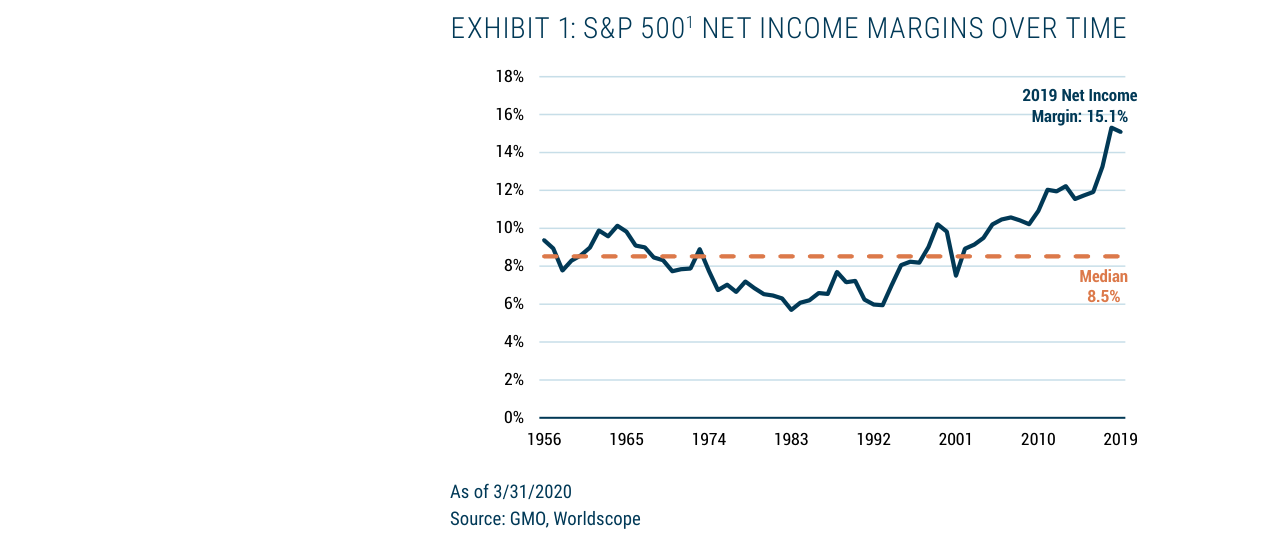
The S&P 500 net profit margin rose from approximately 8% in 1956 to 15.1% in 2019, significantly above the historical median of 8.5%
The report decomposes the drivers of net profit margin expansion, providing the following data support:
1. Decomposition of Net Profit Margin Expansion (1989-2019):
- Net profit margin in 1989: 7.2%
- Net profit margin in 2019: 15.1%
- Sources of expansion:
- EBIT margin (mix and composition effect): +4.2 percentage points
- EBIT margin (same-store analysis, i.e., company-specific improvement): +1.5 percentage points
- Lower tax rates: +1.2 percentage points
- Lower interest expense: +1.0 percentage points
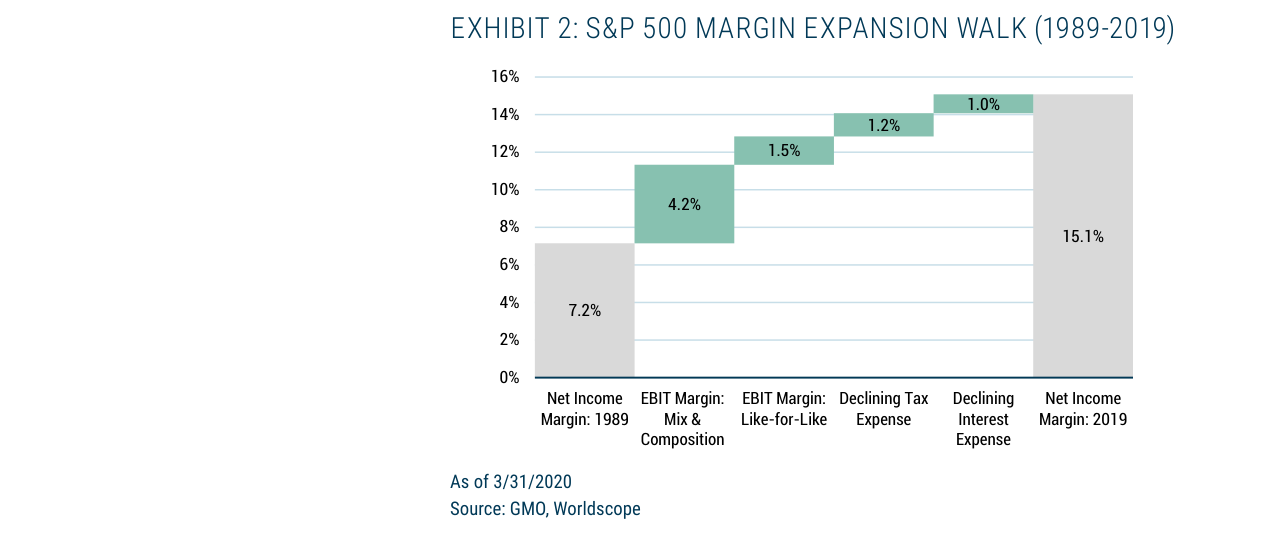
The S&P 500 net profit margin expanded from 7.2% in 1989 to 15.1% in 2019. The EBIT margin (mix and composition effect) contributed 4.2 percentage points, lower taxes contributed 1.5 percentage points, and lower interest expense contributed 1.2 percentage points
2. Same-Store Analysis Results:
- A "same-store" analysis of companies that have been in the index for over 10 years found that only 1.5 percentage points of margin expansion came from company-specific operational improvements.
- The remaining majority of the expansion came from an increased weight of high-margin companies (e.g., the technology sector) in the index and the fact that newly added companies had higher margins than the index average.
3. Historical Comparison:
- Average EBIT margin 1980-1989: 12.9%
- EBIT margin in 2019: 20.9%
- However, the same-store EBIT margin index (1989 = 1.0) only rose to about 1.15 in 2019, indicating limited margin expansion for the median company itself.
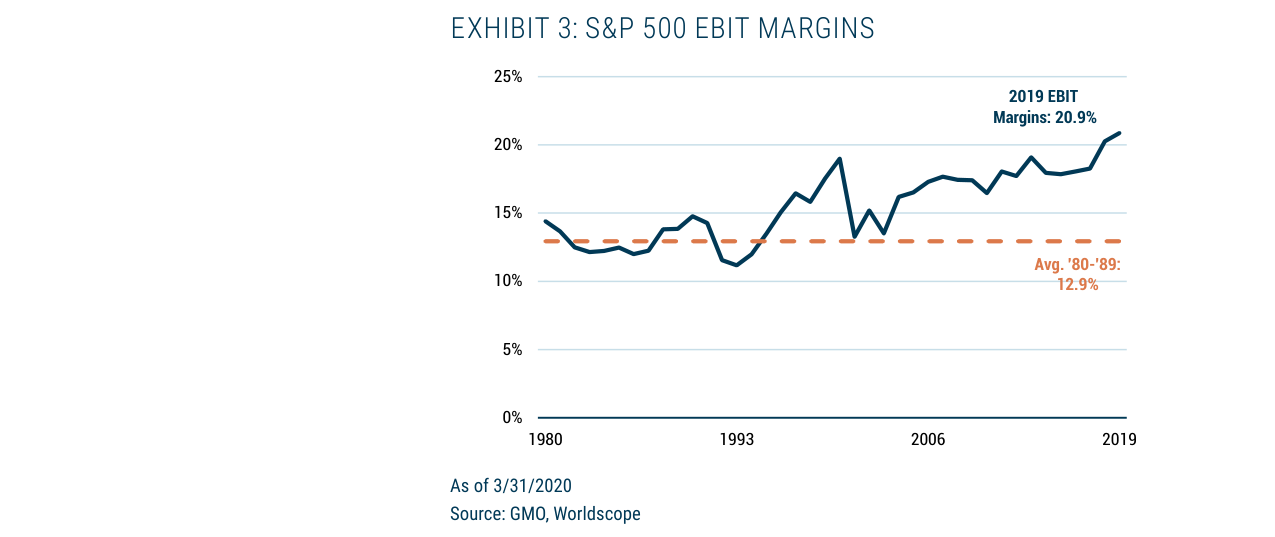
The S&P 500 EBIT margin rose from approximately 13% in the 1980s to 20.9% in 2019, higher than the 1980-1989 average of 12.9%
4. Tax and Interest Contributions:
- Lower effective tax rates contributed 1.2 percentage points, and lower interest rates reducing interest expense contributed 1.0 percentage points. The author believes these two factors are unlikely to reverse easily.
Companies/Assets Involved
The report mentions the following companies, all used to illustrate the phenomenon of "revenue understating economic value," rather than as direct bullish or bearish calls:
| Company | Role and Key Data |
|---|---|
| Coca-Cola | As a franchisor, it recognizes only a small amount of revenue (e.g., margins fell after acquiring bottlers in 2010, recovered after divestiture in 2016). Adjusted EBIT margin fluctuated between 22% and 29% from 2007 to 2019. |
| Amazon | Third-party (3P) sales share rose from 3% in 1999 to 58% in 2018. 3P transactions only recognize commission revenue, leading to an understated reported margin. |
| Walmart | Growing third-party online marketplace sales, similar to Amazon's model. |
| Apple | Collects commissions from App Store sales, with revenue lower than economic value. |
| UnitedHealth Group | Manages self-insured plans and does not recognize premium revenue. |
| Quality Strategy Holdings | Over one-third of holdings (e.g., Alphabet 5.2%, Microsoft 6.2%, Apple 4.9%, UnitedHealth 4.3%, Coca-Cola 3.4%) have revenue significantly lower than the economic value they create. This is seen as a source of confidence for maintaining high margins. |
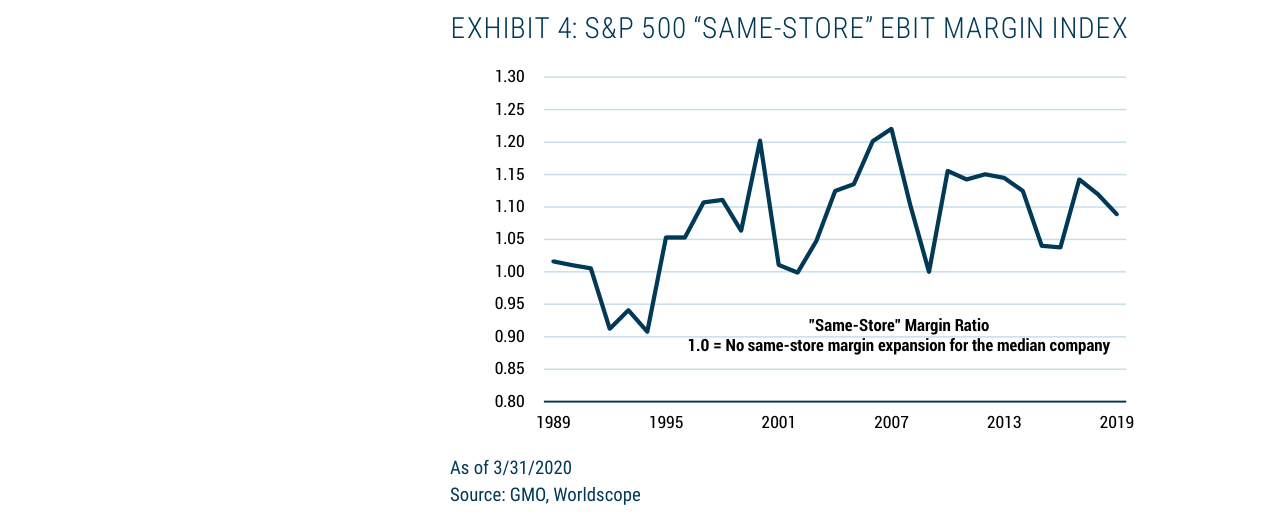
The "same-store" EBIT margin index shows median company margins fluctuating around 1.0 from 1989 to 2019, achieving only a modest expansion of 1.5 percentage points
Investment Implications
- Do not bet on margin mean reversion: Investors should not short the overall market or high-quality companies simply because the S&P 500 net profit margin is at a historical high. Margin expansion driven by the mix effect is structural and will not reverse due to cyclical factors.
- Focus on revenue quality, not reported margins: For companies whose revenue understates economic value (e.g., platform-based, asset-light models), reported margins may be overstated, but their earnings stability is stronger. Such companies account for over one-third of the Quality Strategy portfolio, forming the core of its long-term holding logic.
- Be wary of companies with same-store margin expansion: If a company's own margins have significantly improved (e.g., through price increases or reduced investment), it may face antitrust or competitive risks; margin expansion driven by the mix effect carries no such risk.
New Arguments and Data Analysis: The Impact of Long-Term Trends in Taxes and Interest Rates on Margins
1. Drivers and Persistence of the Global Corporate Tax Rate Decline
- Data Support: Exhibit 7 shows that since 1981, the U.S. corporate tax rate (statutory) has fallen from about 50% to 21% in 2020, while the median tax rate in developed economies has fallen from about 48% to about 25%. This trend has persisted for nearly 40 years and did not reverse after the populist backlash following the 2008 financial crisis.
- Key Mechanisms:
- Global Competition: Countries compete to attract multinational investment by lowering tax rates, creating a "race to the bottom." For example, low-tax countries like Ireland (12.5%) and Singapore (17%) continue to attract profit shifting from U.S. companies.
- Policy Inertia: Even if the Biden administration proposed raising the corporate tax rate from 21% to 28%, it would still be lower than the Obama-era rate (35%) and only partially reverse the 2017 tax cuts. This suggests political resistance makes a significant rate increase unlikely.
- Comparative Data:
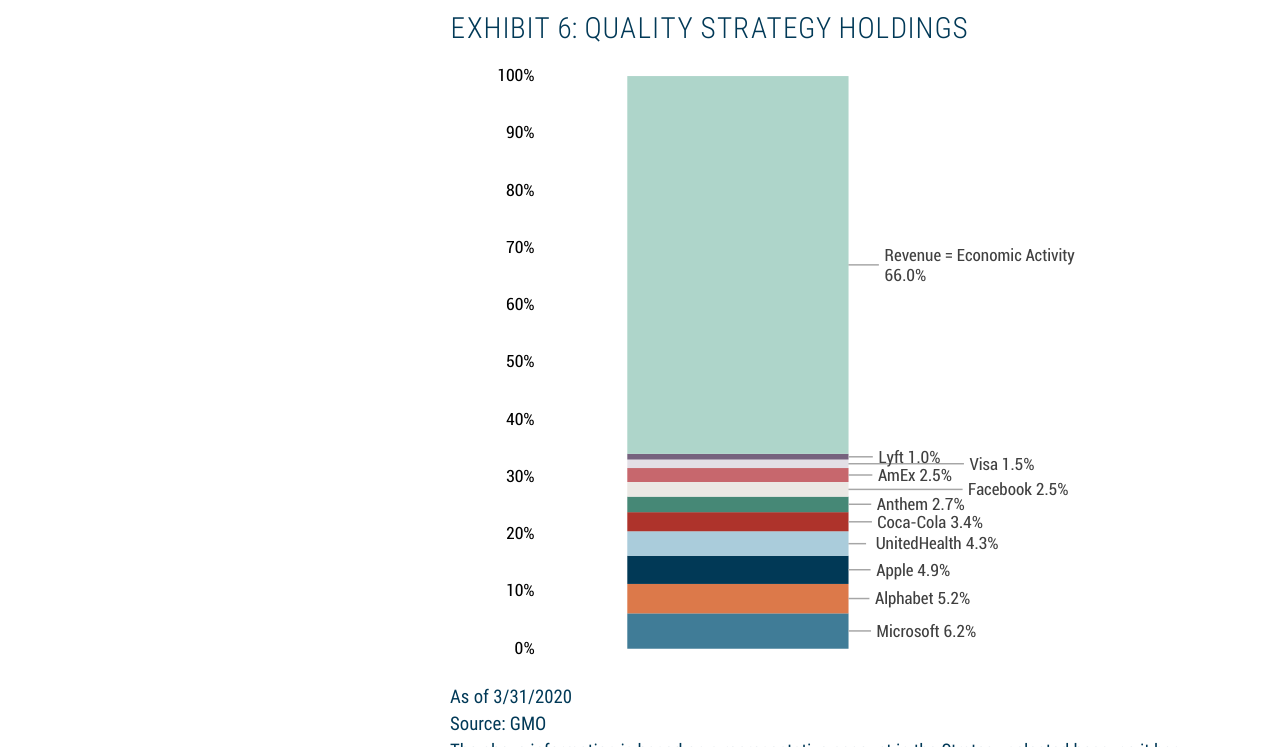
In the Quality Strategy portfolio, Microsoft accounts for 6.2%, Alphabet 5.2%, Apple 4.9%, and UnitedHealth 4.3%. The top ten holdings total 34%, with the remaining 66% representing other economic activities
| Period | U.S. Statutory Tax Rate Change | Median Tax Rate Change in Developed Economies | Key Policy Events |
|---|---|---|---|
| 1981-1989 | 46% → 34% | 48% → 40% | Reagan tax cuts |
| 2001-2009 | 35% → 35% | 32% → 26% | Bush tax cuts (accelerated depreciation) |
| 2017-2020 | 35% → 21% | 25% → 23% | Trump tax cuts |
| 2021-2024 (Projected) | 21% → 28% (Proposed) | 23% → 22% | Biden proposal (not fully passed) |
2. Impact of Falling Interest Rates on Net Interest Expense
- Data Support: Exhibit 8 shows that the 10-year U.S. Treasury yield fell from about 15% in 1981 to about 0.6% in 2020, while the S&P 500 net interest rate fell from about 12% to about 2%. The two are highly correlated (correlation coefficient > 0.9), indicating that falling interest rates are the main driver of the decline in net interest expense as a percentage of sales.
- Leverage Stability: Since the late 1980s, the S&P 500 corporate leverage ratio (debt/sales) has remained stable (around 0.5-0.6x). Therefore, the decline in net interest expense is entirely attributable to lower interest rates, not debt reduction.
- Future Outlook: The author is neutral on the interest rate outlook but notes that even if rates rise modestly (e.g., to 2-3%), the drag on margins from net interest expense would be limited (only about 0.1-0.2 percentage points), as current rates are already at historical lows.
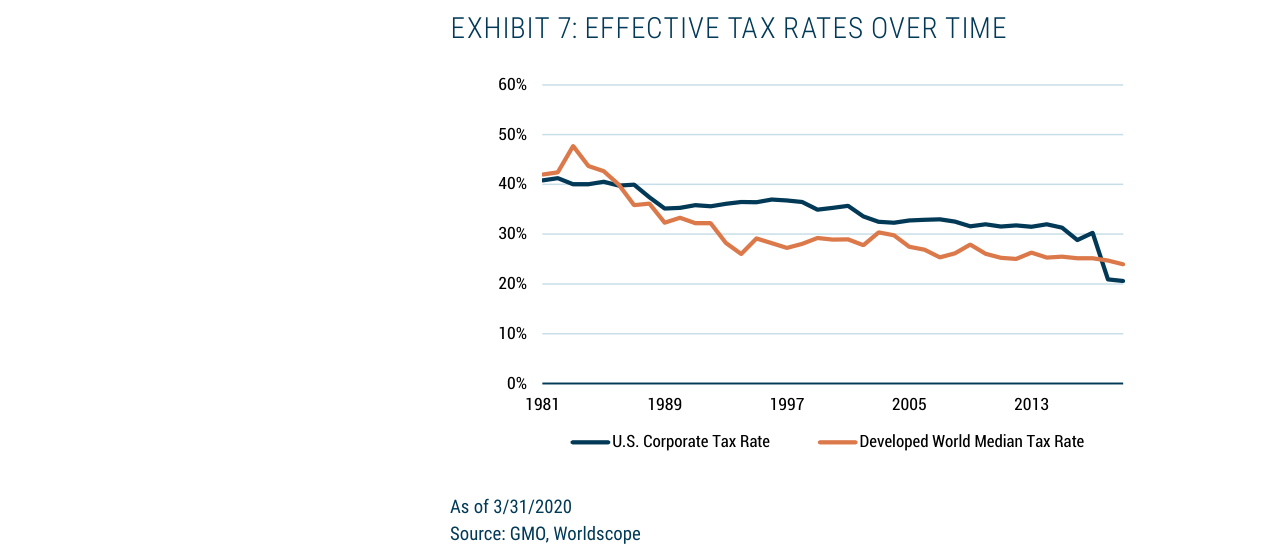
U.S. corporate tax rates and median developed country tax rates have steadily declined from about 40-45% in 1981 to about 20-25% in 2013, showing a long-term downward trend
3. Synergistic Effect of Taxes and Interest Rates
- Combined Impact: Falling tax rates and falling interest rates together drove corporate margin expansion. For example, from 1981 to 2020, the S&P 500 net profit margin rose from about 5% to about 12%. Approximately 40% of this increase came from lower effective tax rates (from about 40% to about 18%), and about 30% came from lower net interest expense (from about 6% to about 1.5%).
- Comparative Analysis:
| Margin Driver | Contribution in 1981 | Contribution in 2020 | Change |
|---|---|---|---|
| Effective Tax Rate | 40% | 18% | -22 pp |
| Net Interest Expense / Sales | 6% | 1.5% | -4.5 pp |
| Other (Operating Efficiency, etc.) | 54% | 80.5% | +26.5 pp |
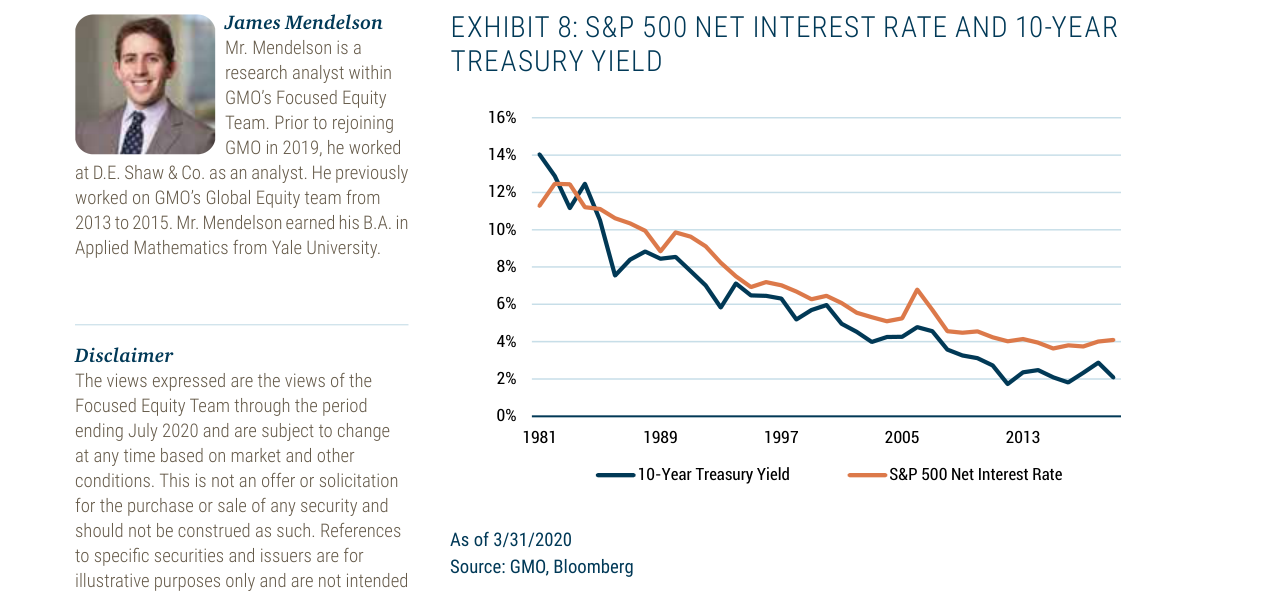
The 10-year U.S. Treasury yield and the S&P 500 net interest rate declined from about 14% and 12% in 1981 to about 2% and 4% after 2013, driving lower interest expense
4. Margin Resilience After COVID-19
- Short-Term Pressure: The COVID-19 pandemic in 2020 caused the S&P 500 net profit margin to briefly fall to about 8% (Q2 2020), but it quickly rebounded to over 12% (2021), demonstrating the support from structural factors (low taxes, low rates).
- Long-Term Logic: The author argues that even with the pandemic shock, companies can maintain margins through tax planning (e.g., shifting profits to low-tax countries) and debt management (e.g., refinancing at low rates). For example, Apple's effective tax rate in 2020 was only 14.5%, below the U.S. statutory rate of 21%.
5. Low Probability of Political Risk
- Historical Evidence: Despite the rise of populism after the 2008 financial crisis, U.S. corporate tax rates did not increase (they remained at 35% under Obama) and were further reduced in 2017. This suggests that political pressure has a limited impact on tax rates, as tax cuts are seen as tools to stimulate investment and employment.
- Current Trends: The 2023 global minimum corporate tax rate (OECD Pillar Two) is set at 15%, but the U.S. has not fully implemented it. Multinational companies can still reduce their actual tax burden through provisions like R&D tax credits and accelerated depreciation. Therefore, the long-term trend of declining effective tax rates is difficult to reverse.
Conclusion
The long-term downward trends in taxes and interest rates are core drivers of corporate margin expansion, supported by policy inertia and the structural forces of global competition. Even in the face of short-term shocks (like the pandemic) or political fluctuations (like the Biden proposal), these factors will help keep corporate profit margins high or cause only a modest decline, rather than a significant contraction.