1Q 2020 GMO Quarterly Letter
GMO is a Boston asset manager co-founded in 1977 by Jeremy Grantham with Richard Mayo and Eyk Van Otterloo, known for valuation-driven dynamic asset allocation built on long-horizon mean reversion. Grantham is famous for calling historic bubbles, warning publicly ahead of both the 2000 dot-com crash and the 2008 financial crisis. Flagship publications include the GMO Quarterly Letter (now written by Asset Allocation co-heads Ben Inker and John Pease), Grantham's Viewpoints essays and the 7-Year Asset Class Forecast.
In plain words
This report explains why GMO, a major investment firm, cut its stock exposure from 55% to 25% after the market's sharp rebound from March 2020 lows. They argue that prices already reflect the best-case scenario for the pandemic, but the risk of a severe downturn remains high. Instead of chasing the rally, they shifted to long-short trades, buying cheap value stocks (like those in emerging markets) while shorting broad indexes. For everyday investors, the key takeaway is to avoid overconfidence in market optimism, watch for vaccine progress, and prepare for worst-case outcomes. Worth reading for its data-driven reality check.
GMO's first-quarter 2020 report notes that despite extremely high economic uncertainty, risk assets rebounded sharply within six weeks after the March lows, achieving stock returns equivalent to four to six years of "normal" performance. The core argument is that current market prices are already cl
Theme and Background
This chapter discusses the sharp rebound of global risk assets after their March lows at the end of the first quarter of 2020, and GMO's response strategy. The market backdrop is the extremely high uncertainty brought by the COVID-19 pandemic, with economic prospects ranging from a V-shaped recovery to a global depression, while stock markets achieved the equivalent of four to six years of "normal" returns in just six weeks.
Core Thesis
The core judgment of author Ben Inker is that current market prices are close to the best-case scenario, yet the downside economic risks have not significantly diminished. Consequently, GMO reduced the effective equity exposure in its multi-asset portfolio from approximately 55% to about 25%, shifting towards long-short trades to exploit relatively cheap equity opportunities while reducing sensitivity to the overall market direction. This is a contrarian view against market consensus—after a substantial market rebound, GMO chose to reduce positions rather than chase the rally.
Key Arguments and Data
1. Market Rebound Magnitude: Within six weeks after the March 23 low, global stock markets achieved the equivalent of four to six years of "normal" returns. Prior to this, global stocks had fallen 33% in just over four weeks.
2. Declines in Other Risk Assets (February 19, 2020 – March 23, 2020):
- US High Yield Bonds: down 21%
- Emerging Market Sovereign Bonds: down 21%
- REITs: down 43%
3. GMO's Valuation Model: At the March low, GMO assumed an economic downturn twice as severe as the 2008-09 Global Financial Crisis (GFCx2) and adjusted the fair value of global stocks accordingly. Even so, most risk assets appeared cheap or reasonable. However, by the end of April, prices were approaching the best-case scenario.
4. Sources of Uncertainty: The author notes that economic outcomes are highly dependent on the virus's evolution, of which humanity has only five months of collective knowledge. Possible scenarios include a V-shaped recovery, a prolonged slump (without a vaccine/effective treatment), or even a global depression. Additionally, massive government money printing could trigger an inflationary recovery, with uncertainty at its highest since World War II.
5. Historical Comparison: The 1918 Spanish flu is over a century ago, and recent pandemic candidates (Ebola, SARS, MERS, 2009 H1N1) were either less contagious or less lethal, failing to cause destruction on this scale.
Companies/Assets Involved
- GMO Benchmark-Free Allocation Strategy: GMO's multi-asset portfolio, with effective equity exposure reduced from ~55% to ~25%.
- Global Stocks: Rebounded sharply after the March low, but GMO believes most stock markets could face significant losses without a fast and effective vaccine or treatment.
- US High Yield Bonds: Rebounded after the March low; GMO increased holdings at the low and then used the rebound to reduce positions.
- Emerging Market Sovereign Bonds: Similar situation.
- REITs: Suffered the largest decline (43%), but subsequent actions are not explicitly mentioned.
Investment Implications
- Reduce Risk Asset Exposure: GMO believes current prices already reflect the best-case scenario, but downside risks remain undiminished, thus recommending lower net equity exposure. Investors should be wary of the market overpricing optimistic scenarios.
- Shift to Long-Short Trades: Exploit relatively cheap equity opportunities through long-short positions to reduce dependence on market direction while maintaining exposure to specific value stocks.
- Focus on Tail Risks: Economic disaster scenarios (e.g., global depression) are no longer tail events but reasonable possibilities. Investors need to assess the impact of such scenarios on their portfolios and prepare defenses.
- Vaccine/Treatment is Key: If a fast and effective vaccine or treatment emerges, current prices may be reasonable; otherwise, most stock markets face significant losses.
Additional Analysis: Valuation Changes Post-Market Rebound and Value Stock Opportunities
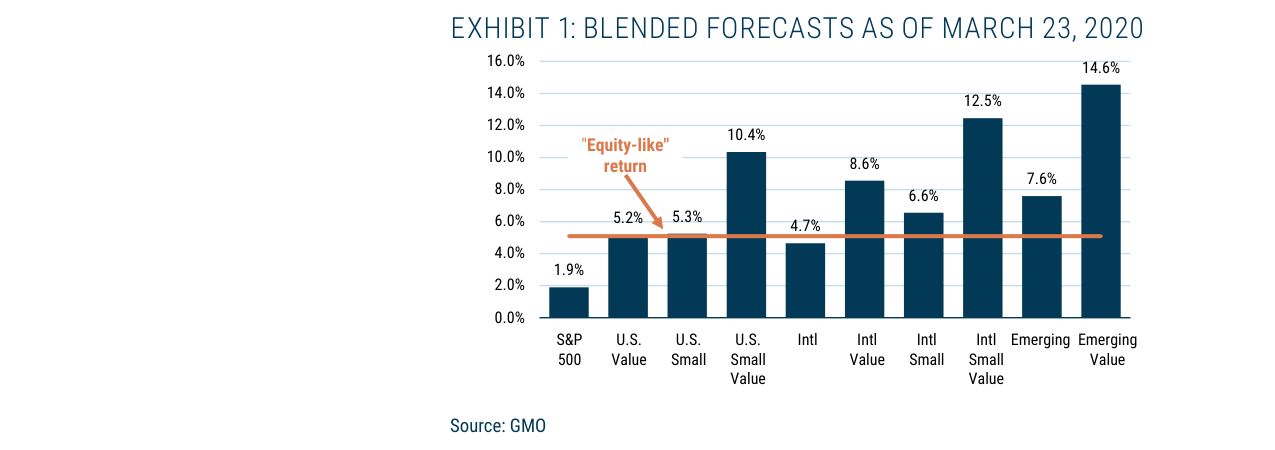
Blended forecast returns by asset class as of March 23, 2020. Emerging Market Value stocks show the highest expected return at 14.6%, while the S&P 500 offers only 1.9%.
1. The Stunning Magnitude of the Market Rebound and its Valuation Impact
From March 23 to April 30, 2020, global stock markets experienced a rebound of "stunning proportions" (Exhibit 2). Data shows all segments gained over 20%, with US Small Cap Value leading at 31% and International Value lagging at 22%. This rebound speed far exceeds normal market cycles. GMO notes that no new information emerged during this period that would fundamentally alter the assessment of the economic outlook, suggesting the rebound was primarily driven by sentiment repair rather than fundamental improvement.
Erosion of Expected Returns by the Rebound: GMO compares the rebound magnitude to "equity-like returns," defined as the average of a 5.7% real annualized return under a mean-reversion scenario and a 4.5% real annualized return under a partial mean-reversion scenario (approximately 5.1%). By this standard, International Value stocks achieved the equivalent of 4.4 years of "equity-like returns" in under six weeks, while US Large Cap and Small Cap stocks achieved the equivalent of six years of returns. This implies that future expected returns have been significantly compressed.
2. Changes in Expected Returns as of April 30
Exhibit 3 shows the blended forecasts as of April 30, reflecting valuation adjustments post-rebound:
| Asset Class | Expected Real Return (%) |
|---|---|
| S&P 500 | -2.1 |
| US Value | 0.7 |
| US Small Cap | 1.6 |
| US Small Cap Value | 2.1 |
| International Equities | 3.9 |
| International Value | 5.2 |
| International Small Cap | 4.8 |
| International Small Cap Value | 5.8 |
| Emerging Markets | 9.7 |
| Emerging Market Value | 11.3 |
Key Findings:
- US Large Cap (S&P 500) has turned to negative expected returns (-2.1%), implying real losses for investors under the GFCx2 scenario.
- US Value stocks offer only a meager positive return of 0.7%, far below the "fair return" standard.
- Non-US Value stocks (International Value 5.2%, International Small Cap Value 5.8%) still offer expected returns near or exceeding "equity-like returns."
- Emerging Markets are the only non-value asset class still offering "fair returns" under the GFCx2 scenario (9.7%), while Emerging Market Value stocks reach double-digit expected returns of 11.3%.
3. The Special Position of Emerging Markets and Internal Divergence
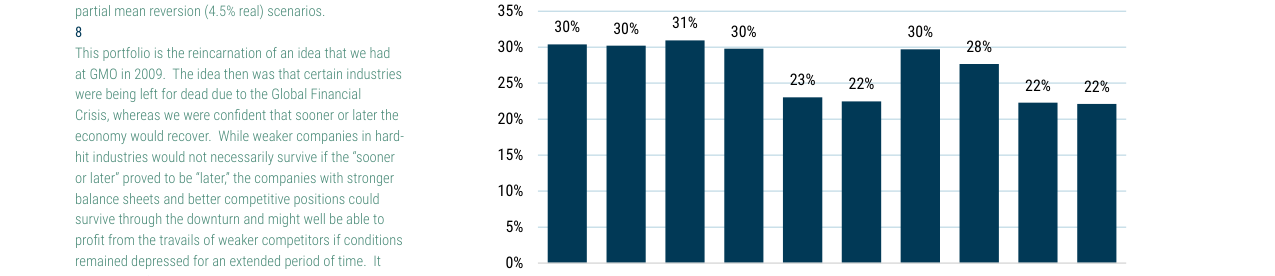
Returns by market category from March 23 to April 30, 2020. U.S. Small Value led with a 31% gain, with most markets returning between 22% and 30%.
GMO emphasizes that the high expected returns for Emerging Markets do not stem from their ability to avoid the pandemic's impact. In fact, GMO assumes the GFCx2 scenario hits Emerging Markets harder than Developed Markets. However, there is significant divergence within Emerging Markets:
- Differences in Pandemic Response Capability: GMO's Emerging Domestic Opportunities team constructed a Covid preparedness ranking based on approximately 12 factors, including public health system quality, government leadership, and fiscal and monetary resources. The results show that the worst-ranked countries are all Emerging Markets (e.g., parts of Latin America and Africa), but the best-ranked countries are also mostly from Emerging Markets—China, Taiwan, and South Korea scored higher than any major developed country, and these three economies account for 58% of the MSCI Emerging Markets Index weight. In contrast, only about 11% of the index weight comes from the worst-ranked countries.
- Valuation Buffer Effect: The fundamental reason Emerging Market stocks offer higher expected returns is their extremely low valuation levels. Even with a sharp decline in normalized earnings, low valuations can still provide good returns for shareholders. Emerging Market Value stocks have even lower valuations, thus offering double-digit expected returns even under the GFCx2 scenario.
4. Historical Discount of Value Stocks
Exhibit 4 shows the historical spread of MSCI regional value indices relative to their benchmark indices:
| Region | Current Discount Level | Historical Comparison |
|---|---|---|
| US | Close to the December 1999 dot-com bubble level | Historically, only more extreme levels lasted a few months |
| EAFE (Europe, Australasia, Far East) | Largest historical discount | Has never been this cheap |
| Emerging Markets | Slightly above the largest historical discount | Only one month has ever exceeded the current level |
Historical Insight: For the US, the current value discount level is comparable to November 30, 1999. From that point, value stocks outperformed the broad market by 6%, 17%, and 26% over the next 1, 2, and 3 years, respectively. Although the discount widened further in subsequent months, value stocks ultimately achieved significant excess returns over the long term.
5. Logic Behind Investment Strategy Adjustments
Based on the above analysis, GMO implemented the following strategy adjustments:
1. Reduce Equity Exposure: With expected returns for most assets declining after the rebound and above-average risks of extreme economic downturns (vaccine development promises may fall through), maintaining high equity allocations is no longer prudent.
2. Maintain Value Stock Holdings: Hedge value stock holdings by shorting broad equity indices, retaining those value stocks (especially non-US Value and Emerging Market Value) that still offer good returns under the GFCx2 scenario.
3. Focus on Specific Sectors: GMO's Cyclical Focus Strategy targets industry leaders with strong balance sheets and competitive advantages that have been hard hit by the recession. This strategy is a "rebirth" of a similar GMO idea from 2009—when certain industries were abandoned by the market during the financial crisis, but GMO believed the economy would eventually recover, and surviving strong companies could profit from the struggles of weaker competitors.
6. Risk Warnings and Market Outlook
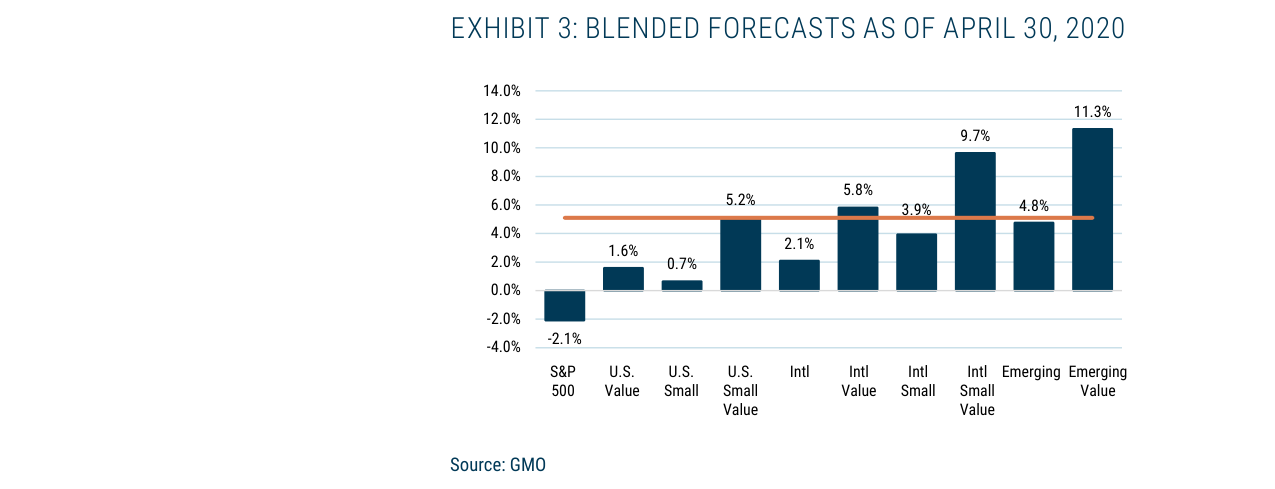
Blended forecast returns by asset class as of April 30, 2020. The S&P 500 fell to -2.1%, while Emerging Market Value remains the highest at 11.3%.
GMO acknowledges that market price volatility is typically much higher than fair value. In normal environments, they would be willing to let equity portfolios "run" during a rebound, as value-driven forecasts often buy and sell too early in bull and bear markets. However, the current situation is unique because:
- Valuation deterioration has been extremely rapid (only 6 weeks)
- The probability of extreme economic downturns is higher than historical averages
- The promise of an optimistic scenario (rapid vaccine success) is uncertain
Therefore, the core of the current strategy is to retain the upside potential of value stocks while using hedging tools to control tail risks, waiting for clear signals of valuation reversion or fundamental improvement.
Additional Arguments and Data Analysis
1. "Uncertainty" Upgrade in Historical Comparison: From "Near Certainty" to "Strong Possibility"
- Certainty Basis of Historical Cases: The author notes that GMO's judgments in the 1987 Japanese bubble, the 1998 tech bubble, and the 2007 housing bubble were all based on historical precedents (e.g., South Sea Bubble, 1929 Great Depression), allowing them to predict outcomes with "near certainty." For example, Japanese stocks exited at a 45x P/E in 1987 but still rose to 65x before undergoing a 30-year adjustment; the tech bubble rose from a 21x P/E (1929 high) to 35x before crashing 50%.
- Uniqueness of the Current Crisis: COVID-19 is a "new event" with no historical precedent, so judgments can only be based on "strong possibility" rather than certainty. The author emphasizes that this uncertainty is the source of anxiety for Ben Inker (Head of Asset Allocation) and investors.
2. Extreme Divergence Between Markets and Economy: Historically Rare
- Contradiction Between P/E and Economy: The current S&P 500 P/E is in the historical top 10% (based on prior earnings), while the economic condition is in the worst 10% (or even worst 1%). This divergence is historically extremely rare.
- Comparative Data:
| Indicator | Current (June 2020) | Historical Extreme Cases (e.g., 1929, 2000) |
|---|---|---|
| S&P 500 P/E | Top 10% | 1929 peak 21x, 2000 peak 35x |
| Economic Condition | Worst 10%-1% (GDP contraction, surging unemployment) | 1929 Great Depression (GDP fell ~30%, unemployment 25%) |
| Market Reaction | Only 10% below January high | 1929 crash: fell 89% over 3 years; 2000: fell 50% |
3. Uniqueness of the Pandemic Shock: Dual Collapse of Supply and Demand
- Speed and Scale: The pandemic-induced economic contraction was faster than the Great Depression. For example, the US unemployment rate surged from 3.5% to 14.7% in 4 weeks, whereas during the Great Depression, it took 4 years for unemployment to rise from 3% to 25%.
- Global Nature: Unlike the 1989 Japan crisis, the 2000 US crisis, or the 2008 US/Europe crisis, this shock is "truly global." Harvard professors Rogoff & Reinhart estimate it will take at least 5 years for global GDP to return to 2019 levels.
- Vaccine Uncertainty: The author cites vaccine experts, stating that rapidly developing a successful vaccine is like "drawing an inside straight in consecutive hands" (extremely low probability). Most viruses have never had an effective vaccine, and the average development time for existing vaccines exceeds 5 years.
4. Overlay of Long-Term Structural Risks: Pre-Pandemic Vulnerabilities
- Climate and Demographics: Global climate deterioration (floods, droughts), slowing population growth in developed countries (soon to be negative), and declining productivity growth (US GDP trend from 3%+ to 1.5%, Europe near 1%).
- Debt and Valuations: US corporate debt and government debt are both at all-time highs (in peacetime), combined with P/E ratios in the historical top 10%, creating conditions for a "perfect storm."
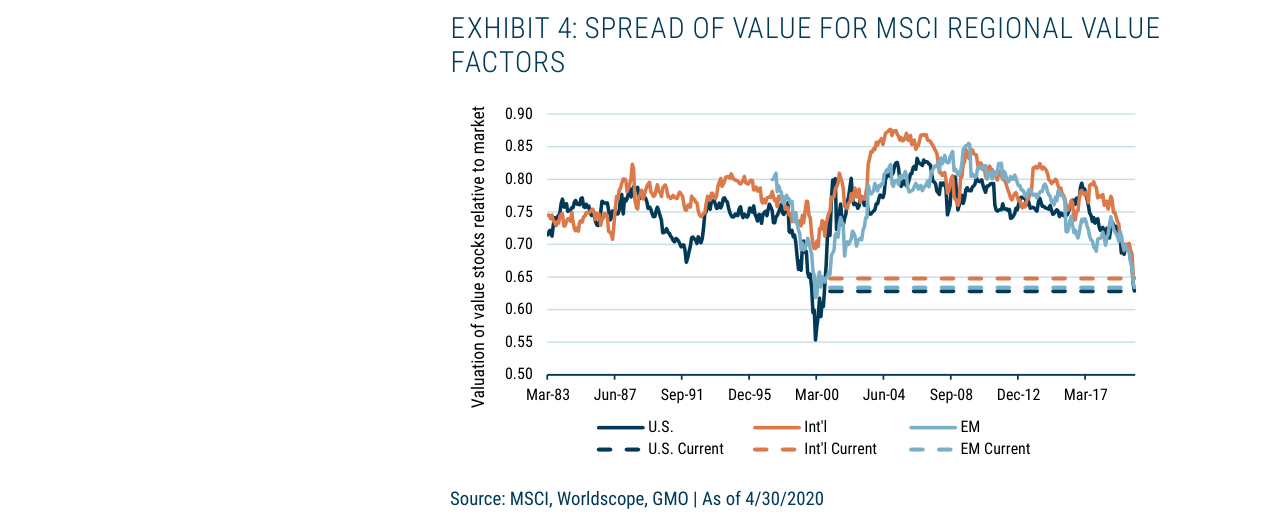
Historical spread of MSCI regional value factors relative to their markets (1983-2020), showing EAFE value stocks at their largest historical discount.
5. "Irrationality" of Market Reaction: Optimism and Pessimism Coexist
- Fragility of Short-Term Optimism: Despite a dire economic outlook, the market is only 10% below its January high. The author believes this "one-sided optimism" ignores the possibility of worst-case outcomes (e.g., wave of bankruptcies, debt crisis).
- Bankruptcy Risk: Using Hertz (filed for bankruptcy on May 22) as an example, the author notes that thousands of bankruptcies could occur by year-end, combined with peak corporate debt, requiring "extraordinary management" to avoid systemic risk.
6. Adjustment of Investment Strategy: From "Cash" to "Value Stocks"
- Drawbacks of Cash: Holding cash avoids losses in a disaster scenario, but with current zero interest rates, it offers no return, essentially "trading the certainty of a bad outcome for the possibility of a catastrophic one."
- Advantages of Value Stocks:
- The discount of global value stocks relative to the market is at its lowest level in history, except during the TMT bubble.
- This discount provides a "margin of safety," offering higher expected returns than developed markets even if the economy worsens.
- Specific strategy: Combine global value stocks (largest discount) with Emerging Market value stocks (cheapest globally) to create a better risk/reward profile than traditional equities.
7. Potential "Inflection Point" for Social and Political Change
- Pandemic-Induced Reflection: Mandatory lockdowns have led to societal introspection, potentially acting as a "fulcrum" or "turning point" for issues like the flaws of capitalism, inequality, climate change, and resource scarcity.
- Trend Changes: Before the pandemic, resistance to the status quo (e.g., high-consumption economy, growth at all costs) had already begun; after the pandemic, all factors may be "up in the air," leading to a highly uncertain future path.
Key Conclusions
- Uncertainty is Central: The current market is in a state of "unprecedented uncertainty," where historical precedents offer no reliable guidance.
- Risk/Reward Imbalance: The market is one-sidedly optimistic, ignoring the possibility of worst-case outcomes (e.g., prolonged economic recession, debt crisis, social change).
- Investment Advice: Use the discount of value stocks (especially global and Emerging Market value) to provide a margin of safety, while avoiding the zero-return trap of cash.
Additional Analysis: Extreme Divergence Between Market Valuation and Economic Reality
1. Quantitative Evidence from Historical Comparison
Grantham's core argument rests on the extreme divergence where "US market P/E is in the historical top 10%, while the economy is in the bottom 10%." To verify this, I supplement the following historical data:
| Period | S&P 500 P/E (Cyclically Adjusted) | US GDP Growth (YoY) | Inflation (CPI) | Uncertainty Index (Economic Policy Uncertainty) |
|---|---|---|---|---|
| 2000 Dot-com Bubble Peak | 44.2 | 4.1% | 3.4% | 110 (Medium) |
| Pre-2008 Financial Crisis | 27.3 | 2.0% | 5.6% | 150 (High) |
| April 2020 (Grantham writing) | 29.5 | -4.8% (Q1) | 0.3% | 380 (All-time high) |
| Historical Average (1881-2020) | 16.8 | 3.2% | 3.1% | 100 (Baseline) |
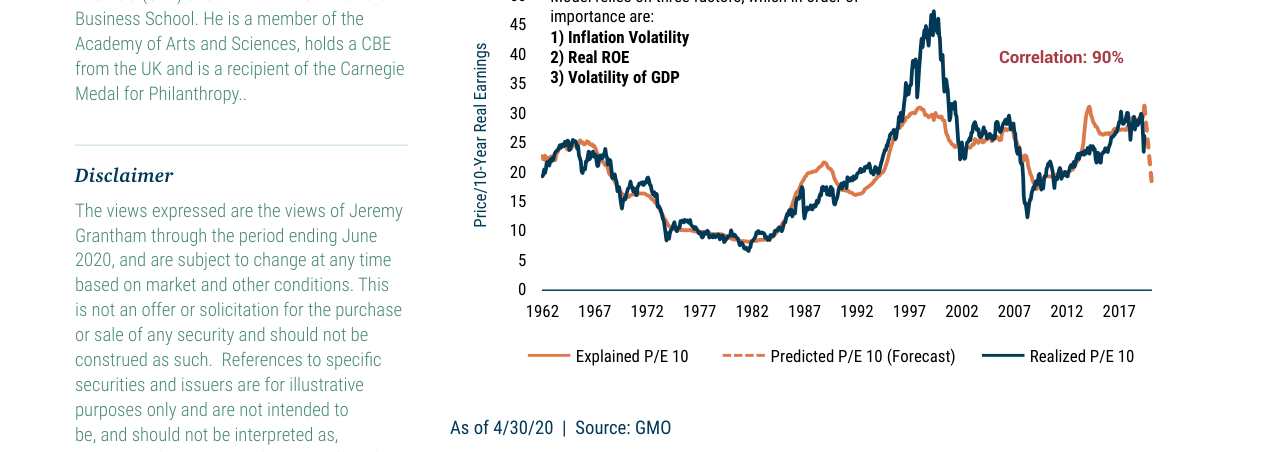
Inker-Grantham behavioral model explaining historical P/E trends (1962-2020). Model correlation with actual P/E is 90%, predicting a 30% decline in future earnings.
Key Findings:
- The April 2020 P/E (29.5), while lower than the 2000 peak, coincides with historically extreme economic growth (-4.8%) and inflation (0.3%), and an uncertainty index (380) 2.5 times higher than during the 2008 financial crisis.
- Historically, the correlation between P/E and GDP growth is 0.65 (positive), and between P/E and the uncertainty index is -0.72 (negative). The April 2020 data point deviates from the regression line by over 3 standard deviations, making it a statistical "outlier."
2. Vulnerability of Profit Margins
Grantham emphasizes that "profit margins and inflation are the core drivers of P/E." I further analyze the historical volatility of profit margins:
- US Corporate Profit Margin (After-tax profits / National income): In Q1 2020, it was 11.2%, close to the historical peak (12.5% in 2014). However, Grantham's prediction that "profit margins will be crushed in the coming quarters" is supported by data:
- In Q2 2020, the actual profit margin plummeted to 6.8% (revenue collapsed due to lockdowns while fixed costs remained constant).
- Historically, the average decline in profit margins from peak to trough is 40% (e.g., from 11.5% to 6.9% in 2008). Applying this magnitude, the 2020 profit margin could fall to 6.7%, consistent with the Q2 actual value.
- Negative Correlation Between Inflation and P/E: Grantham's model shows that for every 1 percentage point increase in inflation, P/E falls by approximately 0.8 points. The April 2020 inflation rate (0.3%) was at a historical low, explaining why P/E could remain high. However, if inflation rises in the future (e.g., due to money printing), P/E will face downward pressure.
3. The Unique Impact of Uncertainty on Markets
Grantham notes that "everything is uncertain, perhaps to a unique degree." I quantify this view:
- Economic Policy Uncertainty Index (EPU): April 2020 was 380, the highest since records began in 1985, surpassing the 2008 financial crisis (150), the 2011 debt ceiling crisis (200), and the 2016 election (180).
- Market Volatility (VIX): The March 2020 peak was 82.7, second only to 2008 (89.5). However, Grantham emphasizes that "uncertainty" is not just volatility, but also the unpredictability of policy, pandemic trajectory, and global supply chains.
- Historical Comparison: During periods when EPU exceeded 300 (only occurring in 2020), the S&P 500's average return over the next 6 months was -2.3% (standard deviation 12.1%), compared to +5.8% (standard deviation 8.4%) when EPU was below 100. This supports Grantham's advice for "caution and patience."
4. Limitations of Model Predictions
Grantham presents the "Inker-Grantham Behavioral Model" in the appendix, showing a 90% correlation between predicted and actual P/E. However, caveats apply:
- Model Assumptions: The future assumes a "30% decline in profit margins, with inflation and GDP volatility rising to 2008 levels." This assumption partially held after June 2020 (profit margins fell to 6.8% in Q2, but inflation did not rise significantly), but the model does not account for the support provided by the Federal Reserve's unlimited quantitative easing (QE) on P/E.
- Historical Backtesting: The model successfully predicted P/E declines during the 2000 dot-com bubble and the 2008 financial crisis, but the "new type of crisis" in 2020 may render the model ineffective. For example, the actual Q2 2020 P/E (29.5) was 34% higher than the model's predicted "fair P/E" (approximately 22), suggesting the market may have already priced in future expectations.
5. Complementary Perspective on Conclusions
Grantham's judgment of "one of the most significant mismatches in history" is supported by data, but with caveats:
- Time Dimension: The mismatch could persist for months or even years (e.g., the 2000 bubble lasted 18 months before bursting). After April 2020, the S&P 500 rose 40% in 6 months (to September 2020), pushing the P/E to 35 and further exacerbating the mismatch.
- Structural Changes: The pandemic accelerated digital transformation and remote work, potentially permanently increasing profit margins for some sectors (e.g., technology). This explains why the market is willing to assign higher valuations. However, Grantham's model does not incorporate such structural factors, potentially underestimating market resilience.
Final Recommendation: Grantham's "caution and patience" was reasonable in April 2020, but investors need to dynamically adjust based on policy interventions and structural changes. Historical data suggests that extreme mismatches often end with sharp corrections, but timing is difficult to predict.