3Q 2019 GMO Quarterly Letter
GMO is a Boston asset manager co-founded in 1977 by Jeremy Grantham with Richard Mayo and Eyk Van Otterloo, known for valuation-driven dynamic asset allocation built on long-horizon mean reversion. Grantham is famous for calling historic bubbles, warning publicly ahead of both the 2000 dot-com crash and the 2008 financial crisis. Flagship publications include the GMO Quarterly Letter (now written by Asset Allocation co-heads Ben Inker and John Pease), Grantham's Viewpoints essays and the 7-Year Asset Class Forecast.
In plain words
This GMO letter says that the gap between cheap and expensive stocks is now as extreme as before the 2000 dot-com bubble burst—and maybe even better. For regular investors, it means if you stick with undervalued assets (like non-U.S. stocks and value stocks), you could see big gains over the next decade, similar to what happened after 2000. It's worth reading because it uses historical data to show how extreme valuations often lead to great opportunities, and explains why this time might be unique—for example, emerging markets are cheaper relative to the U.S. than ever before.
GMO 2019 Third Quarter Letter Authored by Ben Inker, Head of Asset Allocation, titled "The Shadow of 2000." The core argument of the report is that current market valuation extremes are approaching those of the late 1990s internet bubble, creating the greatest opportunity for value-driven investors
Theme and Background
This chapter serves as the introduction to GMO's Q3 2019 letter, authored by Asset Allocation Director Ben Inker. The core backdrop is that current market valuation extremes have approached levels seen during the late 1990s internet bubble, but the cycle has lasted longer (over 10 years vs. 5 years), causing the cumulative relative performance of value-driven investment strategies to once again approach historical worst levels.
Core Thesis
The author makes a clear judgment: the opportunity set created by current valuation extremes is at least as extraordinary as before the 2000 bubble burst, and potentially even better. The counterintuitive aspects are:
- Although the discount of value stocks relative to growth stocks is not as extreme as in 1999, the valuation disparities across regions (EAFE/EM vs. US) and across styles are broader, making the overall opportunity set superior.
- The current cycle has lasted longer (10+ years vs. 5 years), and while the pain is slightly less severe (cumulative underperformance of approximately 20-25%), it has already approached 1990s levels, and client patience is once again exhausted.
Key Arguments and Data
1. Historical Comparison Data (1994-1999 vs. 1994-2009 vs. 1994-2019):
- 1994-1999: GMO's Global Equity Allocation strategy underperformed its benchmark by a cumulative 26%, and the Multi-Asset strategy underperformed by 21%.
- The following decade (through 2009): The Global Equity Allocation strategy outperformed by a cumulative 102%, and the Multi-Asset strategy outperformed by 70%.
- As of August 2019: The Global Equity Allocation strategy underperformed by a cumulative 21%, and the Multi-Asset strategy underperformed by 16% (approximately 75-80% of the 1990s magnitude).
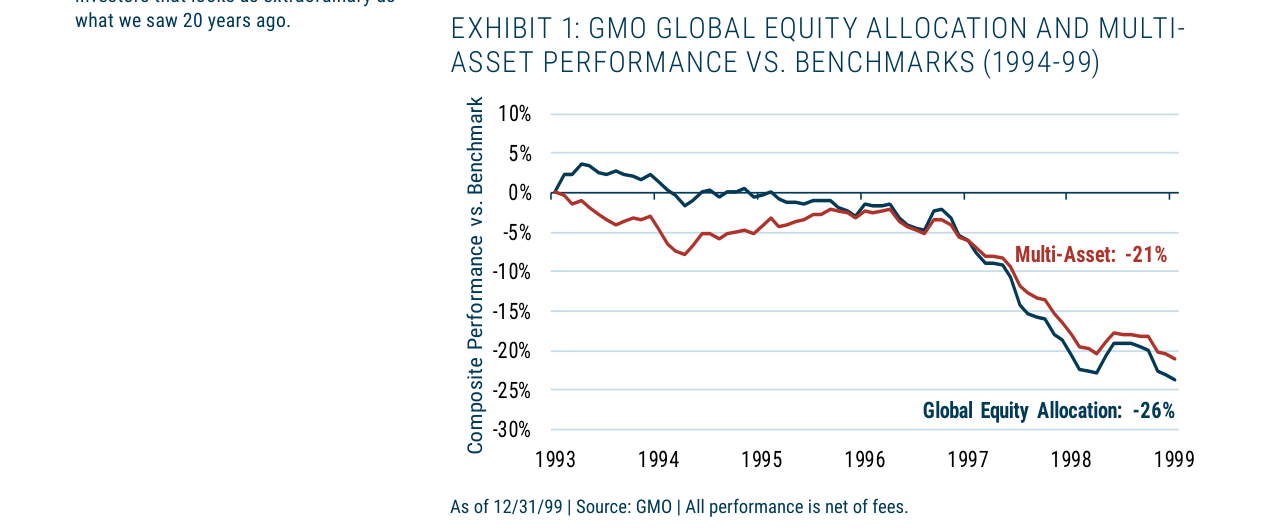
GMO Global Equity Allocation and Multi-Asset strategies underperformed benchmarks from 1994-1999, trailing by 26% and 21% respectively as of December 1999
2. Valuation Extremes Comparison (Table 1):
| Valuation Metric | December 1999 | August 2019 |
|---|---|---|
| EAFE vs. US (Region) | 68.9% | 99.9% |
| Emerging Markets vs. US (Region) | 88.7% | 93.8% |
| US Value vs. Growth (Style) | 99.4% | 93.1% |
| EAFE Value vs. Growth (Style) | 99.2% | 96.5% |
| EM Value vs. Growth (Style) | 93.4% | 94.7% |
- 1999: The US/EAFE value style discount was at an extreme 99%+ percentile, but regional valuation differences were smaller.
- 2019: The discount of EAFE and Emerging Markets relative to the US is at historical highs (99.9%/93.8%). While the value style discount is slightly less extreme than in 1999, the EM value discount is actually higher (94.7% vs. 93.4%).
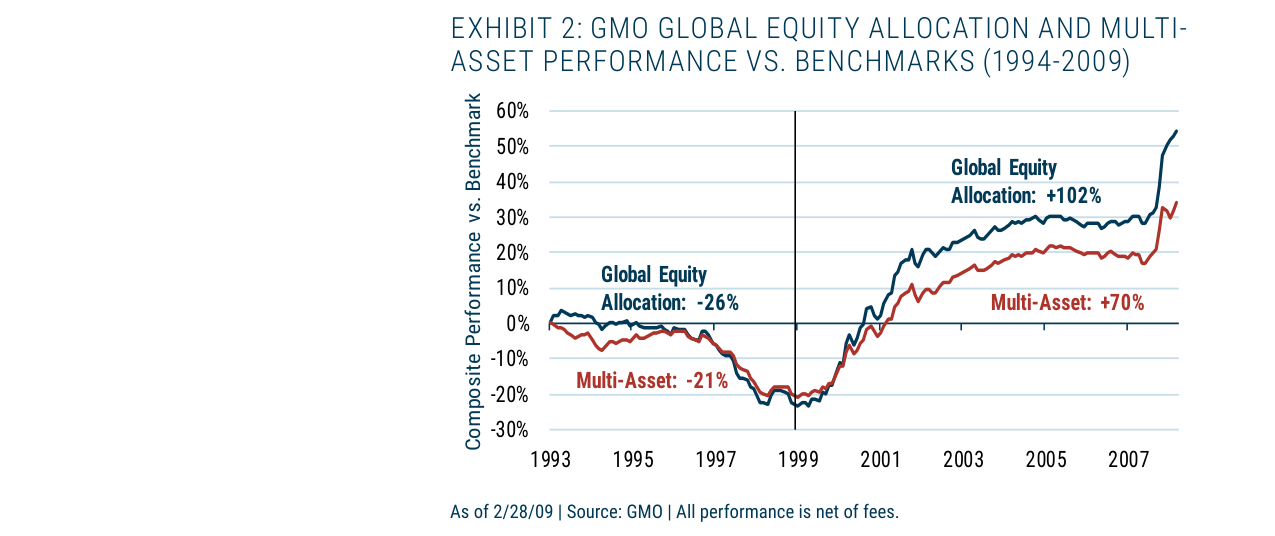
From 1994-2009, strategies shifted from underperformance to significant outperformance, with Global Equity Allocation ultimately outperforming by 102% and Multi-Asset by 70%; while 1994-2019 shows strategies underperforming again as of August 2019, with Global Equity Allocation trailing by 21% and Multi-Asset by 16%
3. Forecast Model Differences:
- GMO currently uses a 7-year mean reversion cycle (vs. 10 years in 2000), resulting in larger current forecast magnitudes.
- Even under a "partial mean reversion" assumption (assuming permanently lower interest rates), the forecast results are only slightly worse, with no material difference.
Companies/Assets Involved
- GMO's Own Strategies: Global Equity Allocation and Multi-Asset strategies. The author uses the historical performance of these two strategies as core case studies to demonstrate the opportunity for value-driven investing in extreme valuation environments.
- America Online: Used as a case study of an individual stock excluded in 1999 due to momentum model rules. The stock's rise that year caused the US Core strategy to underperform by over 1 percentage point.
- S&P 500: Used as a benchmark reference for overvaluation in 1999 (the author explicitly considered it "foolishly overvalued" at the time).
- Investment-Grade Developed Market Bonds: 30% trading at negative yields, which the author considers potential evidence of "collective loss of reason."
Investment Implications
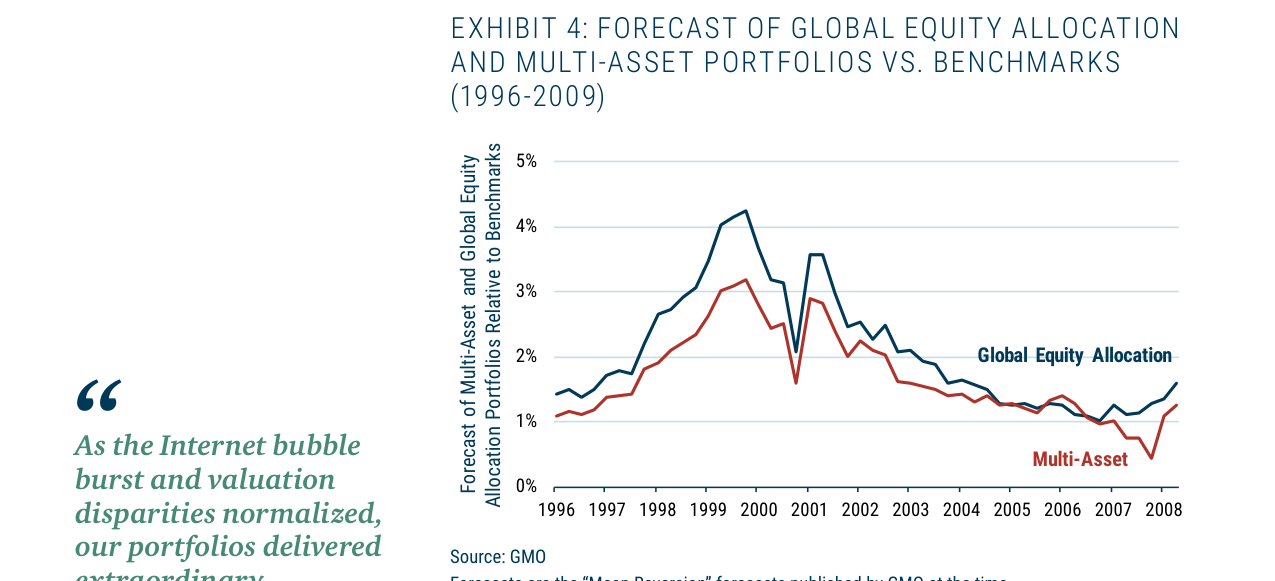
Forecasts from 1996-2009 show the expected return spread widening to over 4% before the internet bubble burst, then falling back to around 1%
- For Value-Driven Investors: Current valuation extremes have approached or even exceeded levels seen before the 2000 bubble burst, representing the largest opportunity set since the Great Depression. Historical experience shows that investors who adhered to value strategies achieved cumulative excess returns of 102% (Global Equity) and 70% (Multi-Asset) over the subsequent decade.
- For Cross-Regional Allocation: The discount of EAFE and Emerging Markets relative to the US is at historical highs (99.9%/93.8%), representing the most prominent opportunity currently. The author implies that even if the value style is not as extreme as in 1999, regional allocation opportunities compensate for this.
- Regarding the Interest Rate Environment: Even under the assumption of permanently lower interest rates (partial mean reversion scenario), the forecast advantage of value strategies remains significant. Investors should not abandon value investing due to the low-rate environment.
Additional Analysis: Uniqueness and Strategic Advantages of the Current Opportunity Set
1. Quantitative Comparison of Opportunity Sets: 2000 vs. 2019
GMO uses Exhibit 6 to show the current forecast spread of the Multi-Asset portfolio relative to its benchmark, comparing it with the historical high from September 2000. Key data is as follows:
| Metric | September 2000 (7-Year Equivalent) | August 2019 (Mean Reversion) | August 2019 (Partial Mean Reversion) |
|---|---|---|---|
| Multi-Asset Global Equity Portfolio Spread | 6.0% | 4.8% | 4.4% |
| Benchmark-Free Strategy Spread | Not Launched | 5.5% | 4.6% |
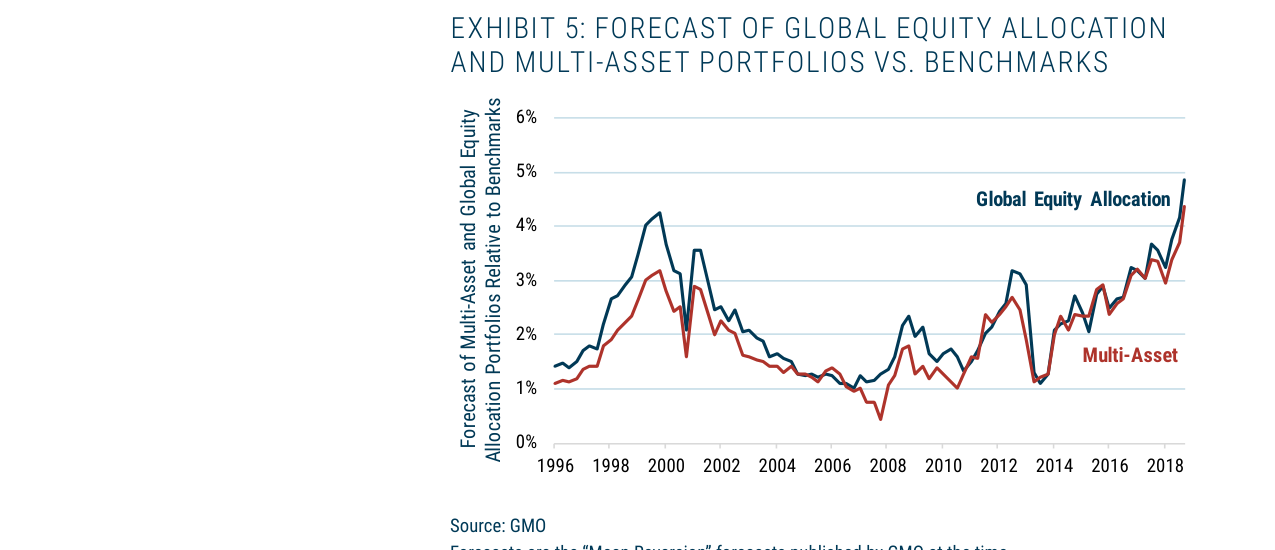
Forecasts from 1996-2018 show the current (2019) expected return spread approaching 5%, the best opportunity in 20 years
Core Findings:
- The current spread under the mean reversion scenario (4.8%), while lower than the 6.0% in 2000, narrows significantly when considering the 2000 data needs to be multiplied by 10/7 for a 7-year equivalent (actual 4.6%).
- The partial mean reversion scenario (4.4%) is nearly flat with the adjusted 2000 figure (4.6%), indicating that the current opportunity set, even under conservative assumptions, remains near historical extremes.
2. Unique Advantages of the Benchmark-Free Strategy
GMO had not yet launched the Benchmark-Free Allocation Strategy in 2000; it was first adopted by clients in the second half of 2001. Its core advantages are:
- Elimination of Tracking Error Constraints: No need to hold US stocks merely to control tracking error against traditional benchmarks (e.g., global equity indices).
- Higher Forecast Spread: Under the mean reversion scenario, this strategy's spread reaches 5.5%, significantly higher than the Multi-Asset portfolio's 4.8%; under the partial mean reversion scenario, it is 4.6%, still above the Multi-Asset portfolio's 4.4%.
- Historical Validation: GMO notes that if such spreads narrow, it would provide strong tailwinds for the portfolio, similar to the early 2000s, helping it outperform its benchmark.
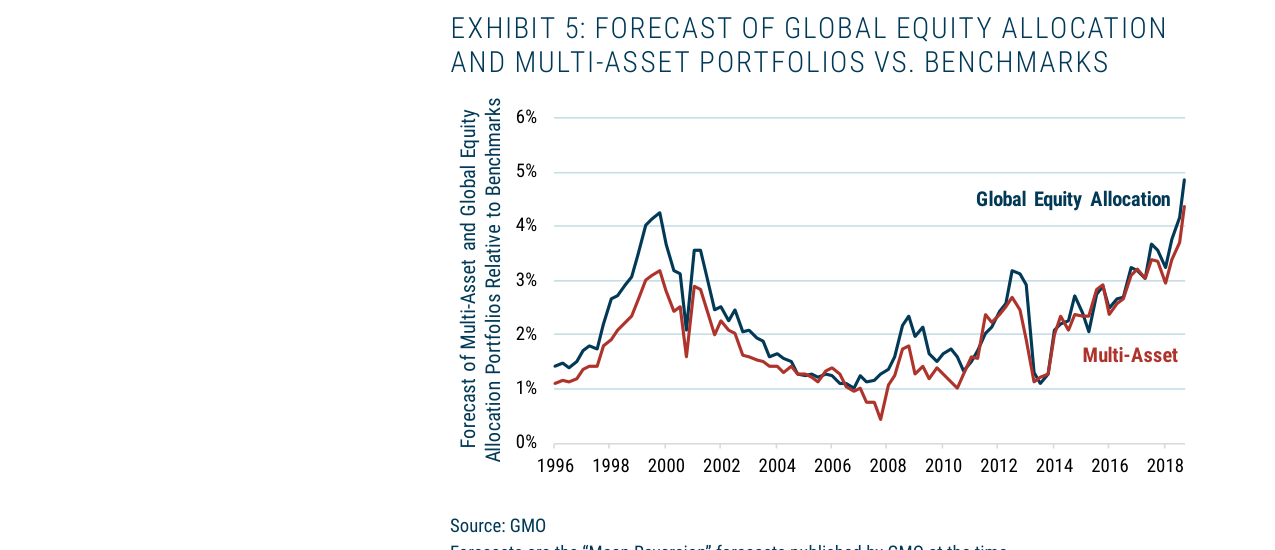
From December 1999 to August 2019, the valuation opportunity for EAFE relative to US stocks rose from the 68.9th percentile to the 99.9th percentile, and for Emerging Markets from the 88.7th to the 93.8th percentile
3. Fundamental Differences Between Current Bond Yields and 2000 Valuations
GMO emphasizes in footnote 4 the fundamental difference between the two:
- 2000: S&P 500 valuations implied "impossibly optimistic future growth," so the confidence in the mispricing was higher.
- 2019: Bond yields imply "extremely dismal future growth." While GMO believes the future will not be this bad, this outcome is not "impossible" (unfortunately does not qualify as 'impossible').
Key Inference: Although the current opportunity set is "in the ballpark" with 2000, the nature of the risk differs—2000 was closer to the certainty of a bubble bursting, while 2019 relies more on the realization of mean reversion assumptions.
4. Defensive Returns in Extreme Scenarios
GMO acknowledges that valuations may not revert to historical levels ("this time may in fact be different"), but even in a "dreary, low-return world" where valuations remain elevated, the portfolio still holds structural advantages:
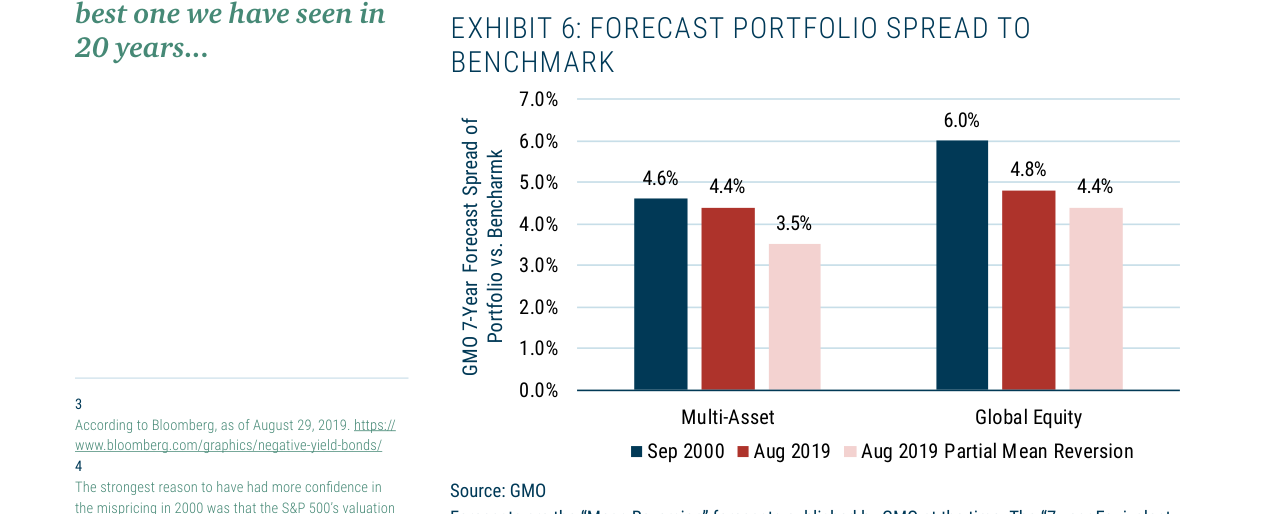
As of August 2019, the Global Equity Allocation strategy is forecast to outperform its benchmark by 6.0%, and the Multi-Asset strategy by 4.4%, both higher than the September 2000 levels
- Higher Income and Earnings: The current portfolio, by holding higher-yielding assets (e.g., EM stocks, high-yield bonds), can generate an additional ~1% return annually.
- Long-Term Loss Recovery: While it cannot immediately compensate for relative losses caused by valuation extremes, the annualized 1% extra return will generate significant compounding effects over the long term.
5. Terminology Evolution and Client Communication
Footnote 5 reveals an adjustment in GMO's internal terminology: they previously called the two forecast scenarios "Purgatory" and "Hell," but abandoned them due to client confusion (the "Hell" forecast was actually higher than "Purgatory"). This detail reflects GMO's effort to achieve clear communication within a complex forecasting framework.
6. Conclusion: Reconfirmation of Historical Extremes
GMO's final conclusion is clear: "Today is not 2000... but in our estimation, they are similarly extraordinary and far better than anything we had seen before that event or have seen since." That is, while the current opportunity set is not identical to 2000, it is equally extraordinary and superior to any period before or after that event.
Data Support: The 4.8% spread for the Multi-Asset portfolio (mean reversion) in Exhibit 6 is nearly flat with the adjusted 4.6% in 2000, while the 5.5% spread for the Benchmark-Free strategy sets a new historical high.