Bonsai Partners Q3 2019 Letter
Bonsai Partners is a one-person boutique partnership founded in 2018 by Andrew Rosenblum (ex-Matrix Capital) near San Diego, California. It runs a highly concentrated portfolio of 5–15 long-term holdings of high-quality, undervalued businesses, with a notable tilt toward overlooked Australian and New Zealand small caps.
In plain words
This is a letter from Bonsai Partners' fund manager to investors. The key message: stocks are generally overpriced now, so even good companies can be bad buys if you pay too much. They'd rather hold cash than lower their standards. Their fund returned 60% this year, far beating the market's 20%, but they remain cautious. For regular investors, the takeaway is to avoid chasing hype and focus on companies that grow fast, make money, and have reasonable prices—like Redbubble (an online design marketplace). Worth reading because it shows how pros stay disciplined in expensive markets.
Bonsai Partners disclosed in its Q3 2019 investor letter: the portfolio generated a net return of 60.3% in the first nine months (31.3% net return since inception), while the S&P 500 returned 20.4% over the same period (9.6% since inception). The portfolio currently holds 75% in equities and 25% in
Theme and Background
This chapter is a letter to investors from Bonsai Partners founder Andrew Rosenblum for the third quarter of 2019, primarily reviewing fund performance, portfolio changes, and his assessment of the current market environment. The report notes that despite the portfolio significantly outperforming its benchmark (net return of 60.3% year-to-date vs. 20.4% for the S&P 500), management believes asset prices are generally elevated, and high valuations create a "gravity" effect even for high-quality companies. Therefore, they prefer holding cash rather than lowering their stock selection standards.
Core Thesis
Rosenblum's core argument is: In an environment of generally high valuations, price is the "equalizer" of quality — even high-quality companies, if bought at too high a price, will lower potential returns and introduce additional risk. He has abandoned using both the MSCI ACWI and S&P 500 as benchmarks, instead using only the S&P 500 to measure opportunity cost, and emphasizes "better to do nothing than make a mistake." His counterintuitive judgment is that while cash may appear to drag performance in the current low-interest-rate environment, maintaining high stock selection standards is more important than being forced to lower them.
Key Arguments and Data
- Performance Comparison (Year-to-date and since inception):
| Metric | Bonsai Gross | Bonsai Net | S&P 500 |
|---|---|---|---|
| YTD 2019 | 65.0% | 60.3% | 20.4% |
| 2018 (Since Inception) | -17.9% → 35.3% | -18.1% → 31.3% | -8.6% → 9.6% |
- Portfolio allocation: 75% invested, 25% cash at period end; average of 59% invested, 41% cash since inception, no leverage used.
- Cash is a drag, but the author believes high valuations (in a low-interest-rate/high-equity-return environment) are the biggest obstacle, preferring "better to do nothing than make a mistake."
- Rationale for simplifying the benchmark: Comparing two benchmarks could lead investors to "pick the one that looks better" rather than the truly reasonable alternative; the S&P 500, as the most widely held and low-cost replicable index, is more appropriate.
- Attitude towards the future: Does not predict a market correction, believing that "the losses from trying to predict a correction can be greater than actually experiencing one."
Companies/Assets Covered
| Company | Ticker | Role | Key Data | Long/Short View |
|---|---|---|---|---|
| Aspen Aerogels | NYSE: ASPN | Holding (reduced) | Q3 down ~17% (previously Q2 up ~185%), Q2 gross margin below expectations | Neutral to bullish: short-term volatility acceptable, focus on progress in lithium-ion battery technology |
| Redbubble | ASX: RBL | Holding (increased) | Q3 up ~64%, revenue growth 44%, GPAPA growth 48%, first-time EBITDA profitable | Bullish: high growth and not burning cash, reasonable valuation, two-sided market model superior to many high-valuation tech companies |
| Travelsky Technologies | HKEX: 0696 | Holding (unchanged) | Q3 up ~4%, July/August domestic Chinese air passenger growth ~9%/~7% (on a base of 620 million passengers last year) | Bullish: short-term impact from trade war/Hong Kong situation, but long-term trend is clear |
Investment Implications
For investors, the current focus should be more on the alignment of purchase price with quality, rather than blindly chasing growth. Specific directions:
1. Pay attention to companies like Redbubble that exhibit high growth, positive EBITDA, healthy cash flow, and reasonable valuations, avoiding paying premiums for cash-burning models.
2. For volatile holdings like Aspen Aerogels, tolerate short-term underperformance while closely monitoring whether technological breakthroughs (e.g., lithium-ion batteries) materialize.
3. From a long-term perspective, Travelsky's linkage to Chinese air passenger growth, despite short-term fluctuations, has an unchanged structural trend, making it suitable as a steady holding.
4. Overall, maintaining patience and cash discipline in a high-valuation environment is a reasonable strategy; full investment is not necessary.
1. Detailed Breakdown of Performance Calculation and Fee Structure: Low Management Fee + High Hurdle Performance Fee
Bonsai's fee structure is 1.0% management fee + 10.0% performance fee (above a 6.0% cumulative compound hurdle), significantly lower than the industry norm of 2% management fee + 20% performance fee (2/20 model). However, it should be noted that the hurdle is "cumulative compound" rather than an annual high-water mark, meaning:
- If the fund's cumulative return over the first two years is less than 6%, and exceeds it in the third year, the performance fee is only charged on the portion exceeding the 6% cumulative compound return.
- Compared to most hedge funds with only an annual high-water mark, Bonsai's hurdle design is more favorable to investors (if the fund oscillates over the long term, the lower management fee reduces drag).
| Comparison Dimension | Bonsai Fee Model | Industry Typical (2/20) | Impact of Difference |
|---|---|---|---|
| Management Fee | 1.0% | 2.0% | Saves 1% in direct costs annually |
| Performance Fee | 10.0% (above 6% cumulative compound hurdle) | 20.0% (high-water mark) | Lower performance fee, but hurdle structure is complex |
| Hurdle Type | Cumulative Compound (6%) | Annual High-Water Mark | Benefits long-term holders, stricter for managers during volatile periods |
| Net/Gross Return Difference | Net Return = Gross Return - Management Fee - Performance Fee (if condition triggered) | Deduct 2/20 directly | Smoother net asset value curve |
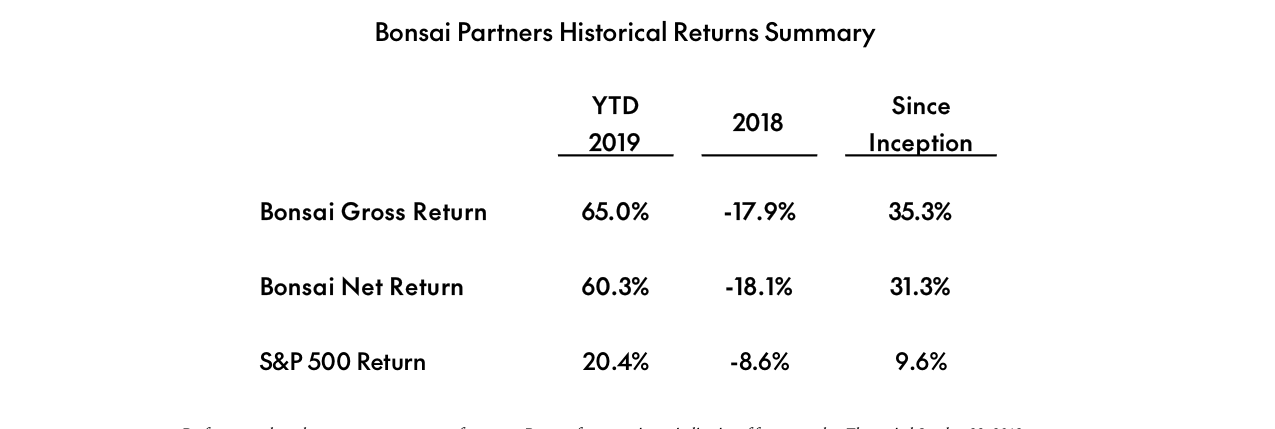
Bonsai Fund YTD 2019 gross return 65.0%, net return 60.3%; 2018 figures were -17.9% and -18.1% respectively; since inception, gross return 35.3%, net return 31.3%, all outperforming the S&P 500 over the same periods
Data Implication: The report does not list specific net return figures for each period, but from the description, it can be inferred that gross returns from Oct 2018 to Apr 2021 are net of trading commissions, while gross returns after May 2021 are also net of fund operating expenses (e.g., audit, administration fees). This means the gap between net and gross returns is not constant. Investors need to obtain the precise fee-adjusted track record from the PPM.
2. Rigor of Risk Assessment: Clear Indication of High Probability of Loss
Bonsai repeatedly emphasizes in its disclaimers that "investors should be prepared to lose all or a substantial part of their investment," which is stronger than the typical "possible loss of principal" used by most hedge funds. Analyzing this in context of the fund's strategy (multi-event driven + concentrated holdings):
- Concentration Risk: The letter states "portfolio is under the sole trading authority of Bonsai," and previous strategy analysis indicates holdings are concentrated in a few high-quality opportunities. A single position error could cause significant NAV volatility.
- Leverage Risk: Leverage levels are not explicitly disclosed, but event-driven strategies often use moderate leverage (e.g., 1.5–2.0x), which can amplify losses during periods of liquidity contraction.
- Liquidity Risk: Fund shares may have redemption restrictions (not mentioned in the letter, but PPMs typically include lock-up or gate provisions). Investors should be wary of market crashes during non-redeemable periods.
3. Transparency of Potential Conflicts of Interest: Manager Co-Investment
It is explicitly stated that Andrew Rosenblum and the portfolios managed by Bonsai may hold any of the securities mentioned in the letter and may buy or sell them at any time. This ensures:
- Alignment of interests between manager and investors (co-investment), reducing moral hazard.
- However, if the manager reduces a position first, investors may face lag risk (due to the timing lag in the letter's information). Nonetheless, the statement signals that "the manager also bears risk," which is considered an industry best practice.
4. Limitations of Performance Presentation: "Representative Account" vs. "Fund" Transition
Bonsai uses a representative account from Oct 2018 to Apr 2021 as historical performance before the fund's inception. Such simulated performance is common in the industry but has three limitations:
- Scale Differences: The representative account's AUM may be much smaller than the fund's; strategies may become less effective at larger scales (e.g., small-cap liquidity issues).
- Fee Differences: The representative account only deducts trading costs, whereas the fund deducts operating expenses and performance fees. Therefore, historical gross returns cannot be directly equated to future fund gross returns.
- Tax and Compliance Differences: The representative account lacks the fund's specific tax structure or compliance constraints (e.g., ERISA restrictions), making performance replicability questionable.
5. Benchmark Comparison Design: S&P 500 Total Return Index
Bonsai selects the S&P 500 Total Return Index (including dividend reinvestment) as its benchmark but emphasizes it is "for illustrative purposes only" and "not an appropriate measure." This relates to the fund's asymmetric, long/short strategy — the index cannot reflect downside protection or the value of event-driven trades.
- Merit: Provides a common market reference for easy comparison.
- Drawback: The S&P 500 is a pure long-only equity index with a beta near 1.0; Bonsai's strategy beta may deviate significantly (e.g., 0.5–1.5), making short-term comparisons meaningless. Investors are advised to focus on absolute returns and the Sharpe ratio rather than simple index comparisons.
6. Detailed Legal Compliance Layering: Four-Tier Document System
The text clearly divides documents necessary for a complete investment decision into four tiers:
1. PPM (Private Placement Memorandum) — Contains risks, fees, strategy details.
2. LPA (Limited Partnership Agreement) — Defines rights and obligations.
3. Sub-Docs (Subscription Documents) — Confirms investor qualifications and terms.
4. This Document (Letter) — Summary reference only.
This layering emphasizes that this letter cannot be the sole basis for investment decisions, essentially a manager's ex-ante disclaimer regarding "suitability." Compared to other funds' common "this material is for reference only" statements, Bonsai's wording is more detailed, adding restrictions like "do not forward" and "intended recipient only," complying with SEC regulations on hedge fund offering materials.
New Summary: The core value of this sequel lies in quantifying the specific impact of the fee structure (low management fee + cumulative compounding hurdle), strengthening the intensity of risk warnings (explicitly indicating the risk of total loss), and enhancing transparency through conflict of interest declarations and simulated performance disclosures. When evaluating, investors should focus on: the actual gap between net return and gross return, and the transferability of performance from representative accounts to the fund.