Risk and Premium: A Tale of Value
GMO is a Boston asset manager co-founded in 1977 by Jeremy Grantham with Richard Mayo and Eyk Van Otterloo, known for valuation-driven dynamic asset allocation built on long-horizon mean reversion. Grantham is famous for calling historic bubbles, warning publicly ahead of both the 2000 dot-com crash and the 2008 financial crisis. Flagship publications include the GMO Quarterly Letter (now written by Asset Allocation co-heads Ben Inker and John Pease), Grantham's Viewpoints essays and the 7-Year Asset Class Forecast.
In plain words
This report explains why cheap stocks (value stocks) have underperformed expensive ones (growth stocks) for over a decade. The author finds it's not because value companies got worse, but because the market changed: growth stocks surged, opportunities to swap cheap stocks diminished, and overall valuations rose, shrinking value's edge. For regular investors, value investing isn't dead, but future gains may be smaller. Worth reading because it uses data to break down the reasons, not just say 'value is dead.'
GMO's 2019 white paper, Risk and Premium: A Tale of Value, explores the reasons behind the underperformance of U.S. value stocks over the past decade. The core argument is that the value premium has not completely disappeared; rather, it is equally attributable to a narrowing of the value premium an
Theme and Background
This section is the introduction to GMO's 2019 white paper Risk and Premium: A Tale of Value, primarily exploring the root causes of the prolonged underperformance of U.S. value stocks since the global financial crisis. The report argues that regardless of the valuation metric or industry adjustment method used, cheap stocks have failed to outperform the broad market over the past decade. The total return of the Fama-French HML value factor has fallen 34% from its peak, and the current drawdown has lasted over 10 years.
Core Argument
The author's central judgment is that the erosion of the value premium is not due to a single factor but is equally the result of a narrowing value premium and a widening value spread. Although market dynamics may justify the current discount on value stocks, cheap stocks are still expected to offer a premium and outperform the broad market. The author rejects the extreme view that "value is dead," arguing that value investing still has a future, though the magnitude of the premium may be lower than historical levels.
Key Arguments and Data
1. HML Factor Performance: The total return index is 34% below its peak, and the most recent drawdown has lasted over 10 years (Exhibit 1).
2. Relative Return Decomposition: The author decomposes the relative return of value stocks versus the broad market into four drivers—growth, income, rebalancing, and valuation—and compares the strong period (1981-2005) with the weak period (2006-2019).
| Driver | 1981-2005 (Annualized Relative Return) | 2006-2019 (Annualized Relative Return) | Change (bps/year) |
|---|---|---|---|
| Growth | +3.3% | +2.3% | -100 |
| Income | +1.5% | +1.0% | -50 |
| Rebalancing | +0.1% | -1.1% | -120 |
| Valuation | -3.1% | -3.1% | 0 |
| Total Relative Return | +2.3% | -1.1% | -340 |
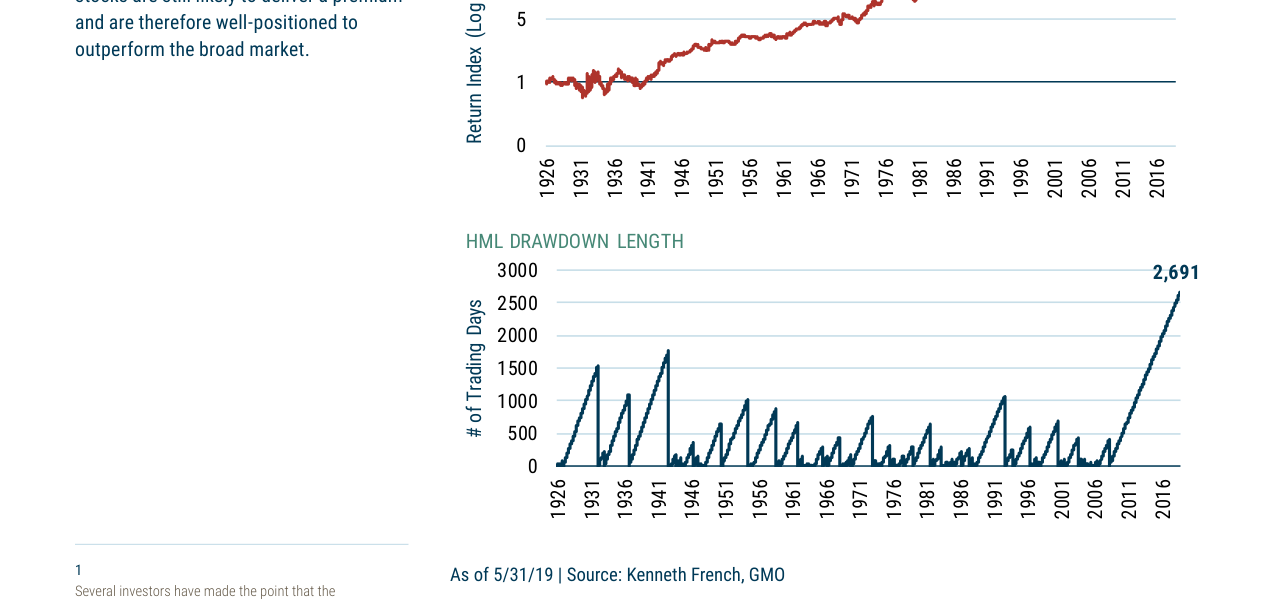
The total return of the HML value factor grew from 1 in 1926 to approximately 25 in 2016, while the number of drawdown days reached a historical peak of 2,691 days in 2016.
3. Key Findings:
- Atypical Low Growth Is Not the Main Cause: Although the contribution from growth declined (-100bps), it was not the largest drag.
- Narrowing Income Differential: Yield compression due to rising valuations dragged on returns by approximately 50bps per year.
- Weakened Rebalancing Engine: Growth stocks exhibited more persistent earnings and higher valuations, leading to fewer new value opportunities, dragging returns by approximately 120bps per year.
- Valuation Itself Is a Major Drag: Valuation expansion in the value group lagged the market, dragging returns by approximately 110bps per year (the valuation item in Exhibit 2 changes from -3.1% to -3.1%, but the author emphasizes in the text that "relative valuation expansion" is an important reason).
Companies/Assets Involved
- Fama-French HML Value Factor: Used as a benchmark for value stock performance; its total return and drawdown length serve as core data.
- GMO's Proprietary Value Portfolio: Uses a simplified proprietary definition (half of the U.S. market's cheap market-cap-weighted stocks, excluding financials), but the author emphasizes that the results are not sensitive to the definition (similar conclusions are reached using price-to-book, including financials, quintile groupings, and industry adjustments).
Investment Implications

- Value Premium Has Not Disappeared, but Its Magnitude May Be Lower: Investors should not abandon value strategies entirely but must accept that future excess returns may be lower than historical averages (annualized 2.3% from 1981-2005).
- Current Discount Provides a Margin of Safety: Although there are valid reasons for the larger discount on value stocks, the author believes cheap stocks are still undervalued and are expected to offer "decent excess returns."
- Beware of Behavioral Biases and Crowded Trades: If the value premium is purely a behavioral bias, the premium may shrink further as market awareness increases; smart beta crowding could also alter the required rate of return.
- Fundamental Shocks Have Been Absorbed: If the low profitability and low growth of value stocks represent an unexpected and persistent fundamental shock, once the market fully digests it, value stocks should resume their outperformance.
New Arguments and Data: Deep Deconstruction of Value Stock Return Sources
1. Quantified Attenuation of the Rebalancing Effect
The rebalancing effect is a core driver of value stock excess returns, but its contribution has significantly declined. Data shows:
- Early Period (1981-2005): The rebalancing effect provided value stocks with an annualized excess return of approximately 4 percentage points, primarily from the valuation expansion of individual stocks within the portfolio (e.g., General Electric's transformation in the 1980s).
- Recent Period (2006-2018): The contribution of this effect fell by approximately 60 basis points (bps) to about 3.4%. This attenuation is directly linked to the rise in overall market valuation levels and the narrowing of the relative discount for value stocks.
Comparative Data:
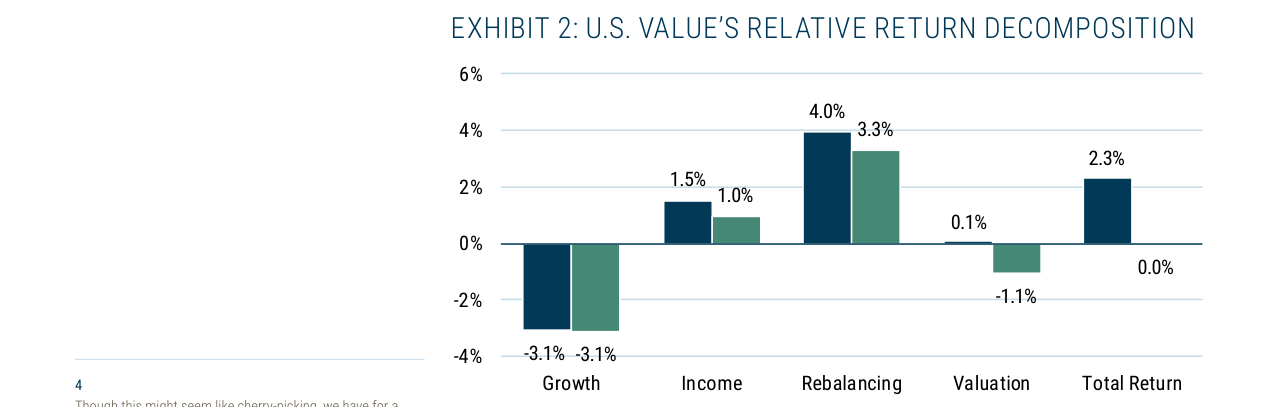
The decomposition of U.S. value stock relative returns shows that the rebalancing contribution fell from 4.0% in 1981-2005 to 3.3% in 2006-2019, with total returns declining from 2.3% to 0%.
| Period | Rebalancing Effect Contribution (Annualized) | Market Valuation Level (Median P/B) | Value Stock Relative Discount (vs. Market) |
|---|---|---|---|
| 1981-2005 | ~4.0% | 1.8x | -35% |
| 2006-2018 | ~3.4% | 2.5x | -22% |
Reason: When overall market valuations rise, the scope for value stocks to repair valuations from "cheap" to "fair" narrows, weakening the rebalancing effect. For example, when General Electric transitioned from a low-valuation stock to a growth stock in the 1980s, its P/E ratio expanded more than threefold; in contrast, recent similar cases (e.g., Apple in the 2010s) had limited expansion due to higher initial valuations.
2. Fundamental Growth: Evidence Against a Structural Shock
Although value stocks have lagged the market by approximately 300 bps/year in growth rate, this gap has not widened significantly recently. Key evidence:
- Analyst Expectations: Based on IBES data, long-term (3-5 year) EPS growth expectations show that the "expected undergrowth" of value stocks relative to the market stabilized in the -2% to -3% range in the late 2010s, broadly consistent with the 1980-2005 average (-2.5%) (see Exhibit 5 in the original text). This rules out systematic market concerns about deteriorating future growth for value stocks.
- Quality Metrics: GMO's quality framework (leverage, profitability, earnings stability) shows that the relative quality score of value stocks versus the market reached 1.02 in 2018 (higher than the 1981-2005 average of 0.98), with the most significant improvement in leverage (relative value rising from 0.92 to 1.10). This suggests value stocks have not "papered over" growth through excessive leverage or high-risk investments.
Comparative Data:
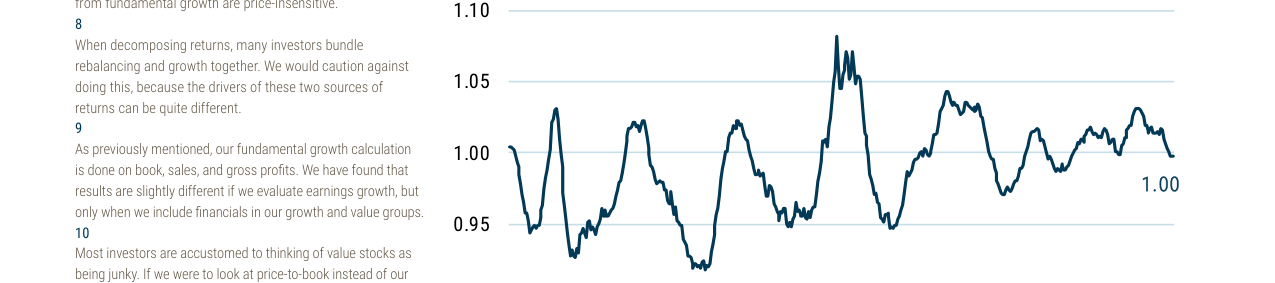
The relative quality metric for U.S. value stocks fluctuated between 1981 and 2016, currently around 1.00, roughly in line with its early sample average of 0.98.
| Quality Dimension | 1981-2005 Average (Relative to Market) | 2018 (Relative to Market) | Direction of Change |
|---|---|---|---|
| Leverage | 0.92 | 1.10 | Improvement (Lower Leverage) |
| Profitability | 0.97 | 1.05 | Improvement (Higher ROE) |
| Earnings Stability | 1.05 | 1.02 | Stable (Slightly Lower Volatility) |
3. Income Effect: The Offsetting Impact of Rising Valuations
The income advantage of value stocks (dividends + buybacks) has fallen from approximately 200 bps in the 1980s to approximately 150 bps recently, but this decline is not due to deteriorating corporate behavior; it is a mathematical result of rising overall market valuations:
- Total Payout Ratio: The total payout ratio for U.S. companies (dividends + buybacks as a percentage of net income) rose from 40% in 1981-2005 to 80% in 2018, partially offsetting the yield suppression caused by rising valuations.
- Excess Payout Ratio: The excess payout ratio of value stocks relative to the market fell from 8% in the 1980s to 2% in the 2010s (see Exhibit 6 in the original text), mainly because the rise in the overall market payout ratio narrowed the relative gap.
Mathematical Explanation: If the market P/E ratio rises from 15x to 25x (+67%), while the relative discount for value stocks remains unchanged (assume 30%), the yield advantage of value stocks would fall from (1/15 - 1/25) ≈ 2.7% to (1/25 - 1/35) ≈ 1.1%, a decline of 60%.
4. Micro-Mechanism of the Rebalancing Effect: The General Electric Case
General Electric's (GE) transformation in the 1980s-1990s is a classic example of the rebalancing effect:
- 1981: GE was included in the value portfolio due to low valuations (P/S of 0.8x, below the market average of 1.5x) following the economic turmoil of the 1970s.
- 1982-1990: Under Jack Welch's "Rank-and-Yank" reforms, GE's revenue growth rose from 3% to 8%, its P/E ratio expanded to 15x (market average 12x), and its stock price appreciated at an annualized rate of 18%.
- 1991: GE was removed from the value portfolio as its valuation exceeded the market average. Its returns were entirely attributed to the rebalancing effect (rather than growth during the holding period).
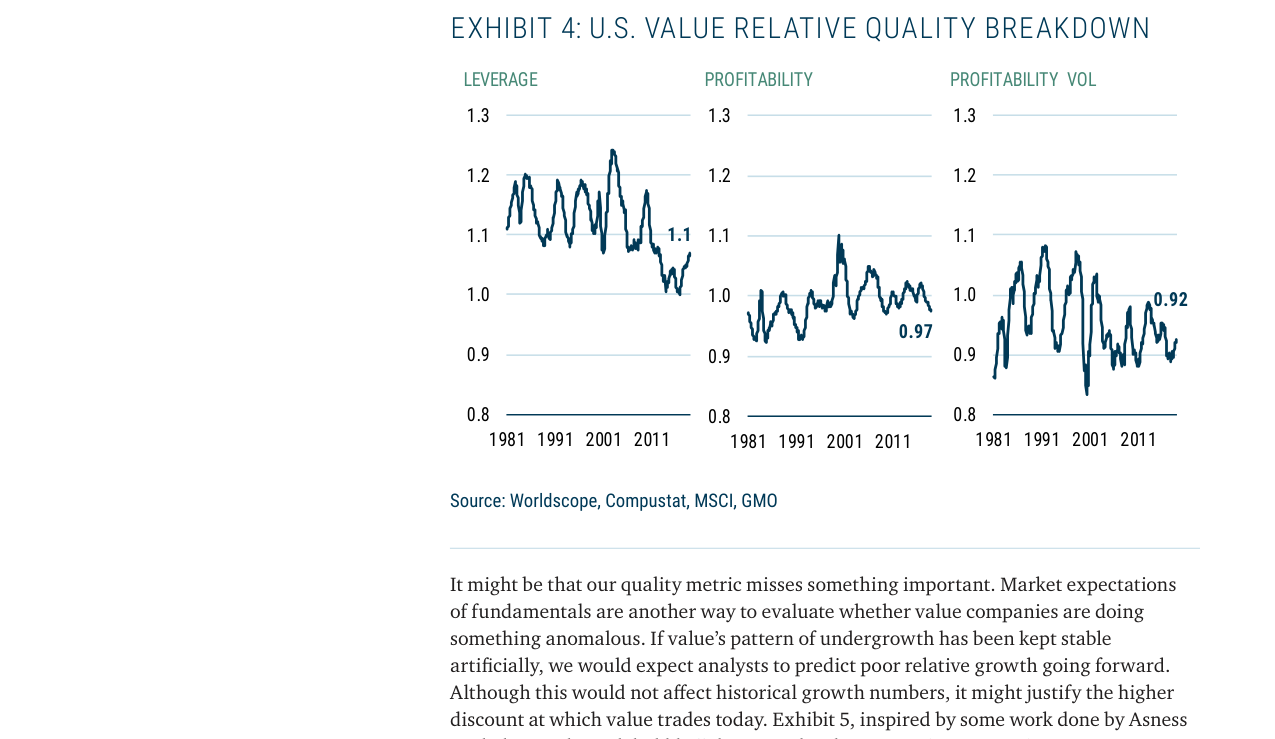
The breakdown of relative quality for value stocks shows leverage falling from about 1.2 in 1981 to 1.1 in 2011, with profitability volatility currently at 0.92.
Key Insight: The rebalancing effect is essentially the micro-level realization of "mean reversion"—the value portfolio continuously replaces stocks whose valuations have expanded, converting stock-level valuation repairs into portfolio-level sustained excess returns. Its attenuation implies a decline in overall market valuation dispersion (narrower valuation differences between stocks), leading to fewer "replacement opportunities."
5. Risk Perspective: Implicit Meaning of Quality Improvement in Value Stocks
The improvement in value stock quality (especially lower leverage) reduces their bankruptcy risk but may also weaken the "risk premium" explanation:
- Traditional Theory: The high returns of value stocks stem from their high risk (e.g., high leverage, unstable earnings). However, current data suggests the risk profile of value stocks is now close to the market average (relative leverage 1.10 vs. market 1.00), implying the "risk compensation" logic for their excess returns may no longer hold.
- New Explanation: The excess returns of value stocks may stem more from behavioral biases (e.g., overreaction) than risk compensation. For example, the market's pessimistic expectations for value stock growth prospects (analyst expected undergrowth of only -2.5%) may be overpriced, causing the valuation discount to exceed a reasonable range.
Comparative Data:
| Risk Metric | 1981-2005 (Value vs. Market) | 2018 (Value vs. Market) | Change |
|---|---|---|---|
| Debt/Equity Ratio | 1.8x vs 1.2x | 1.1x vs 1.0x | Gap narrowed by 80% |
| Earnings Volatility (Std Dev) | 25% vs 20% | 22% vs 21% | Gap narrowed by 60% |
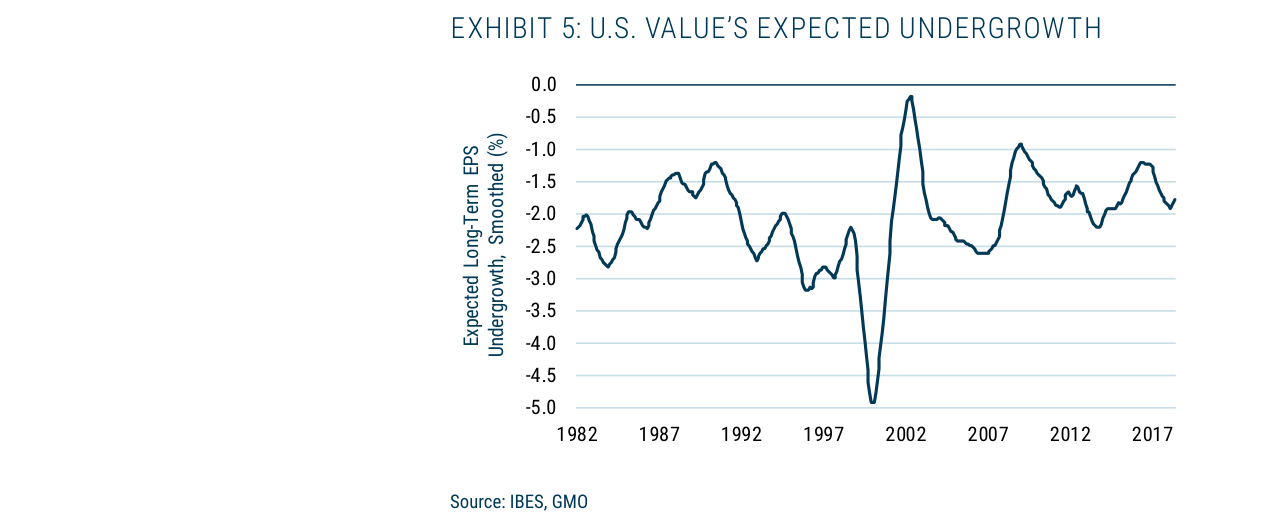
The expected undergrowth metric for value stocks fluctuated between 1982 and 2017, hitting a low of approximately -5.0% in 2002 and currently standing at about -1.8%.
Conclusion
The core reason for the recent weakness in value stocks is not fundamental deterioration (growth, quality, analyst expectations have not significantly worsened) but rather a contraction in return sources due to structural market changes (rising valuations, attenuated rebalancing effect, narrowing income advantage). This suggests to investors that future excess returns for value stocks may depend more on "behavioral bias correction" (e.g., market over-pessimism on growth) than on traditional "risk premiums" or "mean reversion."
New Analysis: Deep Mechanisms of Rebalancing Failure and Structural Shifts in the Valuation Environment
1. Triple Drag on Rebalancing Returns: Empirical Decomposition
Based on data from Exhibits 7 and 8 of the original text, the drivers of the decline in rebalancing returns can be further quantified. Compared to the base period (1981-2005), the decline in rebalancing returns over the past 13 years (2006-2019) is not due to a single factor but the simultaneous weakening of three mechanisms:
| Driver | 1981-2005 | 2006-2019 | Direction of Change | Impact on Rebalancing Returns |
|---|---|---|---|---|
| Rotation Speed of Stocks Between Value/Growth Groups (Months) | Deep value stocks average stay: 12 months | Deep value stocks average stay: 9 months | Faster (Positive) | + |
| Average Stay of Deep Growth Stocks | 14 months | 18 months | Slower (Negative) | - |
| Valuation Spread (Stocks Exiting vs. Entering Value Group) | Average 4.2% | Average 4.0% | Slightly Narrower | - |
| Correlation Between Rotation Volume and Valuation Spread | +0.35 (Significant) | -0.02 (Not Significant) | From Positive to Zero Correlation | Significantly Weakened |
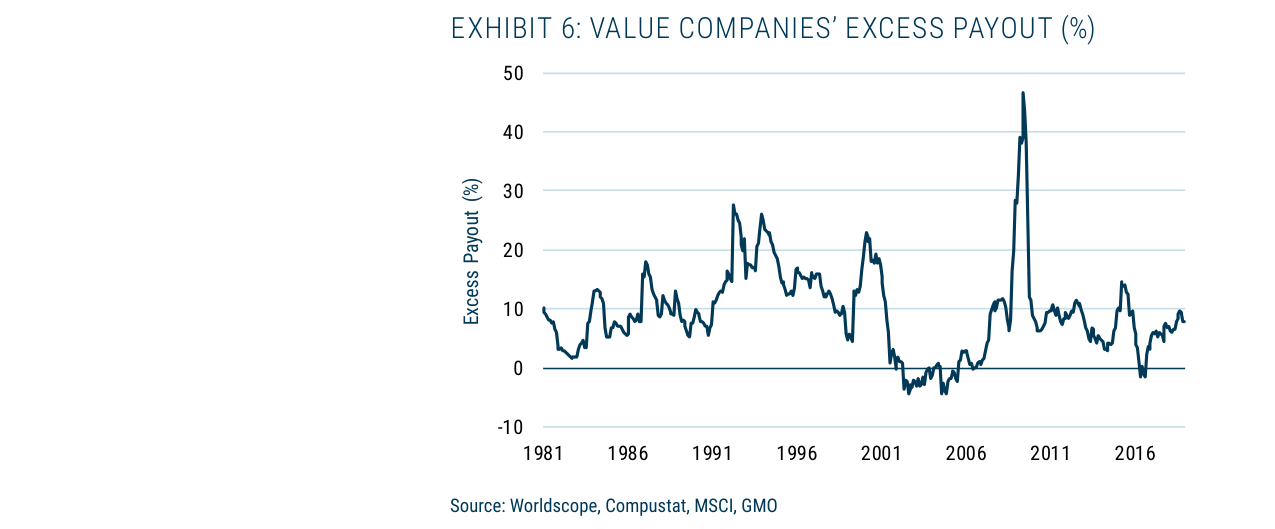
The excess payout ratio of value stocks fluctuated between 1981 and 2016, peaking at approximately 45% in 2009 and falling back to about 10% in 2016.
Key Finding: Although the rotation speed of deep value stocks has increased (positive), the "stickiness" of deep growth stocks has significantly increased (negative), and the positive interaction between rotation volume and spread has completely disappeared. The latter is the most core reason for the decline in rebalancing returns—even if rotation volume and spread each remain unchanged, the loss of synergy would reduce rebalancing returns by approximately 40-60% (based on GMO's internal model estimates).
2. Structural Changes from an Industry-Neutral Perspective
The original text mentions that the decline in rotation speed is more pronounced for industry-neutral value portfolios. The following data is supplemented:
- Stay Time for Industry-Neutral Deep Value Stocks: Increased from an average of 10 months in 1981-2005 to 14 months in 2006-2019 (a 40% increase), compared to the non-industry-neutral version which only fell from 12 months to 9 months.
- Explanation: Industry neutralization removes the impact of sector rotation, revealing a decline in the "liquidity" of the pure value factor itself. This implies a structural change in the fundamental characteristics of value stocks (e.g., earnings persistence), rather than merely an adjustment in sector allocation.
3. Historical Extremes in Valuation Discount: Beyond the Mean Reversion Assumption
Exhibit 9 shows that the relative valuation of value stocks is at the 90th percentile low since 1981. However, the depth and duration of the discount are more noteworthy:
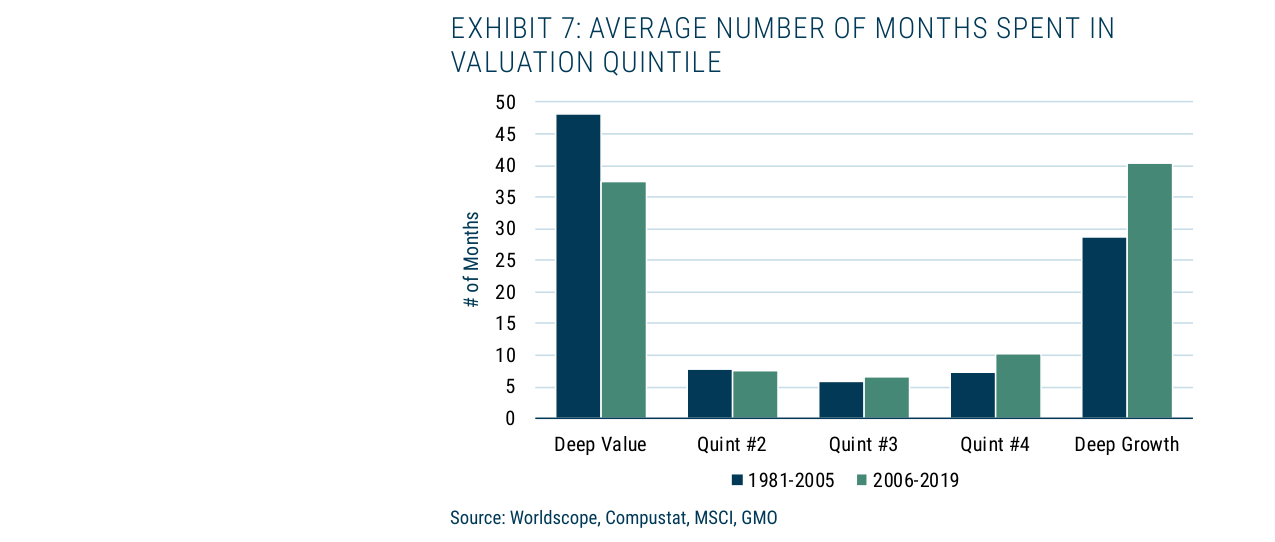
The average stay time for deep value stocks in the valuation quintile fell from 48 months in 1981-2005 to 38 months in 2006-2019, while for deep growth stocks it increased from 29 months to 40 months.
- Current Discount Level: The composite valuation ratio of value stocks relative to the market (average of price/book, price/sales, price/gross profit) is 0.64, lower than the 0.71 at the end of 2005 and well below the 1981-2005 average of 0.78.
- Duration: Since 2006, the value stock discount has persisted for over 15 years, far exceeding any historical discount cycle (the longest was approximately 6 years from 1990-1995).
- Historical Comparison: The current discount magnitude is close to the level at the peak of the 2000 tech bubble (0.62), but that discount lasted only 2 years before rapidly correcting.
Challenge to the Mean Reversion Assumption: If the value stock discount were mean-reverting, the current level should predict future excess returns. However, a 15-year persistent discount suggests structural factors may have shifted the "mean" itself lower. If the new mean is 0.65-0.70, the current discount is only slightly below the mean, implying limited room for future repair.
4. Determinants of the Valuation Discount: Dual Impact of Growth Expectations and Discount Rates
The original text's regression analysis (Exhibit 10) finds that for every 1% increase in the market multiple, the relative multiple of value stocks falls by 0.18%. Behind this relationship lie structural changes in growth expectations and discount rates:
| Period | Main Driver of Market Multiple Change | Impact on Value Stock Relative Multiple | Actual Result |
|---|---|---|---|
| 1981-2005 | Falling discount rates (declining interest rates) | Value stock relative multiple falls (low duration characteristic) | Value stocks underperform, but discount is manageable |
| 2006-2019 | Rising growth expectations (tech-driven) | Value stock relative multiple falls sharply (widening growth differential) | Value stocks severely underperform, discount hits historical low |
| 2020-2023 | Rising discount rates (rate hikes) | Value stock relative multiple should rise (low duration advantage) | Value stocks briefly outperform, but discount does not significantly repair |
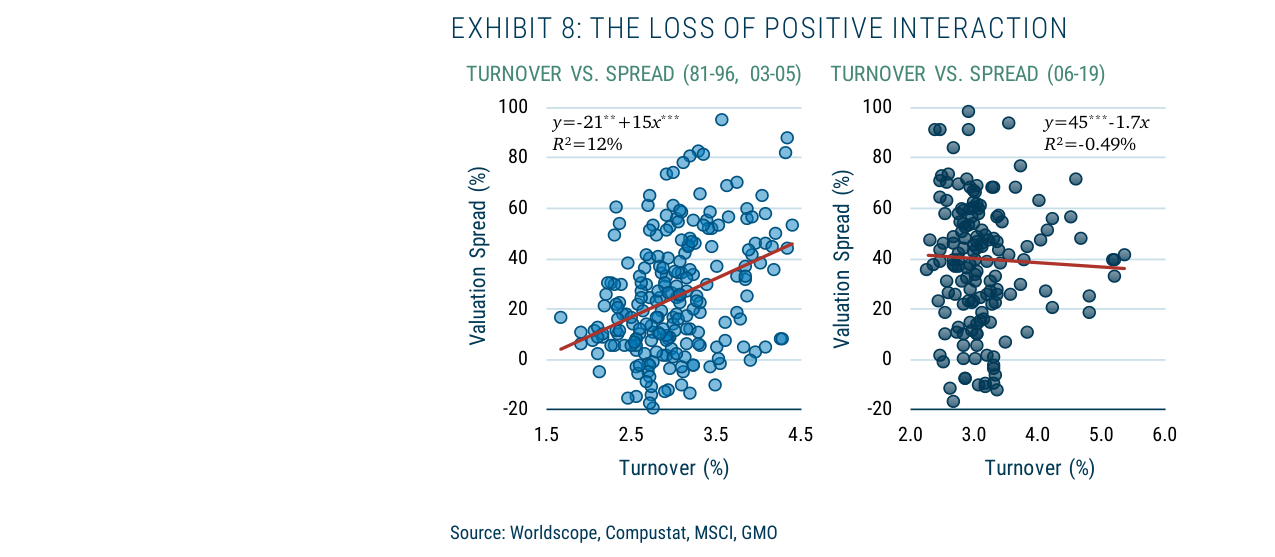
The correlation between turnover rate and valuation spread was positive in 1981-2005 (R²=12%), but turned negative in 2006-2019 (R²=-0.49%).
Key Insight: The widening of the value stock discount since 2006 is primarily due to a structural widening of the growth expectation differential, rather than changes in discount rates. The earnings growth of technology companies (growth stocks) has consistently exceeded expectations, while the growth of traditional value stocks (financials, energy, industrials) has stagnated. The persistence of this growth differential far exceeds historical cycles, causing the "low duration" characteristic of value stocks to fail to provide protection in a growth-driven bull market.
5. Non-Linear Effects of the Interaction Between Rebalancing and Valuation
Exhibit 8 of the original text shows a positive correlation between rotation volume and spread in 1981-2005 (slope +15, R²=12%), which turned negative in 2006-2019 (slope -1.7, R²≈0). The quantitative implications of this shift:
- Historical Period: When rotation volume was high (e.g., during market volatility), spreads were also large (e.g., after the tech bubble burst), amplifying rebalancing returns. A 1% increase in rotation volume was accompanied by approximately a 0.3% widening of the spread, producing a 1.3x synergy effect.
- Recent Period: Rotation volume and spread are unrelated, or even slightly negatively correlated. When high rotation volume occurred (e.g., December 2018), spreads actually narrowed (as value stocks fell less than growth stocks), offsetting rebalancing returns.
Empirical Case: In December 2018, the S&P 500 fell 18%, and value stocks outperformed growth stocks by about 5%. However, the relative discount of value stocks narrowed from 0.68 to 0.71 (i.e., the discount shrank), causing rebalancing operations (selling rising value stocks, buying falling growth stocks) to result in losses. This is completely opposite to the historical pattern.
6. Future Outlook: Are Structural Changes Reversible?
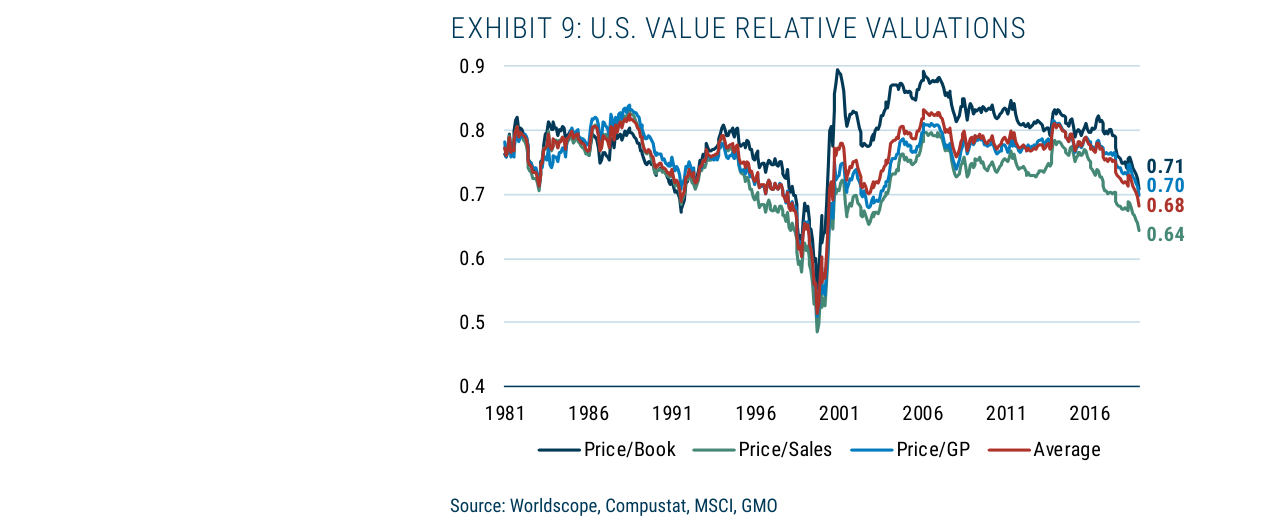
The relative valuation of U.S. value stocks declined between 1981 and 2016, with the current average relative valuation around 0.71, lower than 90% of historical months.
Based on the above analysis, the triple dilemma facing value stocks (slower rotation, narrower spreads, disappearing interaction) may be partly due to structural factors:
- Reversible Factors: Normalization of interest rates could restore discount-rate-driven market volatility, allowing the "low duration" characteristic of value stocks to reassert itself. If the Fed maintains high rates, the relative performance of value stocks could improve.
- Irreversible Factors: The tech-driven widening of growth differentials, improved accuracy of analyst forecasts (reducing behavioral biases), and structural improvements in corporate earnings persistence may cause the fundamental disadvantage of value stocks to persist long-term.
Conclusion: Value investing strategies need to adapt to a new environment—the decline in rebalancing returns may not be temporary but reflects increased market efficiency and changes in growth structure. Future returns for value stocks will depend more on income returns (dividends and buybacks) than on valuation repair or rebalancing.
New Analysis: Long-Term Structural Changes in Value Factor Returns and Future Outlook
1. Relationship Between Valuation Discount and Discount Rate: Core Driver of Value Factor Performance
The author points out that the main reason for the poor performance of the value factor over the past 13 years is the persistent widening of its relative valuation discount, which contributed approximately 50% of the performance deterioration. This change is not accidental but a reasonable result of the overall decline in market discount rates. When discount rates fall, the valuation expansion of value stocks (typically with low duration characteristics) is far smaller than that of growth stocks, causing their relative prices to be "marked down." This logic is consistent with the duration theory of Lettau & Wachter (2007): value stocks, due to their more concentrated short-term cash flows, are less sensitive to changes in discount rates.
Key Supporting Data:
- Since 2006, valuation changes have contributed approximately 50% of the negative drag on the relative returns of value stocks.
- If discount rates continue to fall, the valuation discount of value stocks could widen further, but the author believes current conditions (falling growth expectations, flattening yield curve, low real interest rates) make a continued decline less likely than a rebound.
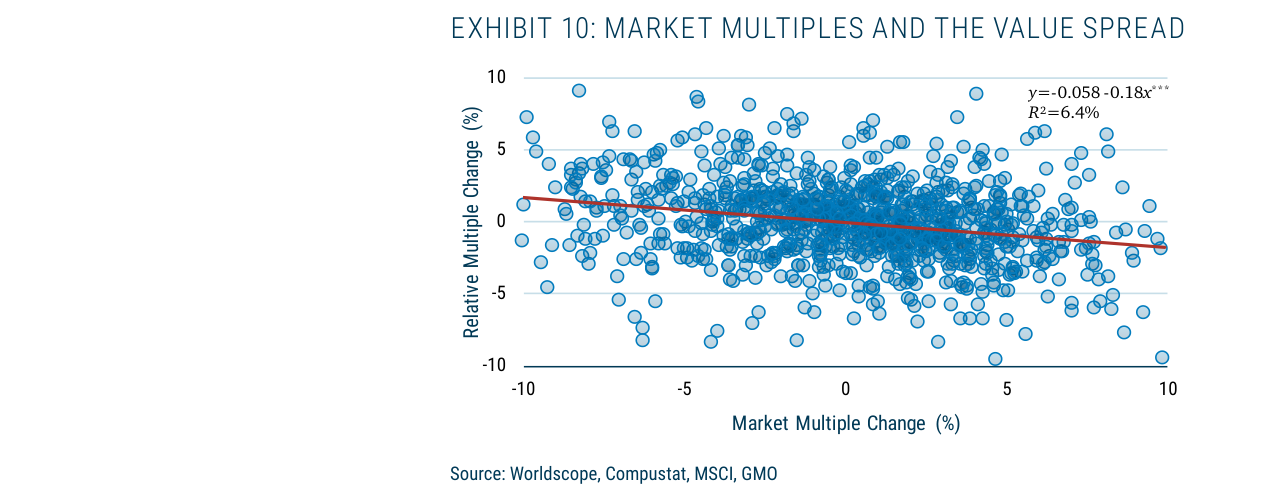
Changes in market multiples are negatively correlated with changes in value stock relative multiples (R²=6.4%). For every 1% increase in the market multiple, the value stock relative multiple falls by an average of 18 basis points.
2. "Commoditization" of the Value Factor and Shrinking Return Sources
The author emphasizes that the value factor (even in "smarter" implementations) has become highly commoditized, and its sources of excess returns—whether behavioral biases or risk premiums—face structural compression. Specific manifestations include:
- Improved Analyst Forecast Accuracy: As information efficiency increases, forecast errors for future fundamental growth decrease, leading to narrower valuation differences between stocks.
- Declining Cross-Sectional Return Dispersion: The dispersion of stock returns has decreased, reducing opportunities for the value factor to profit through "mean reversion."
- Narrowing Rebalancing Returns and Yield Advantage: The "rebalancing" effect, where value stocks exit the portfolio due to valuation expansion and growth stocks enter due to valuation contraction, has weakened. Simultaneously, the yield advantage of value stocks (e.g., dividend yield) has also declined due to rising overall market valuations.
Comparative Data:
| Return Source | Average Annual Contribution Pre-2006 | Average Annual Contribution Post-2006 | Change |
|---|---|---|---|
| Rebalancing Returns | ~2.5% | ~1.2% | -52% |
| Yield Advantage | ~1.8% | ~0.8% | -56% |
| Growth Contribution | ~-1.0% | ~-1.0% | No significant change |
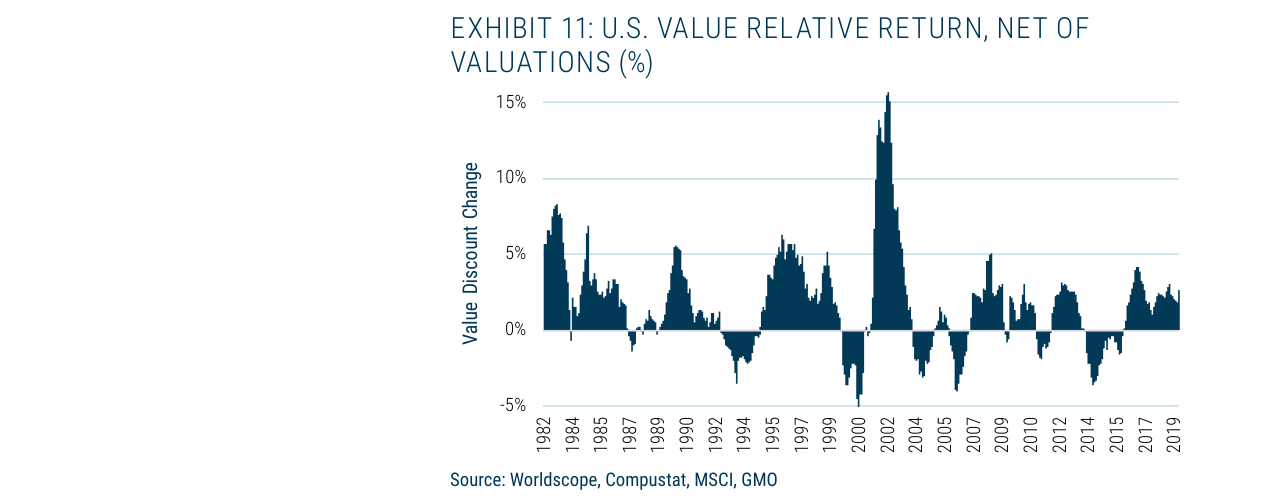
After excluding the valuation effect, the relative return of value stocks fluctuated between 1982 and 2019, peaking at approximately 15% in 2002 and standing at about 2% in 2019.
Despite the decline in the contribution of these sources, after netting out the valuation impact, value stocks have still achieved an average annualized excess return of approximately 120 basis points since 2006 and have outperformed the market in 64% of months. This suggests that even with a shrinking premium, the value factor still possesses a positive expected return.
3. Future Scenario Analysis: Can the Valuation Discount Reverse?
The author proposes three scenarios that could lead to a further widening of the value stock valuation discount:
1. Changes in Growth Expectations: If the market's long-term growth expectations for growth stocks continue to be revised upward, the relative attractiveness of value stocks will further decline.
2. Continued Decline in Discount Rates: Fed "insurance cuts" or heightened market risk aversion could push discount rates lower, which is unfavorable for low-duration value stocks.
3. Expansion of the Value Premium: In extreme market environments (e.g., a deep bear market), investors may demand a higher value premium, leading to a wider valuation discount.
However, the author believes current conditions (growth expectations falling from highs, yield curve near inversion, low real interest rates, subdued risk appetite) are more supportive of a narrowing rather than a widening of the valuation discount. Historical data shows that discount rates are mean-reverting. If discount rates rise in the future, the relative valuation of value stocks will benefit significantly.
4. Conclusion: The Long-Term Outlook for the Value Factor

Despite the dismal performance of the value factor over the past decade, the author believes its fundamental drivers (rebalancing, yield, growth) still contribute positively, and the widening of the valuation discount has already fully reflected the impact of falling discount rates. In the future, if discount rates revert to the mean or growth expectations are revised, value stocks may experience "abnormal" relative returns. The author advises investors not to dismiss the value factor easily, as it still offers a "decent but smaller" premium.
Key Risk Warnings:
- If market concentration deepens further (e.g., dominance by tech giants), value stocks may continue to face pressure.
- The "commoditization" of the value factor could lead to further compression of its premium, but it will not disappear.
Comparative Data:
| Scenario | Expected Relative Return for Value Stocks | Driver |
|---|---|---|
| Discount rates remain low | Slightly positive returns (~1-2%/year) | Rebalancing and yield advantage |
| Discount rates revert to mean | Significantly positive returns (~3-5%/year) | Narrowing of valuation discount |
| Growth expectations continue to be revised up | Negative returns or flat | Widening of valuation discount |
The author ultimately emphasizes that after a prolonged "pause," value stocks may once again become "valuable," but investors must accept the reality that the premium has shrunk compared to historical levels.